

 PDF
PDF ePub
ePub Citation
 Print
Print


Introduction
The clinical usefulness of the exercise treadmill test (ETT) based on the change of ST-segment for the diagnosis of coronary artery disease (CAD) is known to be limited due to its poor diagnostic accuracy.1) In this regard, stress tests using additional imaging tests, such as exercise stress echocardiography (ESE), stress cardiac magnetic resonance imaging, and coronary computed tomographic angiography (CCTA) are more reliably used in clinical practice.2) Among these non-invasive tests, ESE has the advantage of noninvasiveness and no need for contrast agents or radiation. However, it should be performed by experts, and diagnostic accuracy can be affected by the skill and experience of the sonographer.3)
Recently, changes in high-frequency components of the QRS complex (HFQRS) were reported to precede ST-segment abnormalities during myocardial ischemia and to be more sensitive and specific in detecting coronary ischemia.4-6) If HFQRS analysis were integrated as a part of ESE, it might improve the diagnostic accuracy of the test and provide additional diagnostic value. Nevertheless, the clinical introduction of HFQRS has been delayed and its practical application has been tested in a clinical setting only recently.7)8) Therefore, we sought: 1) to confirm the diagnostic usefulness of HFQRS for the detection of CAD; 2) to determine whether it would be possible to analyze HFQRS during ESE; and 3) to evaluate the diagnostic accuracy of HFQRS analysis along with ESE and ETT in comparison with coronary angiography (CAG).
Subjects and Methods
Study subjects
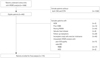
The ethical review board of Samsung Medical Center, Seoul, Korea, approved this study. Among 1698 patients who had undergone ESE with HFQRS analysis, 440 patients had also been evaluated with either CCTA or invasive CAG. Exclusion criteria were as follows; patients who had cardiomyopathy and/or resting regional wall motion abnormalities, patients who were evaluated for severe valve disease or who had follow-ups for prior coronary bypass graft surgery, patients with QRS duration >120 msec or with poor electrocardiogram (ECG) quality, and patients with poor exercise capacity to perform ETT. After the exclusion of 265 patients, 175 patients were ultimately analyzed (Fig. 1).
Treadmill exercise stress echocardiographic and high-frequency components of the QRS complex analysis
After baseline rest images were obtained from standard echocardiographic windows, patients underwent a symptom-limited treadmill exercise according to the Bruce protocol for ESE. Parasternal long and short-axis, apical four-, two-, and three-chamber views were captured in the left lateral position at rest and immediately after exercise using a GE Vivid 7® system with a 3.5 MHz transducer. Twelve-lead ECG (HyperQ Stress System, BSP Ltd., Tel Aviv, Israel) was obtained just before treadmill exercise for baseline, and continuously recorded thereafter during exercise testing, including the recovery phase. Offline analysis for quantitative changes of ST-segment and HFQRS intensity was performed by a researcher who was blinded to the clinical information of the patients, as described in the previous study.8) Briefly, ECG monitoring data during ESE were obtained from high-resolution ECG traces. The HyperQ stress system measured ST-segment level was defined as 60 msec after the J point. ST-segment analysis was considered positive if horizontal or down-sloping ST-segment depression ≥1 mm was found in ≥2 consecutive leads. Antihypertensive drugs such as beta-blockers and calcium channel blockers were discontinued >48 hours before ESE. ESE data were also analyzed offline by one researcher who was blinded to the clinical status of the study subjects. Worsening regional wall motion of post-exercise images in ≥2 consecutive segments was considered as positive ESE.
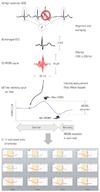
High-frequency components of the QRS complex data were obtained from a high-resolution 12-lead ECG using an automatic algorithm (HyperQ Stress System) as presented in Fig. 2. The software calculated the absolute decrease in HFQRS intensity, which was defined as the difference between maximal and minimal values and the relative decrease in HFQRS intensity, defined as the percentage decrease compared to maximal HFQRS value on every lead. Positive HyperQ lead was defined if there were both a relative decrease in HFQRS intensity ≥50% and an absolute reduction ≥1 µV with sufficient signal quality. HFQRS analysis was considered positive if there were ≥3 positive HyperQ leads during exercise.
Coronary CT and invasive coronary angiography
The presence of significant CAD was evaluated by either CCTA or invasive CAG. As the negative predictive value of CCTA was proven to be high, if there were no significant coronary stenosis in CCTA, the patient was regarded as having negative CAD. In cases of intermediate lesions in CCTA, invasive CAG were performed and the subjects were regarded as having positive CAD if there were ≥70% stenosis in the epicardial coronary artery. Otherwise, they were regarded as having negative CAD.
Statistical analysis
Statistical analysis was performed using statistical package Statistical Package for the Social Sciences (SPSS) 19.0 (SPSS Interactive Graphics, Version 19.0, Chicago, IL, USA). Data are presented as means±SD or as frequencies. Continuous variables were compared by a Student t-test and categorical data was analyzed using a chisquare or Fisher's exact test. Multivariable logistic regression analysis using variables with clinical significance and/or p<0.05 in the univariate analysis and receiver operational characteristic (ROC) curve analysis using C-statistics were performed to evaluate which parameters were independently related with the diagnosis of CAD. A p<0.05 was considered significant.
Results
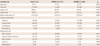
Baseline clinical characteristics of the 175 study subjects according to the results of the HFQRS analysis are presented in Table 1. The mean age was 57±9 years, and 118 (67%) subjects were men. There were more men among the patients with positive HFQRS analysis (79% vs. 46%, p=0.018) and they were slightly taller and had a more frequent history of diabetes compared to those with negative results. Otherwise, there were no significant differences in baseline characteristics according to the results of HFQRS analysis.
Exercise test data and the presence of CAD determined by the CCTA and/or invasive CAG are presented in Table 2 according to the results of HFQRS analysis. Heart rate was not significantly different at the baseline, but it was slightly higher at peak exercise in those with negative HFQRS results compared to those with positive results. A modified Duke treadmill score (MDS) was significantly lower in the patients with positive HFQRS results. Otherwise, there was no significant difference in exercise time according to the results of HFQRS analysis.
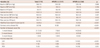
Significant CAD was found in 32 patients (18%) and the overall diagnostic property of the stress tests, including ST-segment analysis and HFQRS analysis of ETT, and ESE are presented in Table 3. Sensitivity and specificity of the HFQRS analysis were 68.8% and 74.8%, respectively. Interestingly, both the positive and negative predictive values of HFQRS analysis were significantly higher than ST-segment analysis, although they were still lower than ESE. In multivariate analysis (Table 4), male sex, positive HFQRS analysis, and positive ESE were independently related with a diagnosis of significant CAD.
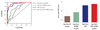
Receiver operational characteristic curve analysis for the diagnosis of significant CAD is presented in Fig. 3 using multivariable Cstatistics. The area under the ROC curve (AUC) for the multivariable model of HFQRS analysis combined with age and sex for the diagnosis of significant CAD were 0.765 {95% confidence interval (CI) of AUC=0.680-0.849}, slightly greater than those of prediction models with age, sex and ST-segment analysis (0.679, 95% CI of AUC=0.592-0.766). Interestingly, adding HFQRS analysis to a predictive model including age, sex and ESE also increased AUC, and MDS increased AUC from 0.919 (95% CI of AUC=0.866-0.972) to 0.948 (95% CI of AUC=0.913-0.984).
Discussion
In the current study, by using an automatic algorithm provided by the commercial software, we could confirm that the data that HFQRS analysis acquires during an exercise test is useful for the diagnosis of significant CAD with better diagnostic properties. This technique could be used when combined with ESE and might also offer additional information to ETT and ESE.
Conventional ETT was widely known to have poor diagnostic accuracy, especially showing lower sensitivity.9) Although it is not expensive and noninvasive, its clinical use is now decreasing in this regards.2) Although sophisticated software capable of automatic computerized analysis of ST-segments has been introduced, clinical reliance on this in the real world has been very limited due to its low diagnostic reliability.10-12) HFQRS analysis, unlike ST-segment analysis, mainly focuses on the abnormality of depolarization.7)8) Its diagnostic feasibility was proven in animal and human studies.4)7)13-16) More recently, its diagnostic value was evaluated in a clinical study with a relatively large number of patients.8) In that study, myocardial perfusion scintigraphy was served as a gold standard test and Sharir et al. showed HFQRS analysis had better sensitivity (69% vs. 39%) and better specificity (86% vs. 82%) compared to conventional ST-segment analysis. In our study, by using anatomic gold standards of CAG and/or CCTA, we could confirmed the results of Tali et al. by finding improved diagnostic properties simply by adding HFQRS analysis to the multivariable models, including ST-segment analysis and ESE results.
In the current study, we evaluated the feasibility of HFQRS analysis used during ESE. For the best apical echocardiographic window, apical lead positions are slightly different from standard ETT, and HFQRS can be affected by noise signals from echocardiographic machines. However, the better diagnostic performance of HFQRS analysis compared with that of ST-segment analysis in our study clearly showed that this technique could be applied at the time of ESE and can provide additional diagnostic information during ESE.
Seventy-one patients were excluded due to poor ECG quality for HFQRS analysis. We assumed that this might be due to noisy signals contaminated during the acquisition of baseline resting echocardiographic images, and tried to exclude these noisy signals by separating the baseline echocardiographic image acquisition from baseline HFQRS measurement processes. After we adopted this exclusion of baseline echocardiogram and HFQRS signal acquisition, cases excluded due to poor ECG quality were substantially reduced.
In our study, the sensitivity of HFQRS analysis was greater than ST-segment analysis, which may suggest a complimentary role for HFQRS analysis to ETT in the diagnosis of significant CAD. Moreover, the independent relationship with significant CAD in multivariable analysis supports its role at the time of ESE. To the best of our knowledge, the feasibility of HFQRS analysis at the time of ESE has been demonstrated for the first time in our study.
There are several limitations in our study. First, a relatively small number of patients were enrolled in our study and only 11% of the entire eligible patients were ultimately evaluated in this study. This is primarily due to the fact that the majority of patients with negative ESE results did not proceed to the next steps, which generally involve more expensive and/or invasive study such as CCTA or CAG. Second, patients with baseline QRS duration >120 msec or left bundle branch block, whose ECG was not suitable for ETT and considered to obtain greater benefits from this kind of new technique, were excluded from this study, as HFQRS analysis is not applicable for this type of patient. A further limitation is that the sensitivity of ST-segment analysis was very low in this study. However, this result probably reflects a real clinical situation and such a low sensitivity of ETT was also reported in previous studies performed with an effort to exclude referral and verification biases.17)18) The diagnostic value of HFQRS analysis in the patients with left circumflex artery stenosis was poor compared to the others. This might be the cases with other stress tests, such as ECG and ESE, and could be partially explained by the variable coronary anatomy of posterior circulation and poor signals from the posterolateral wall.19) Lastly, we did not evaluate patients with a quantitative analysis of CAG, a myocardial perfusion study such as cardiac magnetic resonance perfusion imaging, or coronary functional studies, such as fractional flow reserve, which may have provided a more accurate diagnosis of CAD and have served as improved gold standard tests.
In conclusions, HFQRS analysis was feasible with the ESE test and could provide more useful diagnostic information compared to ST-segment analysis, mainly among patients with left anterior descending and right coronary artery stenosis. As it was independently related with the diagnosis of significant CAD in multivariable models, it can provide additional information at the time of ESE. Multicenter clinical evaluation in larger populations using gold standard testing such as myocardial perfusion or coronary functional studies is required for HFQRS analysis to be considered a reliable and standard diagnostic test for CAD.


 XML Download