

 PDF
PDF ePub
ePub Citation
 Print
Print


Introduction
Both exercise testing and corrected QT (QTc) have been used for detecting heart disease in routine clinical practice. The diagnostic value of QT prolongation at rest in predicting cardiovascular disease and mortality has been well established.1) Normally, both QT and RR intervals shorten with exercise due to parasympathetic withdrawal and sympathetic activation.2)3) In particular, during the period from rest to exercise, the relationship between QT and RR intervals is complex, due to the fact that QT fails to shorten while the heart rate increases. QT-RR dynamics are affected by age, ischemia, exercise, sex, diabetes mellitus (DM), smoking, and antiarrhytmics drugs, as well as genotypic differences concerning the structure and function of repolarization channels.4)5)
Many formulae, such as logarithmic (Ashman), hyperbolic, linear (Framingham, Hodges, Rautaharju PM), log-linear, and non-linear (Bazett, Fridericia) functions, have been proposed to correct for the heart rate effects on QT interval.6-10) Because most of them tend to be imprecise in detecting the exact QT interval at differing heart rates, the linear regression function, which uses rate correction factors, has been recently proposed.10)
Although ST-segment depression is the most commonly used criterion for the detection of coronary artery disease (CAD), its sensitivity and specificity during exercise testing is about 65% and 84%, respectively.11) Thus, to obtain better electrocardiogram (ECG) analysis during exercise, some investigators focused on QT changes and, consequently, an increased QT dispersion of ≥70 ms during the exercise has been proposed as a predictor of CAD.12)13) Although the association of both CAD and increased QTc is a well-known synergistic risk factor of sudden cardiac death,14) no study thus far has investigated the QTc response in terms of simpler heart rate correction formulae to maximal exercise to predict CAD. Thus, we aimed to assess the QTc interval by using the formulae of Bazett, Fridericia, Framingham, and Hodges at maximal exercise to predict the presence and severity of CAD.
Subjects and Methods
Study participants
The study prospectively investigated 234 consecutive subjects (mean age 57.3±9 years; 91 women aged 56.8±9 years, range 36-73 years; 143 men aged 58±9.5 years, range 34-74 years) who required exercise stress testing due to a suspicion of CAD. The first group, the CAD group, was composed of 122 CAD patients with an abnormal exercise test (48 female and 74 male, mean age 55.5±9.1 years). The second group, the control group, was composed of 112 non-CAD subjects with an abnormal exercise test (43 female and 69 male, mean age 54.9±8.6). All subjects had a normal resting 12 lead normal ECG and no history of cardiovascular disease. Throughout the study, the subjects were not allowed to take medication known to affect cardiac repolarisation, such as beta-blockers, calcium antagonist, or other antiarrhytmics. The exclusion criteria for both groups were as follows: atrial fibrillation or flutter, previous myocardial infarction, congestive heart failure, chronic obstructive or other pulmonary diseases, any systemic disease, poor neuromuscular capability, and moderate to severe valvular disease. The study was approved by the local ethics committee. All participants provided informed consent.
Exercise test and QT analysis
The Bruce protocol was used for the treadmill exercise testing. 85% of the age-predicted heart rate was considered the main target heart rate. Exercise was continued until the occurrence of ST depression, angina pectoris, dyspnea, and palpitations or exhaustion. During the study, 12-lead ECGs were digitally recorded continuously at 500 Hz using the CardioSoft exercise ECG system, which has onscreen computer-driven calipers (version 4.14, GE Healthcare, Freiburg, Germany). At least 1 mm or higher horizontal or downsloping ST-segment depression 80 ms after the J point was considered abnormal. All stored ECG results, using the standard 12-lead ECG tracing at 50 mm/s paper speed at 10 mm/mV amplitude, were analyzed offline.
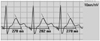
Measurements were taken by two cardiologists. To determine the raw QT interval, the lead DII and V 5 of each ECG was used because its large-amplitude T wave permitted was sufficiently reliable to determine the end of the T wave as described previously.15) We used a mean value of leads DII and V 5 derived from at least 3 cardiac cycles (heartbeats) and measured from the beginning of the earliest onset of the QRS complex to the end of the T wave. When the T and U waves were close together, we identified the end of the T wave as the point at which its descending limb returns to the TP baseline. When the end of the T waves did not cross the isoelectric line, we determined the end of the T wave by the slope method, wherein it is defined by the intersection point between the tangent drawn at the maximum downslope of the T wave and the isoelectric line (Fig. 1). We did not include cases that had a biphasic T wave or those in which we could not determine an isoelectric line between the T and P wave at the maximal exercise ECG due to ECG artefacts.
Angiographic assessment
Selective coronary angiography (Integris, Philips Medical Systems, Eindhoven, the Netherlands) was carried out using the Judkins technique through femoral artery access within a maximum of 90 days from the exercise test. The angiographic characteristics were obtained from multiple views for both the left and right coronary arteries. The coronary artery was considered diseased if stenosis in a major epicardial coronary artery was ≥50% in diameter. The Gensini scoring system was used to calculate the severity of CAD.16) The degree of coronary artery stenosis was evaluated according to the consensus opinion of three experienced interventional cardiologists.
Statistical analysis
All data were analyzed using the Statistical Package for the Social Sciences (SPSS) version 17 (SPSS Inc., Chicago, IL, USA) software package. Data were expressed as mean±standard deviation and median (minimum-maximum) values for normal and abnormal distribution, respectively. Categorical data such as gender, diabetes, hypertension, and smoking were denoted as count and percentages, and were compared using the chi-square test. Following a checking of the variables using the Kolmogorov-Smirnov normality test, the mean differences for continuous variables between the two groups were examined by the unpaired Student t-test and the Mann-Whitney U test. After the categorization of QTc values, a chi-square test was performed to compare categorical variables such as gender, hypertension, smoking, diabetes, and the number of coronary artery involvement. Additionally, a paired t-test and Wilcoxon signed rank nonparametric test for paired data were used to compare the differences between the two study groups' pretest and maximal exercise QTc values. Receiver operating characteristic (ROC) curve analysis was performed to identify the optimal cut-off value of the QTc at maximal exercise for the prediction of CAD. A Pearson correlation analysis was used to investigate whether there was a correlation between various QTc formulae and CAD presence and severity. Univariate and multivariate linear regression analysis was used to predict the variables affecting exercise QTc prolongation. A p of less than 0.05 was accepted as statistically significant.
Reliability
Intraobserver and interobserver variability of QT measurements were assessed by averaging three consecutive QT intervals in lead DII and V 5 from 30 randomly selected ECGs. After the measurer was masked to the previous results, the same ECGs were remeasured in random order. The reliability of intraobserver variability was tested using the paired t-test. For interobserver comparisons, a second investigator was blinded to the results of the first investigator. The reliability of interobserver variability was tested using the Student t-test.
Results
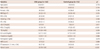
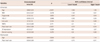
Demographic, clinical characteristics, and exercise electrocardiographic findings of the two groups are shown in Table 1 and 2. There was no difference between the two groups in terms of age, gender, body mass index (BMI), DM, smoking, and hypertension. ST depression of ≥1 mm {n=95 (77.8%) vs. n=38 (33.9%), p<0.001}, Gensini scoring {25 (10-128) vs. 2 (0-4), p<0.001}, triglyceride (TG) {170 (64-440) vs. 124 (58-330), p=0.008} and uric acid {5.2 (1.1-8.3) vs. 4.7 (2.4-9.4), p=0.009} were higher, and high density lipoprotein-cholesterol (HDL-C) {42 (26-70) vs. 47 (25-87), p<0.001} was lower in the CAD group than in the control group. There were no significant differences with respect to fasting glucose, haemoglobin, serum creatinine, low density lipoprotein-cholesterol, or exercise test METs (metabolic equivalents) values (all p>0.05) (Table 1).
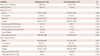
Resting HR, raw QT interval, QTc formulae results during maximal exercise, systolic, and diastolic blood pressure (BP) in the pretest exercise, and peak HR, the mean maximal exercise METs values, achievement time from resting HR to peak HR, systolic, and diastolic BP in maximal exercise were similar in the two groups (all p>0.05). Maximal exercise raw QT interval was longer in the CAD group than in the control group {268 (169-438) ms vs. 240 (168-348) ms, p<0.001}. Among the maximal exercise QTc derivatives findings, only the Hodges formula provided similar results in the two groups, while the Bazett, Fridericia, and Framingham formulae resulted in higher values in the CAD group than in the control group {405 (290-556) ms vs. 391 (291-537) ms, p=0.015}, {350 (235-515) ms and 331 (279-458) ms, p=0.001} and (360±34 ms vs. 340±29 ms, p<0.001), respectively. In the paired t-test and Wilcoxon rank test analysis, comparing pre-test and maximal exercise QTc derivates, Bazett formula QTc results were similar for both the CAD (p=0.109) and the control groups (p=0.523), while the Framingham, Fridericia, and Hodges formulae results were significantly different for the two groups (all p<0.001) (Table 2).
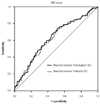
Maximal exercise-Framingham QTc and Fridericia QTc were evaluated by ROC analysis in predicting CAD presence. The closest values of Framingham 350 ms and of Fridericia 340 ms to the best specificity and sensitivity points on the ROC curve were identified {for Framingham QTc: area under the curve (AUC); 0.628±0.035 (0.559-0.696), p<001} (Fig. 2) and {for Fridericia QTc: AUC; 0.620±0.035 (0.551-0.688), p<001}. There was no difference between Framingham the QTc AUC and Fridericia QTc AUC values (p=0.846). The sensitivity, specificity, positive and negative predictive values maximal exercise QTc for predicting CAD presence were determined as follows: for Framingham of ≥350 ms; 62.2%, 64.3%, 65.5%, and 61%, and for Fridericia of ≥340 ms; 54.1%, 56.3%, 57.3%, and 55.9%, respectively.
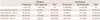
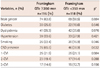
No significant difference was found in terms of ST depression between the two groups. While the number of subjects who had ST depression and peak exercise QT prolongation in the CAD group was higher than that of the control group {for Framingham QTc ≥350 ms: n=54 (44.2%) vs. n=22 (19.6%), p<0.01 and for Fridericia QTc ≥340 ms: n=48 (39.3%) vs. n=29 (25.8%), p<0.01, respectively}, the number of subjects who had no ST depression and peak exercise QT prolongation was similar between the two groups (p>0.05) (Table 3). Gender, diabetes, dyslipidemia, hypertension, smoking, and the number of coronary artery vessel involvement were similar in those with peak exercise prolongation and with no peak exercise prolongation (all p>0.05), but no presence of CAD {n=39 (33.6%) vs. 46 (38.9%), p=0.032} (Table 4). After entered variables of age, BMI, TG, HDL-C, uric acid, METS, peak heart rate, ST depression, and Gensini scoring into univariate and multivariate linear regression analysis, age {unstandardized β=0.86±0.2, p=0.004, confidence interval (CI) 95% from 0.22 to 1.14} and peak heart rate (unstandardized β=-0.58±0.08, p<0.001, CI 95%: from -0.75 to -0.41) were found to be associated with QT prolongation (Table 5).
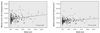
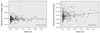
In the correlation analysis, QTc measurements according to the Bazett (r=0.163, p=0.01), Framingham (r=0.239, p=0.001), and Fridericia (r=0.206, p=0.001) equations were weakly positively correlated with Gensini scoring, but the Hodges equation was not (r=0.001, p=0.989) (Figs. 3 and 4).
Reliability
Intra and interobserver reliability comparisons of QT measurements at resting and peak heart rates were similar. For resting QT measurements, the mean differences were 1.1 and 1.3 ms, p=0.417 and p=0.296, respectively. For peak heart rate QT measurements, the mean differences were 1.2 and 1.4 ms, p=0.398 and p=0.241, respectively.
Discussion
We primarily aimed to investigate whether there was QTc prolongation due to ischemia and these formulae were eligible for predicting CAD presence and severity. This study firstly shows that CAD patients have higher peak exercise QTc values. Although the time from resting to peak HR at maximal exercise was similar in the CAD and non-CAD groups, there was longer raw QT in the CAD group in the study. Secondly, these findings showed that exercise-induced ischemia was one of the reasons for QT prolongation as well as ST depression, and there was no additive diagnostic value of QTc at peak heart rate in addition to ST depression observed in the study. The percentage of those without ST depression and with longer QTc was similar between the two groups. In addition, exercise QTc sensitivity and specificity were lower than that of ST depression, as described by previous studies, of 68% and 77%, respectively.17) The sensitivity of ST depression was 77% in the CAD group. We did not calculate the specificity of ST depression in our study, because our control group consisted of non-CAD subjects with ST depression or exercise-induced angina. In other words, their abnormal exercise electrocardiograms were mainly false positives. Finally, we found that age and peak heart rate were found to be related to peak exercise QTc time.
Age, gender, heart rate, underlying rhythm and conduction defects, neuromuscular capability, pulmonary function, physiologic and metabolic state, and or some drugs influence the QT interval. Furthermore, instantaneous ECG at maximal exercise does not estimate the exact QTc interval due to the QT/RR hysteresis. Although numerous methods have been proposed to correct QT intervals for heart rate, Bazett is the most universally adopted method. However, it provides no adequate correction at low, ≤60 beats/min, and high, ≥100 beats/min, heart rates, respectively. The Framingham and Fredericia methods have been proposed for use outside the normal ranges.18) In fact, hysteresis and the time for QT to adapt to RR interval change play an important component of physiology. These methodologies are based on population mean correction factors and do not address intra- or inter-individual variability. Although the Bazett, Framingham, Fridericia, and Hodges formulae have not been proposed to determine intra- or inter-individual variability for measuring QTc, especially at peak heart rates, we aimed to evaluate whether there is a difference at peak exercise between CAD patients and non-CAD subjects.
Not surprisingly, we found that these four equations' results were different for both resting and peak exercise heart rates. In this data set, the Framingham and Fridericia formulae led to significantly decreased QTc values, while the Bazett and Hodges correction formulae led to significantly increased QTc values at fast heart rates. Previous studies have shown that Bazett overcorrects the QTc, while Fridericia undercorrects the QTc at fast heart rates.19)20) Compared to the others at fast heart rates, the distributions of QTc based on Fridericia and Framingham were similar, and showed a significant difference between CAD patients and non-CAD subjects. However, the Hodges QTc revealed no difference. The Bazett QTc at peak heart rates was different between the two groups, but it was not different between the resting and maximal heart rates for the two groups, due to its wider distribution.
The exercise test using ST depression analysis was not more decisive in clinical practice. Making exercise testing more routinely useful related to some QT criteria, such as QT dispersion or T wave analysis, has also been sought in the last decade.16)21) In the present study, we compared four different QTc measurement equations and studied their eligibility for the detection of CAD presence and severity. Considered ST depression, our study suggests that Framingham and Fridericia equations were not as eligible as ST depression for detecting CAD presence during peak heart rate during the exercise test, and both of them were only weakly correlated with CAD severity. We showed, particularly, that rate-independent QT shortens more in normal controls than in CAD patients at peak exercise. Framingham, a linear method, with QTc ≥350 ms at maximal exercise, was not as satisfying as ST depression in daily routine practice in determining the presence of CAD, even though it has moderate sensitivity, 62.2%, and specificity, 64.3%, and no additive diagnostic value in addition to ST depression. We found that the Fridericia formula's sensitivity was mildly inferior to that of the Framingham formula in determining CAD presence.
While parasympathetic effects on the heart rate at maximal exercise in healthy subjects are continuous and protective against arrhythmias,22) catecholamine and sympathetic effects of vigorous physical exertion in patients with CAD may trigger myocardial infarction or sudden cardiac death.23) Both graded and sudden intense exercise more commonly trigger cardiac events due to exercise-induced ischemia, resulting in ventricular repolarization heterogeneity, which may be proarrhythmic, by altering the QT rate adaptation.21)24)25) There are many different mechanisms for QTc prolongation in myocardial ischemia, such as tranmural dispersion or repolarization heterogeneity, as well as autonomic neural effects. Normally, exercise-induced ischemia may alter the behaviour of the QT/RR relationship in patients with CAD by decreasing the duration of action potential.26) We considered that the first reason that CAD patients have longer QTc than non-CAD subjects in our study may potentially be related to the longer hysteresis duration for CAD patients.27) Indeed, the substantial intersubject variability of the QT/RR relationship has been recently well documented, and the basic QT/RR relationship has been explained by hysteresis, with QT adaptation to instantaneous heart rate changes taking roughly two minutes.28) The precise mechanism of QT hysteresis is not known, however, yet what is understood is that autonomic and non-autonomic factors are responsible.29)30) The second reason may be based on the fact that graded exercise potentially leads to the impairment of cardiac physiological reflexes due to ischemia with greater sympathetic overdrive and acidosis.
Measurement QT intervals at fast heart rates is the first limitation of our study. To minimize misleading results, we particularly excluded cases that appeared to be unreliable for measuring QT interval. We did not use any correction factor for the determinate instantaneous QT/RR relationship for either group, because our study was not designed to characterize the best formula for measuring QTc. This may be seen as a mitigating factor, but we particularly aimed to compare these simpler correction formulae. Second, we assessed QT interval only in lead DII and V 5. QT intervals, in fact, can be measured differently in different leads. Third, QT intervals at peak exercise are influenced both by its antecedent RR interval and by the preceding two-minute RR intervals.
In conclusion, the measurement of maximal exercise-QT Framingham QTc of ≥350 ms and Fridericia QTc of ≥340 ms can be incorporated into clinical decision-making, but QTc prolongation at peak heart rates provides no additive diagnostic information in addition to ST depression. Furthermore, these simpler heart rate corrections of the QT interval at maximal exercise are not practical for routine clinical use. Further maximal exercise QTc studies which utilize rate correction factors or are estimated for each individual QT/RR variability may be more beneficial in determining the additive diagnostic value of QTc at maximal exercise for the detection of CAD presence and severity.
 XML Download