

 PDF
PDF ePub
ePub Citation
 Print
Print


Introduction
Atrial fibrillation (AF) is characterized by irregular RR intervals which make beat to beat changes in left ventricular (LV) systolic performance resulting from changes in preload, contractility, and afterload.1)2) Recently, the role of diastolic function in the pathogenesis of heart failure is being emphasized.3)4) LV diastolic function is often determined by echocardiographic parameters.5-7) However, all parameters have limitations and there is no golden standard to evaluate diastolic function non-invasively. One of the most promising parameters is early diastolic mitral annular velocity (E'). E' is relatively less dependent on preload than other parameters.7)8) E' is lower in systolic dysfunction than in normal systolic function. Even in normal systolic function, E' becomes lower with the development of diastolic dysfunction.8) There are few reports observing the association between parameters representing systolic and diastolic functions of the left ventricle.8-10) We investigated the influences of continuous change in RR interval on diastolic function in AF by observing the relationship between RR interval and E'.
Subjects and Methods
One hundred and forty-three patients with AF were screened and 117 patients were enrolled in our study. Exclusion criteria included 1) hemodynamically significant mitral stenosis (mitral valvular area <2 cm2, n=8) or aortic stenosis (aortic valvular area <1.6 cm2, n=2), 2) pericardial diseases (n=2), 3) cardiac myxoma (n=1), 4) hyperthyroidism (n=2), 5) poor tissue Doppler image (n=2) and 6) other acute medical conditions including acute stroke, acute thromboembolism, pneumonia, and sepsis (n=9).
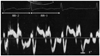
Two-dimensional and Doppler echocardiograms (Philips Sonos 7500, 2- to 2.5-MHz transducer, Phillips Healthcare, Bothell, WA, USA) were obtained in the left lateral position. Dimensions were measured according to the American Society of Echocardiography standards.11) Fractional shortening was measured using an M-mode echocardiogram at the beat with the longest preceding RR interval (RR-1). Thirty to 40 consecutive E's were recorded using tissue Doppler imaging from the apical 4-chamber view with a sample volume in the septal border of the mitral annulus. Electrocardiogram was recorded simultaneously, and E' and RR interval were measured (Fig. 1).
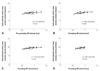
The relationship between RR interval and E' was obtained using a method reported previously with some modification.12)13) The logarithmic equation for the relation between pre-preceding RR interval (RR-2) and E' was obtained. Using this equation, E' was adjusted for the effect of RR-2 assuming that RR-2 was fixed to the mean RR interval (Fig. 2). By this modification, the mean squared correlation coefficient (r2) of the relation between RR-1 and E' improved slightly, however, significantly from 0.109±0.115 to 0.121±0.120 (p=0.006). The slope was obtained rom the logarithmic equation between RR-1 and adjusted E'. Patients with very rapid or slow ventricular rates (most RR intervals <0.6 or >1.0 second, n=21) were excluded and the logarithmic equation between RR-1 and adjusted E' was recalculated in co-ordination with RR-1 ranging from 0.6 to 1 second (n=96).
Data were presented as mean±SD. Statistical analysis was performed using Statistical Package for the Social Sciences (SPSS) (Version 9.0, SPSS, Inc., Chicago, IL, USA). The Pearson correlation analysis was used to evaluate the relationship between the parameters, and multiple stepwise linear regression analysis was used to find independent variables. The simple or forward logistic regression method was used to compare the parameters between the 2 groups. Statistical significance was inferred at a p<0.05.
Results
Baseline characteristics of study patients
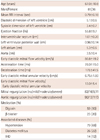
Demographic, clinical, and laboratory characteristics of 117 patients are presented in Table 1. The mean age was 67.0±10.8 years and 81 (69%) were males. Fifty-nine patients (50%) and 23 patients (20%) were taking digoxin and β-blocker, respectively.
Parameters associated with slope from the relationship between RR-1 and E'
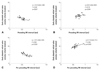
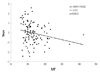
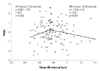
The slope in the relationship between RR-1 and E' varied from -2.5 to 2.6 in total coordinates (Fig. 3). The slope was lower (negative) in patients with higher ratio of early diastolic mitral flow velocity (E) to E' ratio (r=-0.21, p=0.023) (Fig. 4), ischemic heart disease (IHD; r=0.21, p=0.026), smaller diastolic LV dimension (r=0.19, p=0.039), and higher systolic blood pressure (r=-0.19, p=0.046) in the Pearson correlation analysis (Table 2). Among these parameters, higher E/E', the presence of IHD, and higher systolic blood pressure were independent according to the multiple stepwise linear regression analysis (r=0.34, p=0.004).
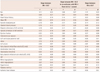
When patients were divided into the 3 groups according to the slope in the relationship between RR-1 and E', the lowest slope group (<-0.55, n=39) was associated with higher E/E' (p=0.004), IHD (p=0.018), lower E' (p=0.023), and smaller diastolic LV dimension (p=0.047) compared with the highest slope group (>0.57, n=39) (Table 3). Among these parameters, higher E/E' and the presence of IHD were independent according to the forward logistic regression analysis. In the relationship between RR-1 and E' in co-ordinates with RR-1 ranging from 0.6 to 1 second (n=96), lower slope (negative) was associated with a history of hypertension (r=0.25, p=0.014) and IHD (r=0.21, p=0.041). In this case, only history of hypertension was independent with regards to the multiple stepwise linear regression analysis.
Parameters associated with slope from the relationship between RR-2 and E'
The slope in the relationship between RR-2 and E' also varied from -3.4 to 3.1 (Fig. 3). The slope was associated with many variables with respect to the Pearson correlation analysis (Table 2). Among these, lower slope (negative) was independently related to larger systolic LV dimension (r=-0.38, p=0.000) and lower E' (r=0.30, p=0.001) in the multiple stepwise linear regression analysis (r=0.49, p=0.000).
Relationship between E' and RR-1 or RR-2
In the relationship between E' and RR-2, r2 was quite variable (from 0 to 0.65) patient-to-patient and very weak (0.11±0.14). Additionally, r2 was negatively associated with ejection fraction (r=-0.31, p=0.0008) and positively with systolic LV dimension (r=0.26, p=0.005). Among these, ejection fraction was an independent variable in the multiple stepwise linear regression analysis. In the relationship between E' and RR-1, r2 was also quite variable (from 0 to 0.58), very weak (0.12±0.12), and was not associated with any variables.
Discussion
This study demonstrated that beat-to-beat changes in RR intervals in AF had variable effects on E' according to several clinical variables and that the slope in the relationship between RR-1 and E' tended to be negative in patients with high diastolic filling pressure, IHD, and/or other several parameters. Thus, the longer the RR interval is, the lower E' becomes in these patients.
To our knowledge, there have been no reports that investigated the relationship between RR intervals and E's in AF. It was difficult to assume the relation between RR intervals and E's due to the relatively wide variation of E' by respiration and sample volume (Fig. 3). We evaluated several simple mathematical equations, and found that compared with the linear equation, the logarithmic equation showed minimally higher r2 although it was not statistically significant (0.121±0.120 vs. 0.119±0.116, p=0.26).
There are several echocardiographic parameters representing LV diastolic function well in sinus rhythm.5-7) However, it is difficult to evaluate diastolic function in AF due to beat-to-beat changes of parameters and loss of atrial contraction.14) We chose E' as a marker of diastolic function because it was relatively easier to obtain measurements of many beats. E' is one of the most promising echocardiographic parameters for diastolic function. It is relatively preloadindependent7) 8) and is also useful in AF.14)15)
In AF, irregular RR intervals make beat to beat changes in LV systolic performance. With a longer RR interval, preload and contractility increase, and afterload decreases resulting in higher cardiac performance.1)2) Preload has minimal or no effects on E' in the presence of heart disease.10)16)17) However, a small but significant increase of E' was noted with large volume loading in normal diastolic function.10)17)18) The effect of systolic function on E' is controversial. Augmented contractility with dopamine markedly increased E'.10) However, E' was not related to ejection fraction.8)
Based on previous reports, it is expected that a longer RR interval increases or does not change E' compared with a shorter RR interval in AF. Yet in the present study, RR interval showed variable effects on E' and the slope in the relation between RR-1 and E' was negative in a portion of patients with several clinical characteristics. Thus the relation between E' and preload or contractility may be more complicated than previously understood. Heart rate and blood pressure were not associated with E'.8)19)
Rate control is often the therapy of choice for AF. The guidelines have recommended a resting heart rate <80/minute without solid evidence.20) Recently, it has been reported that lenient rate control is as effective as strict rate control for the prevention of cardiovascular events.21) In clinical settings, dyspnea or dyspnea on exertion is usually improved with rate control therapy. However, several patients complain of ambiguous discomfort with the therapy. The present study showed that rate control decreased E' in patients with higher E/E', IHD, and several clinical characteristics. This finding suggests that tight rate control may deteriorate LV diastolic function in these patients and may partially explain the discrepancies between the guidelines and recent clinical studies, as well as patient-to-patient differences observed in the effectiveness of the therapy. Considering that E' cannot represent diastolic function in all situations, further studies are needed to confirm this hypothesis.
The slope in the relationship between RR-2 and E' also varied from -3.4 to 3.1. The slope tended to be negative in patients with larger LV systolic dimension (r=-0.38, p=0.000) and lower E' (r=0.30, p=0.001). This finding suggests that a longer RR-2 makes E' lower and is not beneficial in patients with systolic and/or diastolic dysfunction. Considering together with the relation between RR-1 and E', too low heart rate may be potentially harmful in patients with LV dysfunction and fluid overload state.
In the present study, several parameters were associated with the slope in reference to the relationship between RR interval and E' with statistical significance. However, the associations were rather weak and these parameters explained only 11.5% of the variation of the slope in the multiple stepwise linear regression analysis. In addition, associated variables were different according to the varying situations. For example, history of hypertension was not associated with the slope in the relationship between RR-1 and E' in all co-ordinates (r=-0.09, p=0.32), but was the most important determinant for the slope in the relationship between RR-1 and E' in coordinates with RR-1 ranging from 0.6 to 1 second (r=-0.25, p=0.014). Therefore, individualization is necessary for the clinical application of this phenomenon.
In a study observing the relationship between RR intervals and LV systolic performances in AF, RR-1 and RR-2 explained 52% and 29% of the variation of LV outflow peak ejection velocity, respectively.22) In the present study, the relationship between E' and RR-1 or RR-2 was quite variable from patient-to-patient and also very weak. RR-1 and RR-2 explained only 12% and 11% of the variation of E', respectively. This finding suggests that E' is mainly determined by intrinsic properties of the left ventricle and partially by LV systolic performances. The relationship between E' and RR-2 was stronger in patients with systolic dysfunction than in those with normal systolic function.
Several parameters seemed to be related to the slope in the RR-1 and E' relationship, but were not statistically significant. For example, the mean RR interval was negatively associated with the slope in the pilot study and not in the present study.13) As shown in Fig. 5, the mean RR interval was positively associated with the slope in the relationship between RR-1 and E' in patients with a mean RR interval <0.8 second (r=0.21, p=0.082) and negatively in patients with a mean RR interval >0.75 second (r=-0.21, p=0.097), although it did not reach statistical significance. This finding suggests that the response of LV diastolic function to some variables may be biphasic. Therefore, the relation between RR-1 and E' is rather complicated and further studies are needed in a large number of patients with controlled clinical characteristics. In addition, left atrium size was associated with the slope in the previous study.13) The authors have not been able to elucidate the reasons for the discrepancy and further studies are required in a large number of patients.
There are several limitations in this study. This study was performed at a single hospital in Asia, lending to small population size. We assume that E' represents LV diastolic function well. Although E' is one of the most promising parameters for LV diastolic function, it is unclear whether E' is also valuable in the condition of AF with beat-to-beat changes in LV systolic performance. The candidates of this study are heterogeneous with respect to the causes. We could not perform a subgroup analysis due to the limited number of patients.

 XML Download