Abstract
Purpose
To objectively define the degree of cupping, the authors extracted 3-dimensional slope surface maps from Cirrus HDTM-OCT data and assessed their differentiating characteristics between normal subjects and glaucomatous patients. Methods: One eye from each of 40 normal subjects and 1 eye from each of 39 patients with glaucoma were examined using automated visual field perimetry and Cirrus HDTM-OCT. The Optic Disc Cube 200 × 200 protocol was performed. The individual OCT data were reconstructed as the 3-dimensional surface maps of the optic disc cup and the slope of each contour was calculated using custom-developed software. Several disc cup slope parameters were derived. The parameters measuring the internal features of the optic disc cup were calculated and compared between groups.
Results
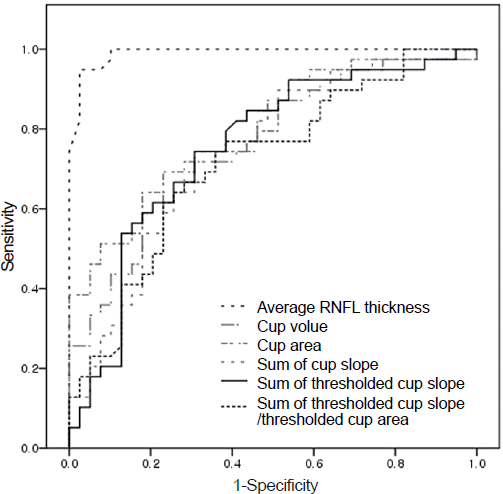
Sum of cup slope, sum of thresholded cup slope, and sum of thresholded cup slope / thresholded cup area parameters were differentiating factors between the normal and glaucoma groups (p < 0.05). The area under the receiver operating characteristic curve (AUROC) value of the slope parameters ranged from 0.718 to 0.753. The sum of thresholded cup slope / thresholded cup area parameter was well correlated with visual field mean deviation (r = -0.250, p = 0.028). Conclusions: The optic disc cup slope parameter obtained with OCT may be a useful parameter for representing glaucomatous cupping.
References
1. RR Allingham, KF Damji, S Freedman. Shields' textbook of glaucoma. 5th ed.Lippincott Willliams & Wilkins;2005. chap. 5.
3. Quigley HA, Addicks EM, Green WR, Maumenee AE. Optic nerve damage in human glaucoma. II. The site of injury and susceptibility to damage. Arch Ophthalmol. 1981; 99:635–49.

4. Quigley HA, Green WR. The histology of human glaucoma cupping and optic nerve damage: clinicopathologic correlation in 21 eyes. Ophthalmology. 1979; 86:1803–30.

5. Miglior S, Casula M, Guareschi M, et al. Clinical ability of Heidelberg retinal tomograph examination to detect glaucomatous visual field changes. Ophthalmology. 2001; 108:1621–7.
6. Schuman JS, Wollstein G, Farra T, et al. Comparison of optic nerve head measurements obtained by optical coherence tomography and confocal scanning laser ophthalmoscopy. Am J Ophthalmol. 2003; 135:504–12.

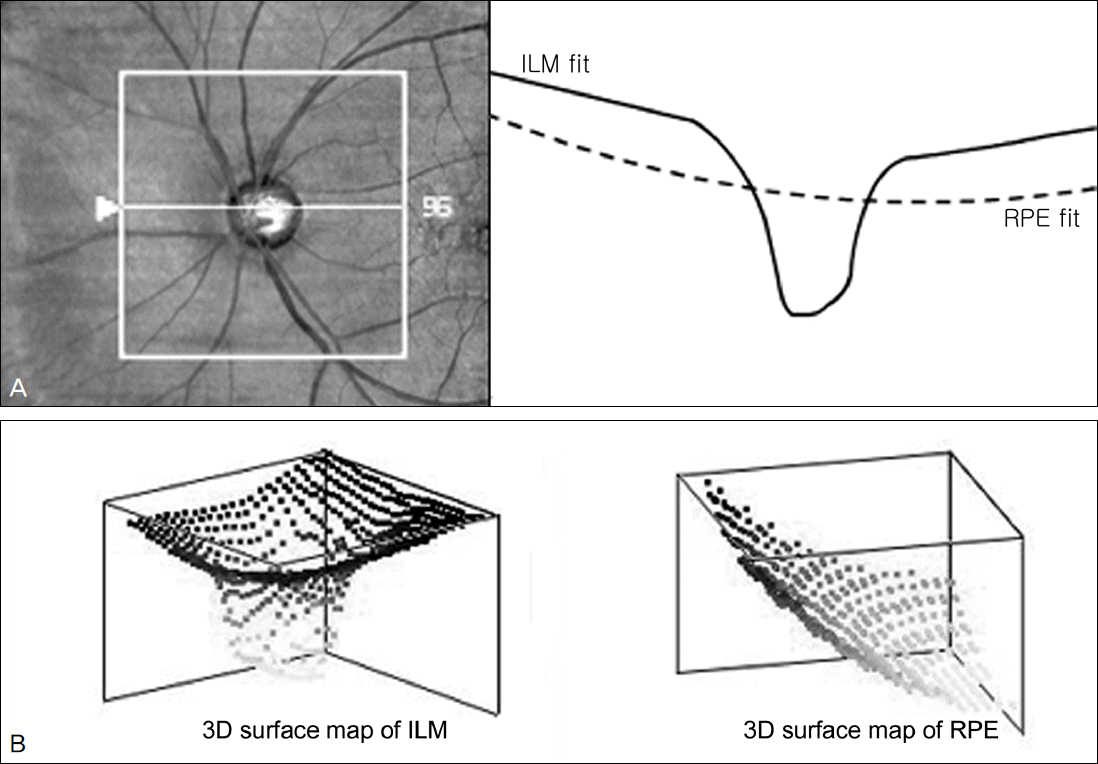
Figure 1.
3D reconstruction of the optic disc cup. (A) Representative horizontal Cirrus HDTM -OCT image of the optic disc cup. (B) 3D surface map image reconstructed by custom develped software.

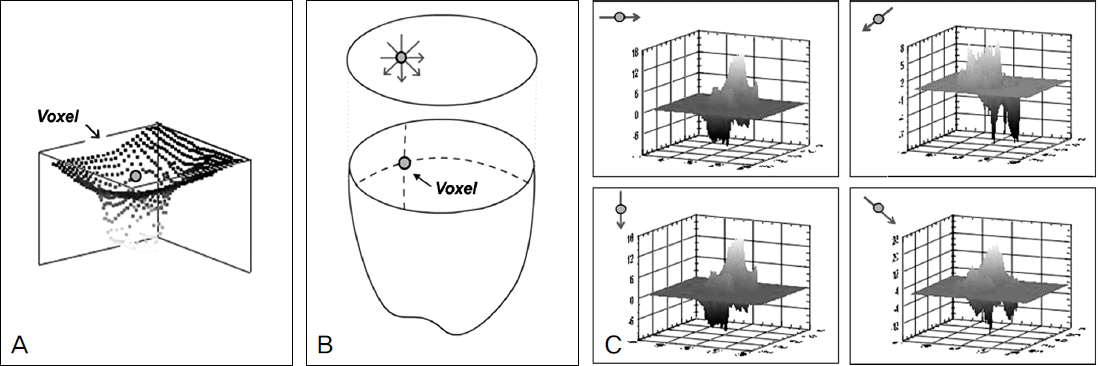
Figure 2.
Calculation of slope for one voxel. (A) 3D surface map of disc cup. (B) Schematic drawing of disc cup. (C) 4 Slope of one voxel obtained by disc cup analysis program: horizontal, vertical and 2 diagonal.

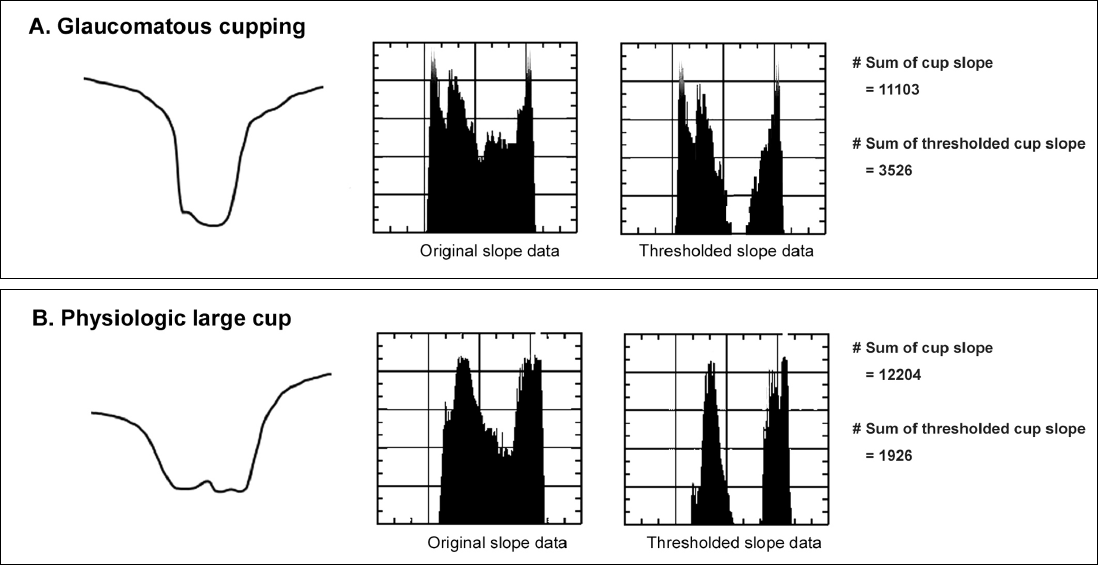
Figure 3.
Comparison between glaucomatous cupping and physiologic large cup. (A) Representative glaucomatous cupping. (B) Representative physiologic large cup. Left graph is the horizontal Cirrus HDTM -OCT image of the optic disc cup. M iddle and right graph is the print out of the results obtained by the disc cup analysis program. M iddle graph shows original slope data and right shows graph after removal of under the threshold slope data. The sum of cup slope parameter of physiologic the large cup was more larger than the glaucomatous cupping (12204 vs 11103) but the sum of thresholded cup slope parameter of physiologic large cup was smaller than the physiologic large cup (1926 vs 3526).

Figure 4.
Reciever operating characteristic curves for the best seperating parameters between normal and glaucoma groups.

Table 1.
Dermographic data of study participants
| Normal (n = 40) | Glaucoma (n = 39) | p | |
|---|---|---|---|
| Age (year) | 49.7 ± 9.6 | 52.3 ± 11.9 | 0.325 |
| Sex (%, male) | 68 | 59 | 0.456 |
| SE (D) | -2.07 ± 2.51 | -1.69 ± 1.94 | 0.483 |
| IOP (mm Hg) | 15.4 ± 3.2 | 19.7 ± 5.1 | <0.001* |
| MD | 0.01 ± 1.24 | -1.80 ± 1.36 | <0.001* |
| PSD | 1.85 ± 0.53 | 3.21 ± 1.70 | <0.001* |
| C/D ratio | 0.33 ± 0.05 | 0.66 ± 0.17 | <0.001* |
| Average RNFL thickness (μm) | 98.7 ± 6.9 | 75.4 ± 7.5 | <0.001* |
Table 2.
Disc cup parameters, as determined by Cirrus HDTM-OCT
| Normal (n = 40) | Glaucoma (n = 39) | p | |
|---|---|---|---|
| Cup volume | 19487 ± 15996 | 47403 ± 30345 | <0.001* |
| Cup area | 937.8 ± 440.5 | 1794.1 ± 729.4 | <0.001* |
| Thresholded cup area | 231.8 ± 174.5 | 348.4 ± 182.3 | 0.005* |
| Sum of cup slope | 7463.9 ± 4696.6 | 13207.3 ± 6012.4 | <0.001* |
| Sum of cup slope / cup area | 7.62 ± 2.28 | 7.41 ± 1.65 | 0.691* |
| Sum of thresholded cup slope | 1872.1 ± 2108.3 | 3761.6 ± 2493.1 | 0.002* |
| Sum of thresholded cup slope / thresholded cup area | 7.96 ± 2.79 | 10.19 ± 2.86 | <0.001* |
Table 3.
Area under the ROC curve, sensitivity, specificity and cut-off value by each parameters
| AUROC | Sensitivity | Specificity | Cut-off value | p | |
|---|---|---|---|---|---|
| Average RNFL thickness | 0.991 | 97% | 98% | 89.5 | <0.001* |
| Cup volume | 0.761 | 72% | 70% | 27640 | <0.001* |
| Cup area | 0.794 | 71% | 72% | 1369.5 | <0.001* |
| Thresholded cup area | 0.703 | 67% | 62% | 231.0 | 0.002* |
| Sum of cup slope | 0.740 | 72% | 70% | 9779 | <0.001* |
| Sum of cup slope / cup area | 0.503 | 48% | 44% | 7.04 | 0.964* |
| Sum of thresholded cup slope | 0.753 | 74% | 70% | 2002 | <0.001* |
| Sum of thresholded cup slope / thresholded cup area | 0.718 | 69% | 67% | 8.83 | 0.001* |
Table 4.
Correlation between Hemphrey visual field indices and disc cup parameters
| MD | ||
|---|---|---|
| Correlation coefficient | p | |
| Cup volume | -0.229 | 0.055 |
| Cup area | -0.192 | 0.095 |
| Thresholded cup area | -0.168 | 0.144 |
| Sum of cup slope | -0.188 | 0.101 |
| Sum of cup slope / cup area | -0.024 | 0.835 |
| Sum of thresholded cup slope | -0.223 | 0.051 |
| Sum of thresholded cup slope / thresholded cup area | -0.250 | 0.028* |


 PDF
PDF ePub
ePub Citation
 Print
Print


 XML Download