

 PDF
PDF ePub
ePub Citation
 Print
Print


Abstract
Purpose
To evaluate the association between corneal biomechanical properties and progression of visual field loss in normal tension glaucoma.
Methods
This study enrolled 73 eyes of 73 patients with normal tension glaucoma who were undergoing medical treatment, and classified them into progressing and nonprogressing groups by visual field trend analysis. The corneal bio- mechanical properties measured by the Ocular Response Analyzer (ORA; Reichert Instruments, Depew, NY, USA), central corneal thickness, and Goldmann applanation tonometry were comparatively analyzed between the 2 groups.
Results
Twenty-six eyes reached a progression endpoint. The prevalence of hypertension was higher in the progressing group (42.3%, progressing, 17.0%, nonprogressing; p = 0.03). Progressing eyes had lower corneal hysteresis (9.1 ± 1.3 vs. 9.8 ± 1.5 mm Hg, p = 0.03) and lower corneal resistance factor (9.5 ± 1.5 vs. 10.4 ± 1.4 mm Hg, p = 0.01) compared with nonprogressing eyes. Upon multivariate analysis, the presence of hypertension (odds ratio [OR] = 3.46, p = 0.03) and corneal hysteresis (CH) (OR = 0.66 per mm Hg lower, p = 0.02) remained statistically significant.
References
1. Kim CS, Seong GJ, Lee NH, Song KC. Namil Study Group Korean Glaucoma Society. Prevalence of primary open-angle Glaucoma in central South Korea: the Namil study. Ophthalmology. 2011; 118:1024–30.
2. Araie M, Sekine M, Suzuki Y, Koseki N. Factors contributing to the progression of visual field damage in eyes with normal-tension glaucoma. Ophthalmology. 1994; 101:1440–4.

3. Drance S, Anderson DR, Schulzer M. Collaborative Normal- Tension Glaucoma Study Group. Risk factors for progression of visual field abnormalities in normal-tension glaucoma. Am J Ophthalmol. 2001; 131:699–708.
4. Daugeliene L, Yamamoto T, Kitazawa Y. Risk factors for visual field damage progression in normal-tension glaucoma eyes. Graefes Arch Clin Exp Ophthalmol. 1999; 237:105–8.
5. Alward WL, Frederick F, Cashwell LF, et al. Collaborative Normal-Tension Glaucoma Study Group. Comparison of glaucom- atous progression between untreated patients with normal-tension glaucoma and patients with therapeutically reduced intraocular pressures. Am J Ophthalmol. 1998; 126:487–97.
6. Nakagami T, Yamazaki Y, Hayamizu F. Prognostic factors for pro- gression of visual field damage in patients with normal-tension glaucoma. Jpn J Ophthalmol. 2006; 50:38–43.
7. Kim NJ, Lee SM, Park KH, Kim DM. Factors associated with pro- gression of visual field defect in normal tension glaucoma. J Korean Ophthalmol Soc. 2003; 44:1351–5.
8. Han ES, Kim MJ, Park KH. The relationship between intraocular pressure and visual field defect progression in normal-tension glaucoma. J Korean Ophthalmol Soc. 2009; 50:1548–54.
9. Yim JH, Park SC, Kee CW. Evaluation of ocular risk factors related to asymmetric visual field defects in normal tension glaucoma. J Korean Ophthalmol Soc. 2008; 49:1507–14.
10. Kim SH, Park KH. Comparison of clinical characteristics and pro- gression of glaucoma between recurrent and non-recurrent optic disc hemorrhage. J Korean Ophthalmol Soc. 2003; 44:2571–6.
11. Leske MC, Heijl A, Hyman L, et al. EMGT Group. Predictors of long-term progression in the early manifest glaucoma trial. Ophthalmology. 2007; 114:1965–72.
12. Miglior S, Zeyen T, Pfeiffer N, et al. European Glaucoma Prevention Study (EGPS) Group. Results of the European Glaucoma Prevention Study. Ophthalmology. 2005; 112:366–75.
13. Kass MA, Heuer DK, Higginbotham EJ, et al. Ocular Hypertension Treatment Study Group. The Ocular Hypertension Treatment Study: a randomized trial determines that topical ocular hypo- tensive medication delays or prevents the onset of primary open-angle glaucoma. Arch Ophthalmol. 2002; 120:701–13.
14. AGIS Investigators. The Advanced Glaucoma Intervention Study (AGIS): 7. The relationship between control of intraocular pres- sure and visual field deterioration. Am J Ophthalmol. 2000; 130:429–40.
15. Medeiros FA, Alencar LM, Zangwill LM, et al. The relationship between intraocular pressure and progressive retinal nerve fiber layer loss in glaucoma. Ophthalmology. 2009; 116:1125–33e3.
16. Gordon MO, Beiser JA, Brandt JD, et al. Ocular Hypertension Treatment Study Group. The Ocular Hypertension Treatment Study: baseline factors that predict the onset of primary open-angle glaucoma. Arch Ophthalmol. 2002; 120:714–20.
17. Brandt JD, Gordon MO, Gao F, et al. Ocular Hypertension Treatment Study Group. Adjusting intraocular pressure for central corneal thickness does not improve prediction models for primary open- angle glaucoma. Ophthalmology. 2012; 119:437–42.
18. Medeiros FA, Weinreb RN, et al. Is corneal thickness an independent risk factor for glaucoma? Ophthalmology. 2012; 119:435–6.
19. Jonas JB, Holbach L. Central corneal thickness and thickness of the lamina cribrosa in human eyes. Invest Ophthalmol Vis Sci. 2005; 46:1275–9.
20. Congdon NG, Broman AT, Bandeen-Roche K, et al. Central cor- neal thickness and corneal hysteresis associated with glaucoma damage. Am J Ophthalmol. 2006; 141:868–75.
21. Bochmann F, Ang GS, Azuara-Blanco A. Lower corneal hysteresis in glaucoma patients with acquired pit of the optic nerve (APON). Graefes Arch Clin Exp Ophthalmol. 2008; 246:735–8.
22. Sullivan-Mee M, Billingsley SC, Patel AD, et al. Ocular Response Analyzer in subjects with and without glaucoma. Optom Vis Sci. 2008; 85:463–70.
23. Wells AP, Garway-Heath DF, Poostchi A, et al. Corneal hysteresis but not corneal thickness correlates with optic nerve surface com- pliance in glaucoma patients. Invest Ophthalmol Vis Sci. 2008; 49:3262–8.
24. Shah S, Laiquzzaman M, Mantry S, Cunliffe I. Ocular response an- alyser to assess hysteresis and corneal resistance factor in low tension, open angle glaucoma and ocular hypertension. Clin Experiment Ophthalmol. 2008; 36:508–13.
25. Ang GS, Bochmann F, Townend J, Azuara-Blanco A. Corneal bio- mechanical properties in primary open angle glaucoma and normal tension glaucoma. J Glaucoma. 2008; 17:259–62.
26. De Moraes CG, Hill V, Liebmann JM, Ritch R. Lower corneal hys- teresis is associated with more rapid glaucomatous visual field progression. J Glaucoma. 2012; 21:209–13.
27. Medeiros FA, Meira-Freitas D, Lisboa R, et al. Corneal hysteresis as a risk factor for glaucoma progression: a prospective longi- tudinal study. Ophthalmology. 2013; 120:1533–40.
28. Hodapp E, Parrish RK, Anderson DR. Clinical decisions in glauco- ma. 1st ed.St. Louis: Mosby;1993. p. 52–61.
29. Sakata R, Aihara M, Murata H, et al. Contributing factors for pro- gression of visual field loss in normal-tension glaucoma with med- ical treatment. J Glaucoma. 2013; 22:250–4.
30. Luce DA. Determining in vivo biomechanical properties of the cornea with an ocular response analyzer. J Cataract Refract Surg. 2005; 31:156–62.
31. Shah S, Laiquzzaman M, Mantry S, Cunliffe I. Ocular response an- alyser to assess hysteresis and corneal resistance factor in low tension, open angle glaucoma and ocular hypertension. Clin Experiment Ophthalmol. 2008; 36:508–13.
32. Edmund C. Corneal elasticity and ocular rigidity in normal and keratoconic eyes. Acta Ophthalmol. 1988; 66:134–40.
33. McBrien NA, Gentle A. Role of the sclera in the development and pathological complications of myopia. Prog Retin Eye Res. 2003; 22:307–38.
34. Sigal IA, Yang H, Roberts MD, et al. IOP-induced lamina cribrosa displacement and scleral canal expansion: an analysis of factor in- teractions using parameterized eye-specific models. Invest Ophthalmol Vis Sci. 2011; 52:1896–907.
35. Girard MJ, Suh JK, Bottlang M, et al. Biomechanical changes in the sclera of monkey eyes exposed to chronic IOP elevations. Invest Ophthalmol Vis Sci. 2011; 52:5656–69.
36. Hager A, Loge K, Schroeder B, et al. Effect of central corneal thickness and corneal hysteresis on tonometry as measured by dy- namic contour tonometry, ocular response analyzer, and Goldmann tonometry in glaucomatous eyes. J Glaucoma. 2008; 17:361–5.
37. Ernest PJ, Schouten JS, Beckers HJ, et al. An evidence-based re- view of prognostic factors for glaucomatous visual field progression. Opthalmology. 2013; 120:512–9.
38. Ishida K, Yamamoto T, Sugiyama K, Kitazawa Y. Disk hemorrhage is a significantly negative prognostic factor in normal-tension glaucoma. Am J Ophthalmol. 2000; 129:707–14.
39. Ishida K, Yamamoto T, Kitazawa Y. Clinical factors associated with progression of normal-tension glaucoma. J Glaucoma. 1998; 7:372–7.
40. Sawada A, Kitazawa Y, Yamamoto T, et al. Prevention of visual field defect progression with brovincamine in eyes with nor- mal-tension glaucoma. Ophthalmology. 1996; 103:283–8.
Figure 1.
Scatterplot matrix illustrating the relationship among corneal hystereris (CH), central corneal thickness (CCT). r = correlation coefficient (statistically significant).
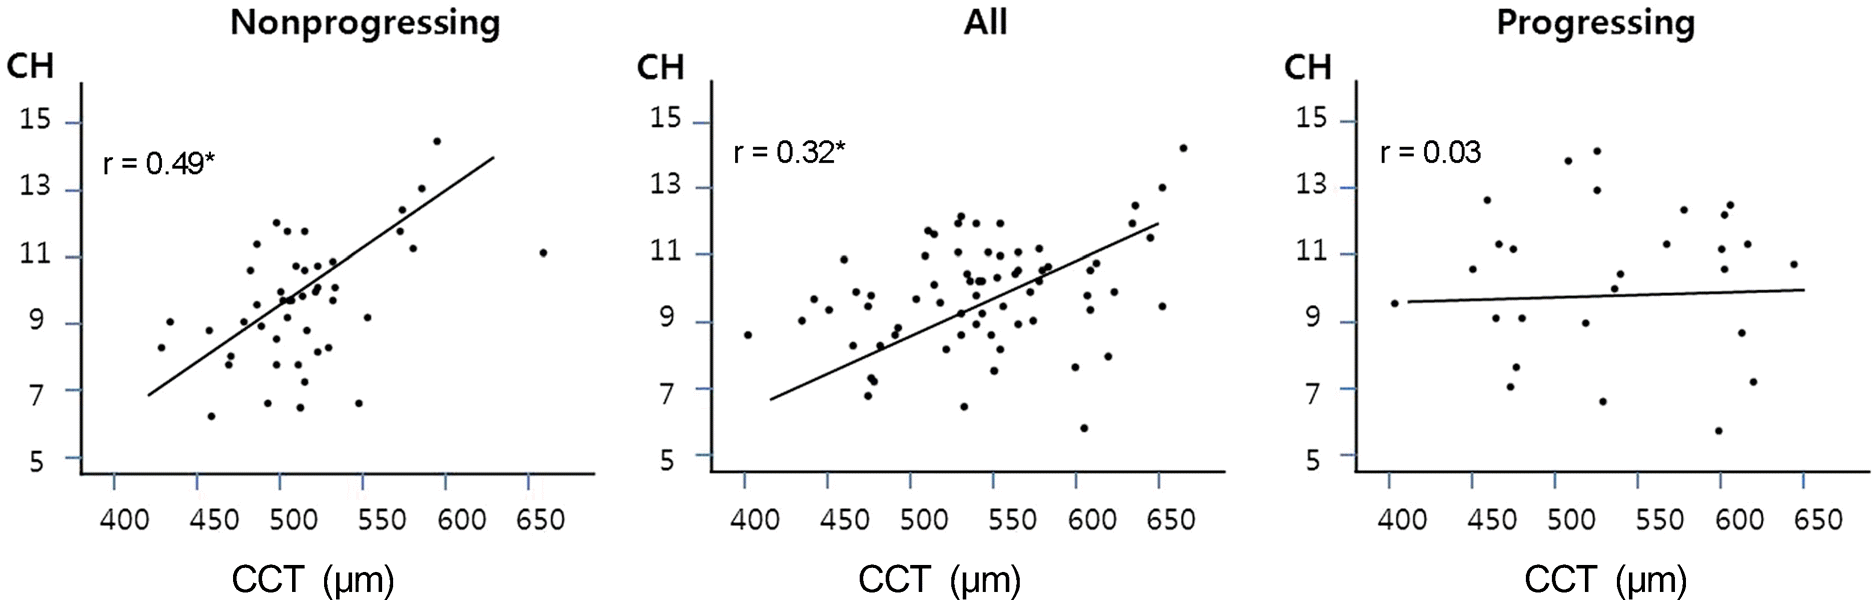
Table 1.
Clinical and ocular characteristics of the progressing and nonprogressing groups
| Progressing* (n = 26) | Nonprogressing* (n = 47) | p-value† | |
|---|---|---|---|
| Age (years) | 58.0 ± 18.9 | 55.8 ± 13.1 | 0.56 |
| Sex, female (%) | 14 (53.8) | 18 (38.3) | 0.23‡ |
| Diabetes (%) | 2 (7.7) | 9 (19.1) | 0.31‡ |
| Hypertension (%) | 11 (42.3) | 8 (17.0) | 0.03‡ |
| Spherical equivalent (diopter) | −1.31 ± 3.11 | −1.26 ± 2.42 | 0.94 |
| Baseline MD (dB) | −3.61 ± 3.09 | −3.93 ± 3.35 | 0.69 |
| Baseline PSD (dB) | 4.48 ± 3.09 | 4.62 ± 3.25 | 0.86 |
| Baseline IOP (mm Hg) | 16.7 ± 3.8 | 15.8 ± 2.7 | 0.27 |
| Mean follow-up IOP (mm Hg) | 11.6 ± 2.5 | 12.6 ± 2.7 | 0.13 |
| IOP reduction (%) | 28.9 ± 12.4 | 20.0 ± 14.1 | <0.01 |
| CCT (μm) | 528.7 ± 37.6 | 537.3 ± 31.6 | 0.33 |
| Number of glaucome medications | 1.50 ± 0.71 | 1.51 ± 0.75 | 0.95 |
| Follow-up period (months) | 67.0 ± 50.2 | 65.0 ± 51.2 | 0.87 |
Table 2.
Corneal biomechanical parameters by ORA of the progressing and nonprogressing groups
| Progressing (n = 26) | Nonprogressing (n = 47) | p-value* | |
|---|---|---|---|
| CRF (mm Hg) | 9.1 ± 1.3 | 9.8 ± 1.5 | 0.03 |
| CH (mm Hg) | 9.5 ± 1.5 | 10.4 ± 1.4 | 0.01 |
| IOP GAT (mm Hg) | 11.6 ± 2.5 | 12.6 ± 2.7 | 0.13 |
| IOP cc (mm Hg) | 14.9 ± 4.4 | 14.3 ± 2.7 | 0.50 |
| IOP g (mm Hg) | 13.4 ± 3.9 | 13.6 ± 2.6 | 0.85 |
| IOP GAT-IOP cc (mm Hg) | −3.2 ± 3.4 | −1.7 ± 3.2 | 0.06 |
| IOP GAT-IOP g (mm Hg) | −1.8 ± 2.9 | −1.0 ± 2.3 | 0.23 |
| IOP cc-IOP g (mm Hg) | 1.5 ± 1.7 | 0.7 ± 1.6 | 0.08 |
Table 3.
Number of patients on glaucoma medication treatment by class
Table 4.
Statistical correlations between IOP GAT, IOP g, IOP cc, and clinical/ocular characteristics in the progressing and nonprogressing groups
Table 5.
Binary logistic regression testing the association between all baseline and intercurrent factors with a progression outcome
Left = univariate model including each variable independently; Right = stepwise multivariate model including corneal hysteresis and corneal resistance factor along with the other clinical variables; CCT = central corneal thickness; CH = corneal hysteresis; CI = confidence interval; CRF = corneal resistance factor; GAT = Goldmann applanation tonometry; IOP = intraocular pressure; IOP cc = corneal-compensated IOP; MD = mean deviation; PSD = pattern standard deviation; VF = visual field.
 XML Download