Abstract
Purpose
To compare the axial lengths, anterior chamber depths, and keratometric measurements and to predict post- operative refractions of AL-Scan®, IOL master®, and ultrasound.
Methods
A total of 40 eyes in 30 patients who received cataract surgery were included in the present study. The axial length, anterior chamber depth, and keratometry were measured by 2 types of partial coherence interferometry (AL-Scan® and IOL master®) and ultrasound. The SRK/T formula was used to calculate IOL power, and the predictive error which subtracts predictive refraction from postoperative refraction was compared among the ocular biometry devices.
Results
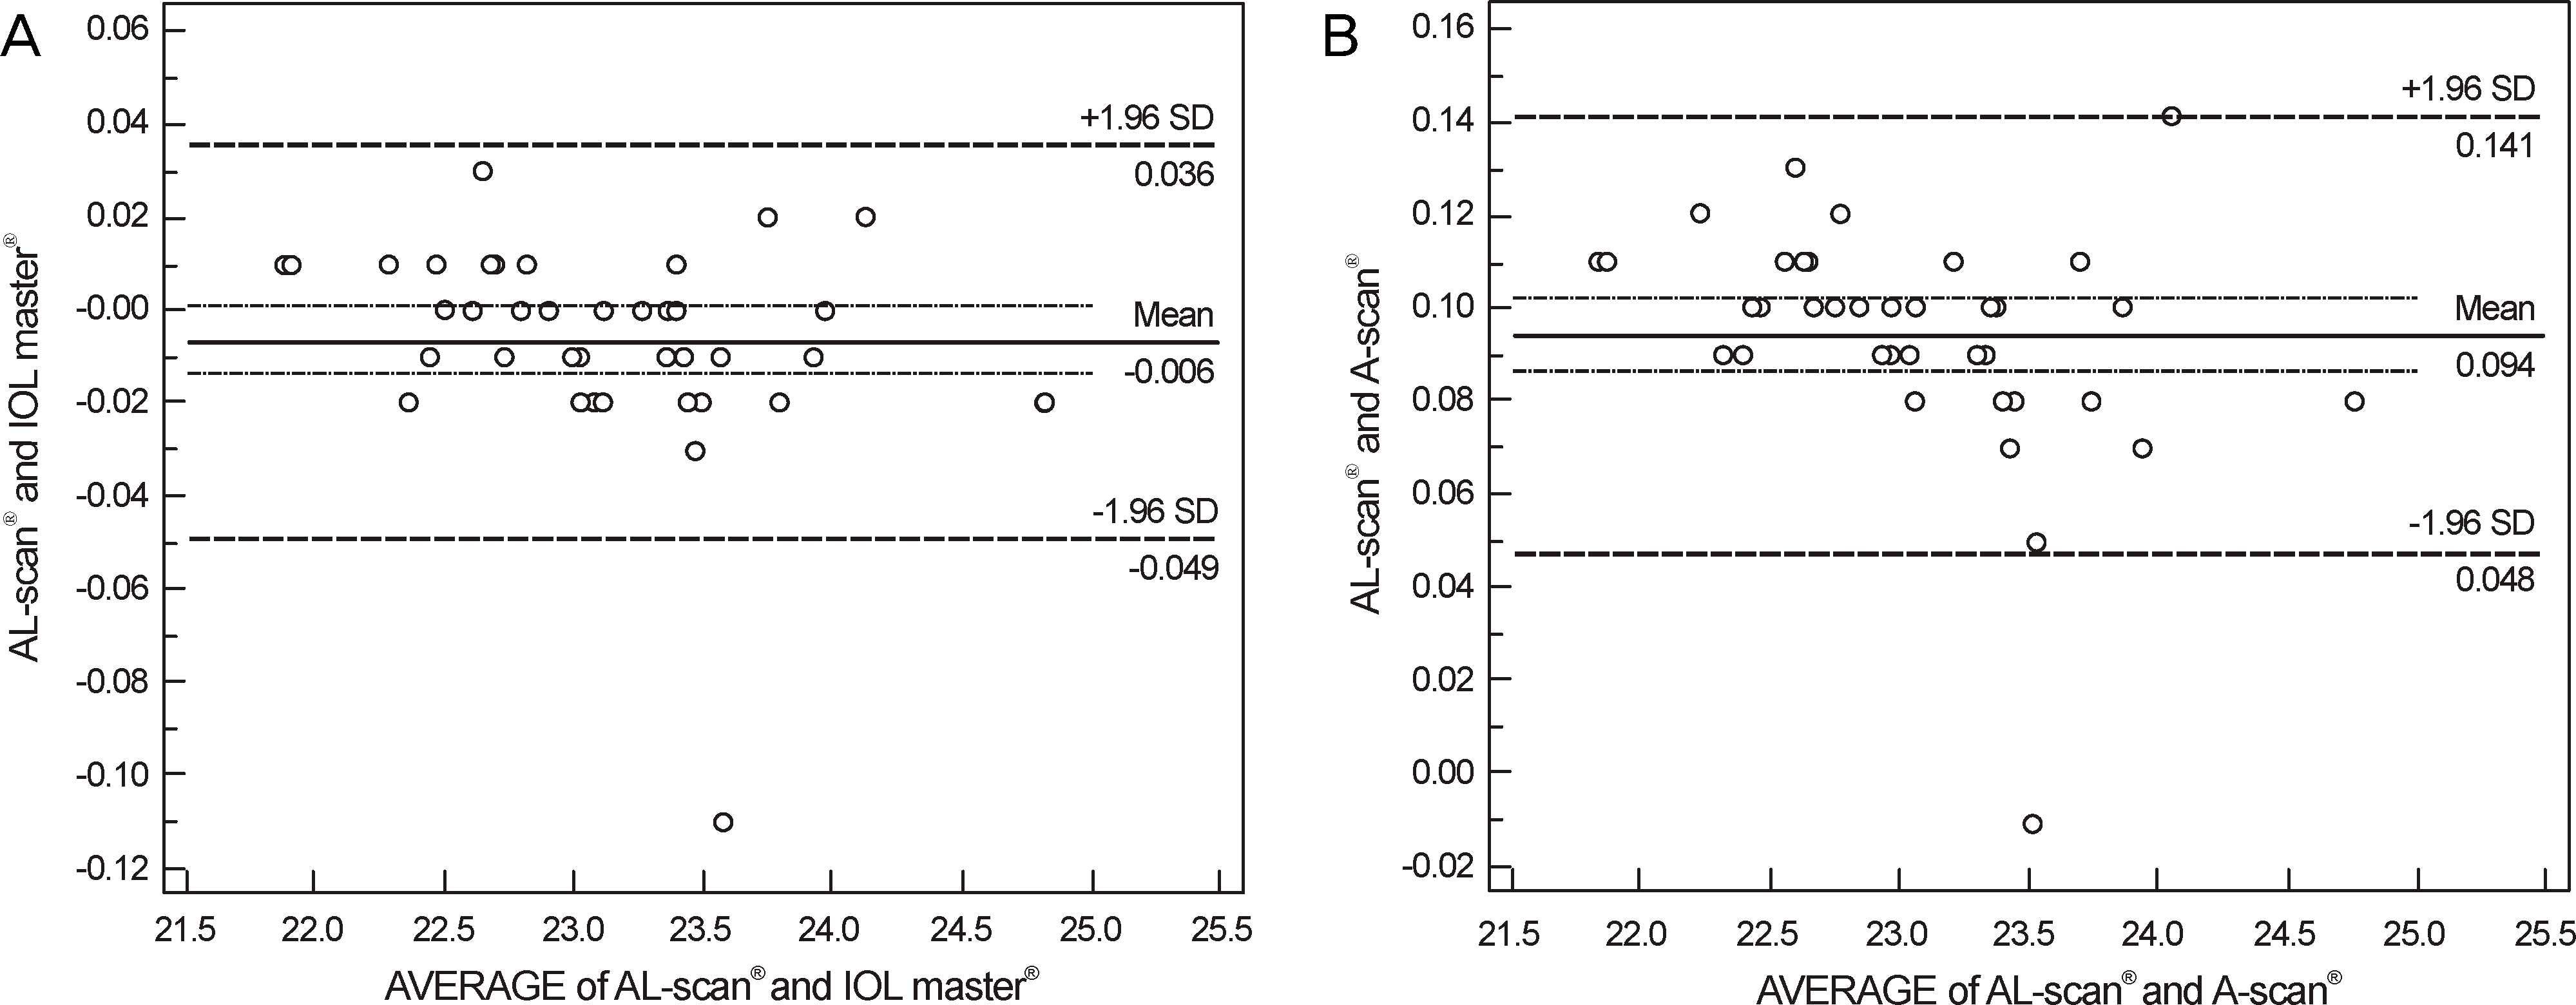
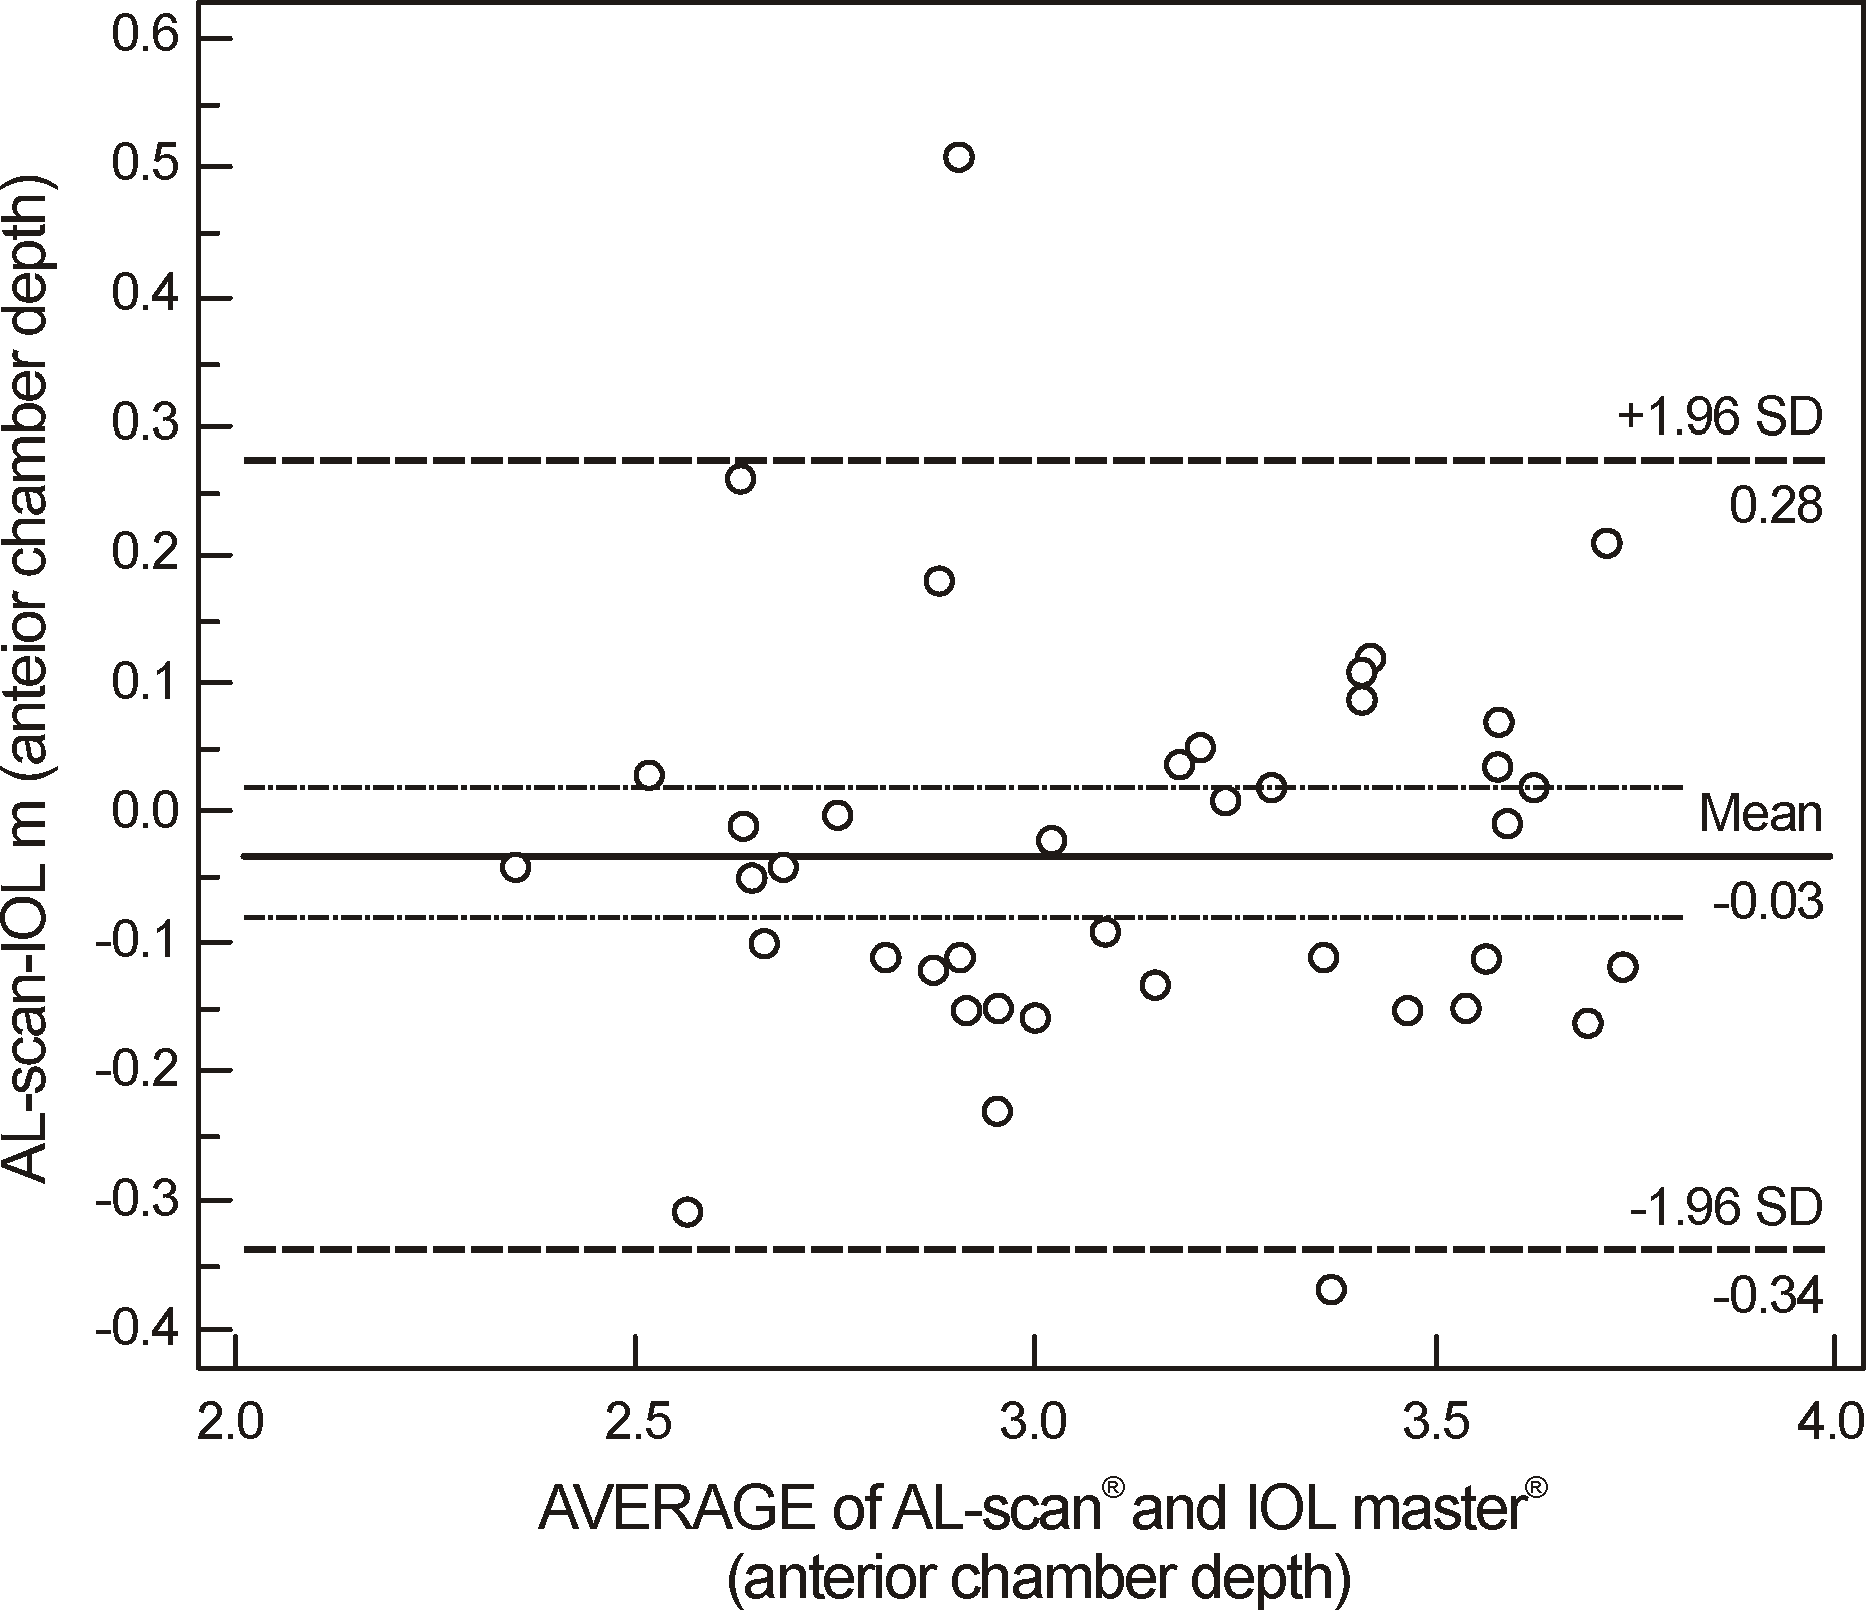
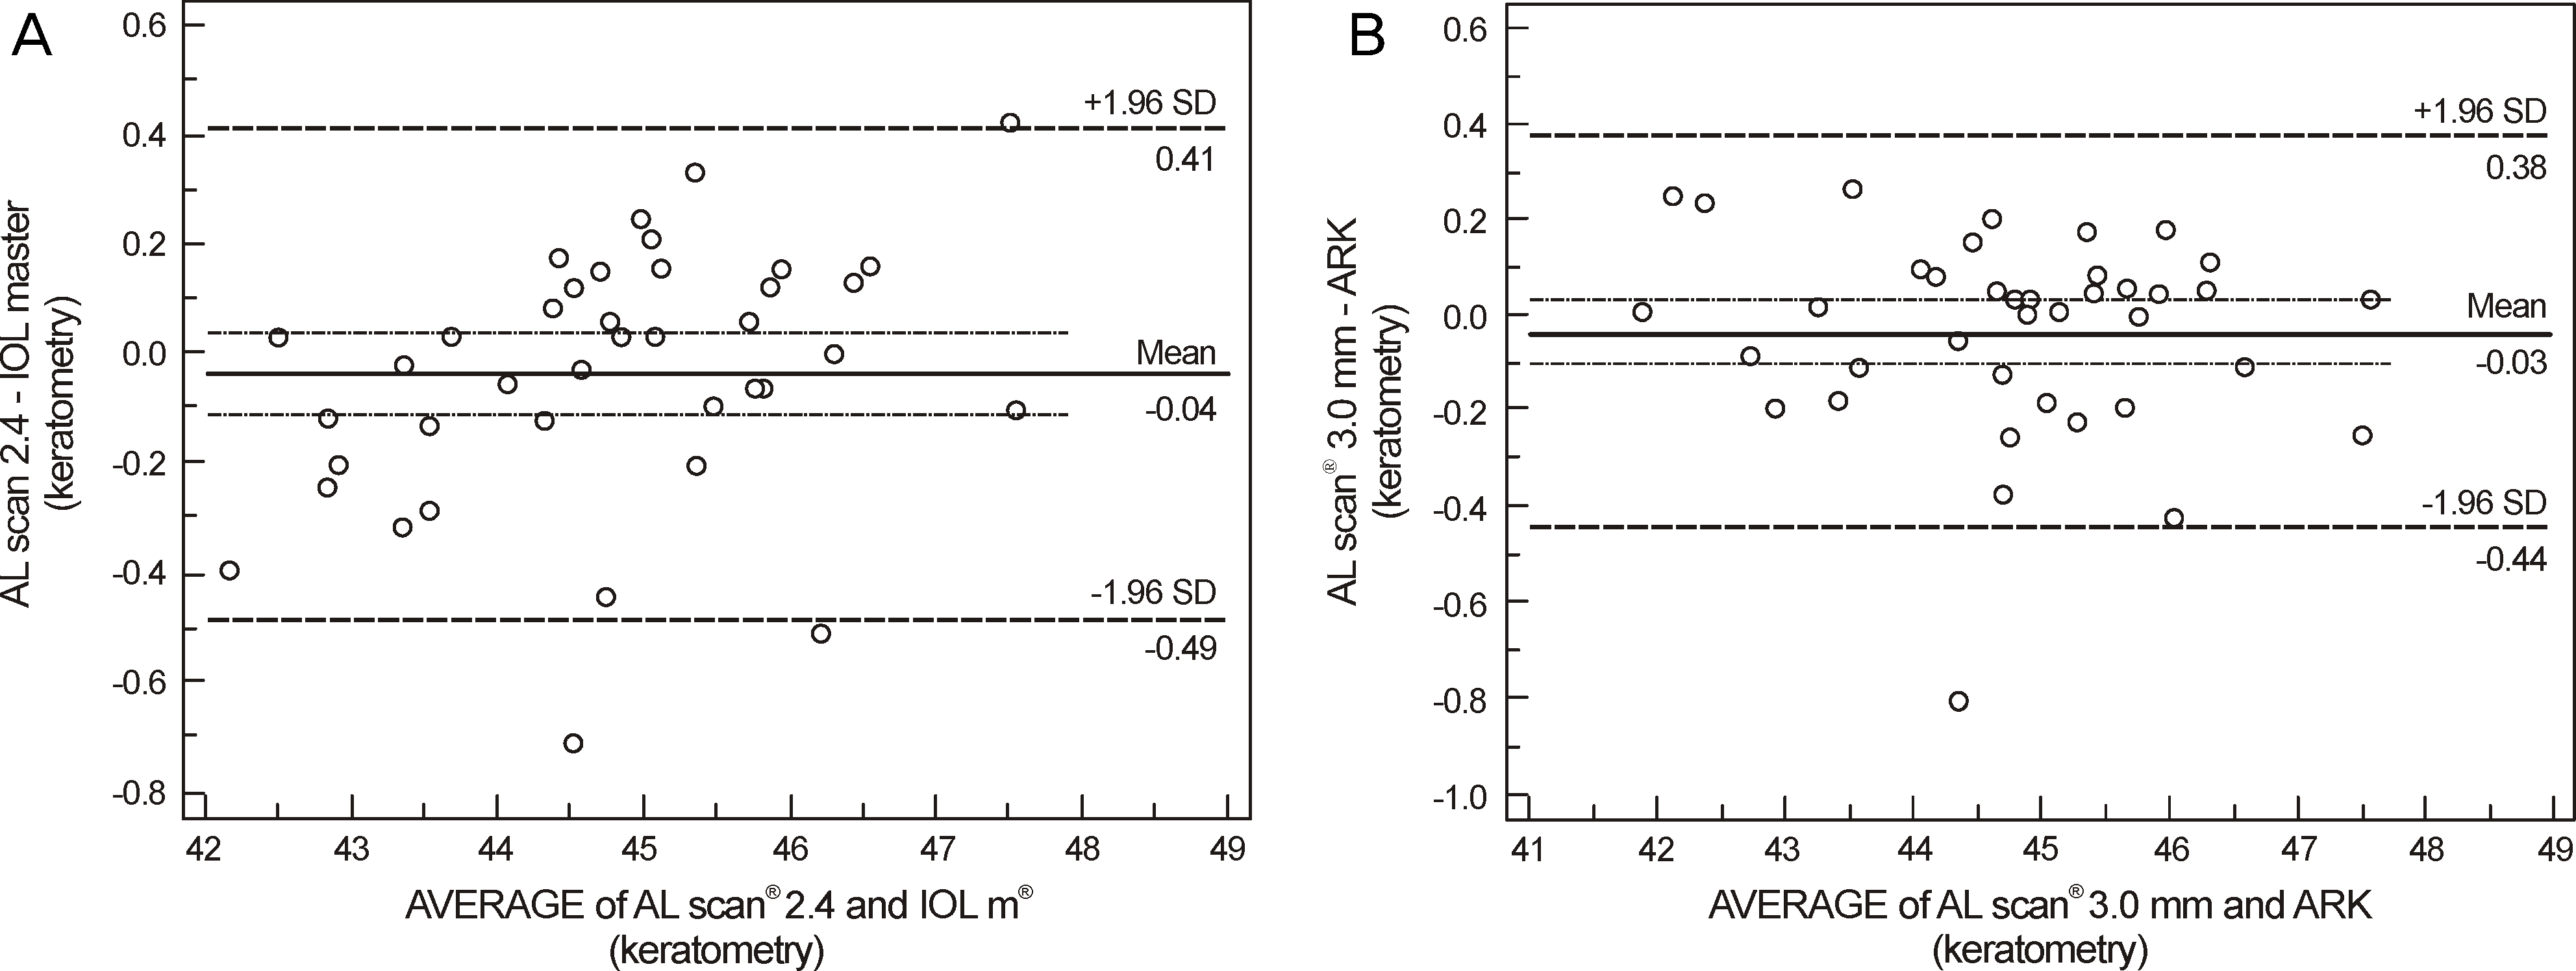
Axial lengths were 23.08 ± 0.62 mm, 23.09 ± 0.62 mm, and 22.99 ± 0.62 mm measured by AL scan®, IOL master®, and ultrasound, respectively. Axial length measured by ultrasound was statistically significantly shorter than AL scan® and IOL master® (p < 0.001, p < 0.001, respectively). The anterior chamber depth and keratometry were 3.11 ± 0.06 mm and 44.82 ± 1.34 D measured by AL scan®, and 3.13 ± 0.06 mm and 44.85 ± 1.26 D measured by IOL master®, respectively. The differences of anterior chamber depth and keratometry between the 2 devices were not statistically significant (p = 0.226, p = 0.331, respectively). The mean absolute prediction errors were 0.44 ± 0.35 D, 0.40 ± 0.34 D, and 0.39 ± 0.30 D in AL-Scan®, IOL master® and ultrasound, respectively, and were not statistically significantly different (p = 0.843, p = 0.847, p = 1.000, respectively).
References
1. Drexler W, Findl O, Menapace R, et al. Partial coherence inter- ferometry: a novel approach to biometry in cataract surgery. Am J Ophthalmol. 1998; 126:524–34.
2. Gimbel HV, Sun R. Accuracy and predictability of intraocular lens power calculation after laser in situ keratomileusis. J Cataract Refract Surg. 2001; 27:571–6.

3. Holzer MP, Mamusa M, Auffarth GU. Accuracy of a new partial coherence interferometry analyser for biometric measurements. Br J Ophthalmol. 2009; 93:807–10.

4. Drexler W, Hitzenberger CK, Baumgartner A, et al. Investigation of dispersion effects in ocular media by multiple wavelength parti- al coherence interferometry. Exp Eye Res. 1998; 66:25–33.
5. Lam AK, Chan R, Pang PC. The repeatability and accuracy of axial length and anterior chamber depth measurements from the IOLMaster. Ophthalmic Physiol Opt. 2001; 21:477–83.
6. Retzlaff JA Sand, ers DR, Kraff MC. Development of the SRK/T intraocular lens implant power calculation formula. J Cataract Refract Surg. 1990; 16:333–40.
7. Olsen T. Sources of error in intraocular lens power calculation. J Cataract Refract Surg. 1992; 18:125–9.

8. Giers U, Epple C. Comparison of A-scan device accuracy. J Cataract Refract Surg. 1990; 16:235–42.

9. Haigis W, Lege B, Miller N, Schneider B. Comparison of im- mersion ultrasound biometry and partial coherence interferometry for intraocular lens calculation according to Haigis. Graefes Arch Clin Exp Ophthalmol. 2000; 238:765–73.
10. Hoffer KJ, Shammas HJ, Savini G. Comparison of 2 laser instru- ments for measuring axial length. J Cataract Refract Surg. 2010; 36:644–8.
11. Findl O, Drexler W, Menapace R, et al. Improved prediction of in- traocular lens power using partial coherence interferometry. J Cataract Refract Surg. 2001; 27:861–7.
12. Rajan MS, Keilhorn I, Bell JA. Partial coherence laser inter- ferometry vs conventional ultrasound biometry in intraocular lens power calculations. Eye (Lond). 2002; 16:552–6.
13. Rose LT, Moshegov CN. Comparison of the Zeiss IOLMaster and applanation A-scan ultrasound: biometry for intraocular lens calculation. Clin Experiment Ophthalmol. 2003; 31:121–4.

14. Eleftheriadis H. IOLMaster biometry: refractive results of 100 consecutive cases. Br J Ophthalmol. 2003; 87:960–3.

15. Santodomingo-Rubido J, Mallen EA, Gilmartin B, Wolffsohn JS. A new non-contact optical device for ocular biometry. Br J Ophthalmol. 2002; 86:458–62.

16. Buckhurst PJ, Wolffsohn JS, Shah S, et al. A new optical low co- herence reflectometry device for ocular biometry in cataract patients. Br J Ophthalmol. 2009; 93:949–53.
17. Utine CA, Altin F, Cakir H, Perente I. Comparison of anterior chamber depth measurements taken with the Pentacam, Orbscan IIz and IOLMaster in myopic and emmetropic eyes. Acta Ophthalmol. 2009; 87:386–91.

18. Lackner B, Schmidinger G, Skorpik C. Validity and repeatability of anterior chamber depth measurements with Pentacam and Orbscan. Optom Vis Sci. 2005; 82:858–61.

19. Rabsilber TM, Becker KA, Frisch IB, Auffarth GU. Anterior chamber depth in relation to refractive status measured with the Orbscan II Topography System. J Cataract Refract Surgy. 2003; 29:2115–21.

20. Reddy AR Pand, e MV, Finn P, El-Gogary H. Comparative estimation of anterior chamber depth by ultrasonography, Orbscan II, and IOLMaster. J Cataract Refract Surg. 2004; 30:1268–71.
21. Shin JW, Seong MC, Kang MH, et al. Comparison of ocular bio- metry and postoperative refraction in cataract patients between Lenstar® and IOL master®. J Korean Ophthalmol Soc. 2012; 53:833–8.
22. Kwag JY, Choi SH. Comparison of ocular biometry measured by ultrasound and two kinds of partial coherence interferometers. J Korean Ophthalmol Soc. 2011; 52:169–74.

23. Kim DY, Kim MJ, Kim JY, Tchah HW. Comparison of formulas for intraocular lens power calculation installed in a parital coherence interferometer. J Korean Ophthalmol Soc. 2009; 50:523–8.
24. Jun RM, Kang SY, Kim BY. Accuracy of biometry and intraocular lens power calculation with partial coherence interferometry in high myopia. J Korean Ophthalmol Soc. 2008; 49:1746–51.

25. Hwang JS, Lee JH. Comparison of the IOL master® and A-scan ul- trasound: refractive results of 96 consecutive cases. J Korean Ophthalmol Soc. 2007; 48:27–32.
26. Chung JK, Choe CM, You YS, Lee SJ. Biometry with partial co- herence interferometry and ultrasonography in high myopes. J Korean Ophthalmol Soc. 2006; 47:355–61.
27. Song BY, Yang KJ, Yoon KC. Accuracy of partial coherence inter- ferometry in intraocular lens power calculation. J Korean Ophthalmol Soc. 2005; 46:775–80.
Figure 1.
Bland-Altman plot of axial length between AL scan® and IOL master® (A), and A-scan (B) (95% limits of agreement for axial length difference: AL scan® -IOL master® [-0.049, 0.036]; AL scan® - A-scan [0.048, 0.141]).

Figure 2.
Bland-Altman plot of anterior chamber depth between AL scan® and IOL master® (95% limits of agreement for axial length difference: AL scan® - IOL master® [-0.34, 0.28]).

Figure 3.
Bland-Altman plot of keratometry between AL scan® and IOL master® (A), and Auto refractive keratometry (ARK) (B) (95% limits of agreement for axial length difference: AL scan® -IOL master® [-0.49, 0.41]; AL scan® - ARK [-0.44, 0.38]).

Table 1.
Demographics and Biometry measurements by AL scan®, IOL master®, A-scan
| AL scan® | IOL master® | A-scan | |
|---|---|---|---|
| Age (years) | 68.7 ± 9.1 (51-95) | − | − |
| Sex (M/F) | 40 (18/22) | − | − |
| AL* (mm) | 23.08 ± 0.62 | 23.09 ± 0.62 | 22.99 ± 0.62 |
| ACD† (mm) | 3.11 ± 0.06 | 3.13 ± 0.06 | − |
| K 2.4‡ mm (diopter) | 44.82 ± 1.34 | 44.85 ± 1.26 | − |
| K 3.0‡ mm (diopter) | 44.75 ± 1.34 | − | − |
Table 2.
Comparison of Absolute prediction error among AL scan®, IOL master®, A-scan
|
Prediction error (diopter) |
Number of eyes (%) |
|||||
|---|---|---|---|---|---|---|
| Absolute PE* | Range | 0.5D | 1.0D | 1.5D | 2.0D | |
| AL scan® | 0.44 ± 0.35 | 0.04-1.59 | 22†,‡(55%) | 38 (95%) | 39 (97.5%) | 40 (100%) |
| IOL master® | 0.40 ± 0.34 | 0.03-1.58 | 27 (67.5%) | 39 (97.5%) | 39 (97.5%) | 40 (100%) |
| A-scan | 0.40 ± 0.30 | 0.01-1.17 | 29 (72.5%) | 38 (95%) | 40 (100%) | 40 (100%) |


 PDF
PDF ePub
ePub Citation
 Print
Print


 XML Download