Abstract
Purpose
To evaluate the course of the hypertensive phase (HP) after Ahmed glaucoma valve (AGV) implantation and the effects of digital ocular massage.
Methods
A total of 131 eyes of 131 patients, who underwent AGV implantation surgery, were studied retrospectively. HP was defined as an IOP (intraocular pressure) ≥ 22 mm Hg within 6 months after surgery. Various clinical factors related to the occurrence of HP were analyzed. The HP group was compared to the non-HP group. Ocular massage was performed in patients showing acute elevation of IOP at a relatively early postoperative period, and the effects were compared with the non-massage group. The patients who received ocular massage were divided, based on its effects, and compared.
Results
HP developed in 62.6% of the patients after AGV surgery, and the success rate was significantly lower in the HP group. HP occurred more often in males and in patients with high IOP before surgery. HP developed in 82 eyes at 3.3 weeks after surgery in average. Ocular massage was performed in 30 eyes that showed acute IOP increase. The amount of IOP reduction, compared to 1 month after surgery, was greater in massage group than no massage group from 2 months to 3 years after surgery. Successful IOP control by ocular massage was observed in 14 eyes (46.7%), and the success rate was higher in these patients than the patients who showed no significant IOP reduction by ocular massage. But, the difference was not significant (p = 0.072).
References
1. Molteno ACB. New implant for drainage in glaucoma: clinical trial. Br J Ophthalmol. 1969; 53:606–15.

2. Schocket SS, Lakhanpal V, Richards RD. Anterior chamber tube shunt to an encircling band in the treatment of neovascular glaucoma. Ophthalmology. 1982; 89:1188–94.

3. Lloyd MA, Baerveldt G, Heuer DK, et al. Initial clinical experience with the baerveldt implant in complicated glaucomas. Ophthalmology. 1994; 101:640–50.

4. Ahn BH, Kim CS, Kim YB. Use of e-PTFE membrane for glaucoma drainage surgery. J Korean Ophthalmol Soc. 1990; 31:603–14.
5. Coleman AL, Hill R, Wilson MR, et al. Initial clinical experience with the Ahmed Glaucoma Valve implant. Am J Ophthalmol. 1995; 120:23–31.

6. Krupin T, Podos SM, Becker B, Newkirk JB. Valve implants in filtering surgery. Am J Ophthalmol. 1976; 81:232–5.

7. Joseph NH, Sherwood MB, Trantas G, et al. A one-piece drainage system for glaucoma surgery. Trans Ophthalmol Soc U K. 1986; 105:657–64.
8. White TC. Clinical results of glaucoma surgery using the White glaucoma pump shunt. Ann Ophthalmol. 1992; 24:365–73.
9. Prata JA Jr, Mérmoud A, LaBree L, Minckler DS. In vitro and in vivo flow characteristics of glaucoma drainage implants. Ophthalmology. 1995; 102:894–904.

10. Molteno TE, Dempster AG. Methods of controlling bleb fibrosis around drainage implants. Mills KB, editor. AHMED GLAUCOMA VALVE 1007 Fourth International Symposium of the Northern Eye Institute. 1st ed.136. Manchester, UK: Pergamon Press;1988. p. 192–211.
11. Nouri-Mahdavi K, Caprioli J. Evaluation of the hypertensive phase after insertion of the Ahmed Glaucoma Valve. Am J Ophthalmol. 2003; 136:1001–8.

12. Wu SC, Huang SC, Lin KK. Clinical experience with the Ahmed glaucoma valve implant in complicated glaucoma. Chang Gung Med J. 2003; 26:904–10.
13. Ayyala RS, Zurakowski D, Smith JA, et al. A clinical study of the Ahmed glaucoma valve implant in advanced glaucoma. Ophthalmology. 1998; 105:1968–76.
14. Buys YM, Trope GE. Massage: technique and complications. Trope GE, editor. Glaucoma Surgery. New York, NY: Taylor and Francis;2005. p. 139–44.
15. Wieland M, Spaeth GL. Use of digital compression following glaucoma surgery. Ophthalmic Surg. 1988; 19:350–2.

16. Lerner SF, Parrish RK. Early postoperative trabeculectomy management: days 2-21. Lerner SF, Parrish RK, editors. Glaucoma Surgery. Philadelphia: Lippincortt Williams and Wilkins;2003. p. 63–75.
17. Morgan KS, Black B, Ellis FD, Helveston EM. Treatment of congenital glaucoma. Am J Ophthalmol. 1981; 92:799–803.

18. deLuise VP, Anderson DR. Primary infantile glaucoma (congenital glaucoma). Surv Ophthalmol. 1983; 28:1–19.

19. Lee YW, Yim JH, Lee SB, Kim CS. The factors associated with the success of Ahmed glaucoma valve implantation. J Korean Ophthalmol Soc. 2005; 46:1509–17.
20. Englert JA, Freedman SF, Cox TA. The Ahmed valve in refractory pediatric glaucoma. Am J Ophthalmol. 1999; 127:34–42.

21. Huang MC, Netland PA, Coleman AL, et al. Intermediate-term clinical experience with the Ahmed Glaucoma Valve implant. Am J Ophthalmol. 1999; 127:27–33.
22. Fellenbaum PS, Almeida AR, Minckler DS, et al. Krupin disk implantation for complicated glaucomas. Ophthalmology. 1994; 101:1178–82.

23. Lieberman MF, Ewing RH. Drainage implant surgery for refractory glaucoma. Int Ophthalmol Clin. 1990; 30:198–208.

Figure 1.
Kaplan-Meier survival curve: Cumulative success after Ahmed glaucoma valve implant surgery. Success: 5 mm Hg < IOP < 22 mmHg (with or without anti-glaucoma medication). Success rates are 96.2% at 6 month, 90.2% at 1 year, 81.3% at 2 years, 78.4% at 3 years after sugery.
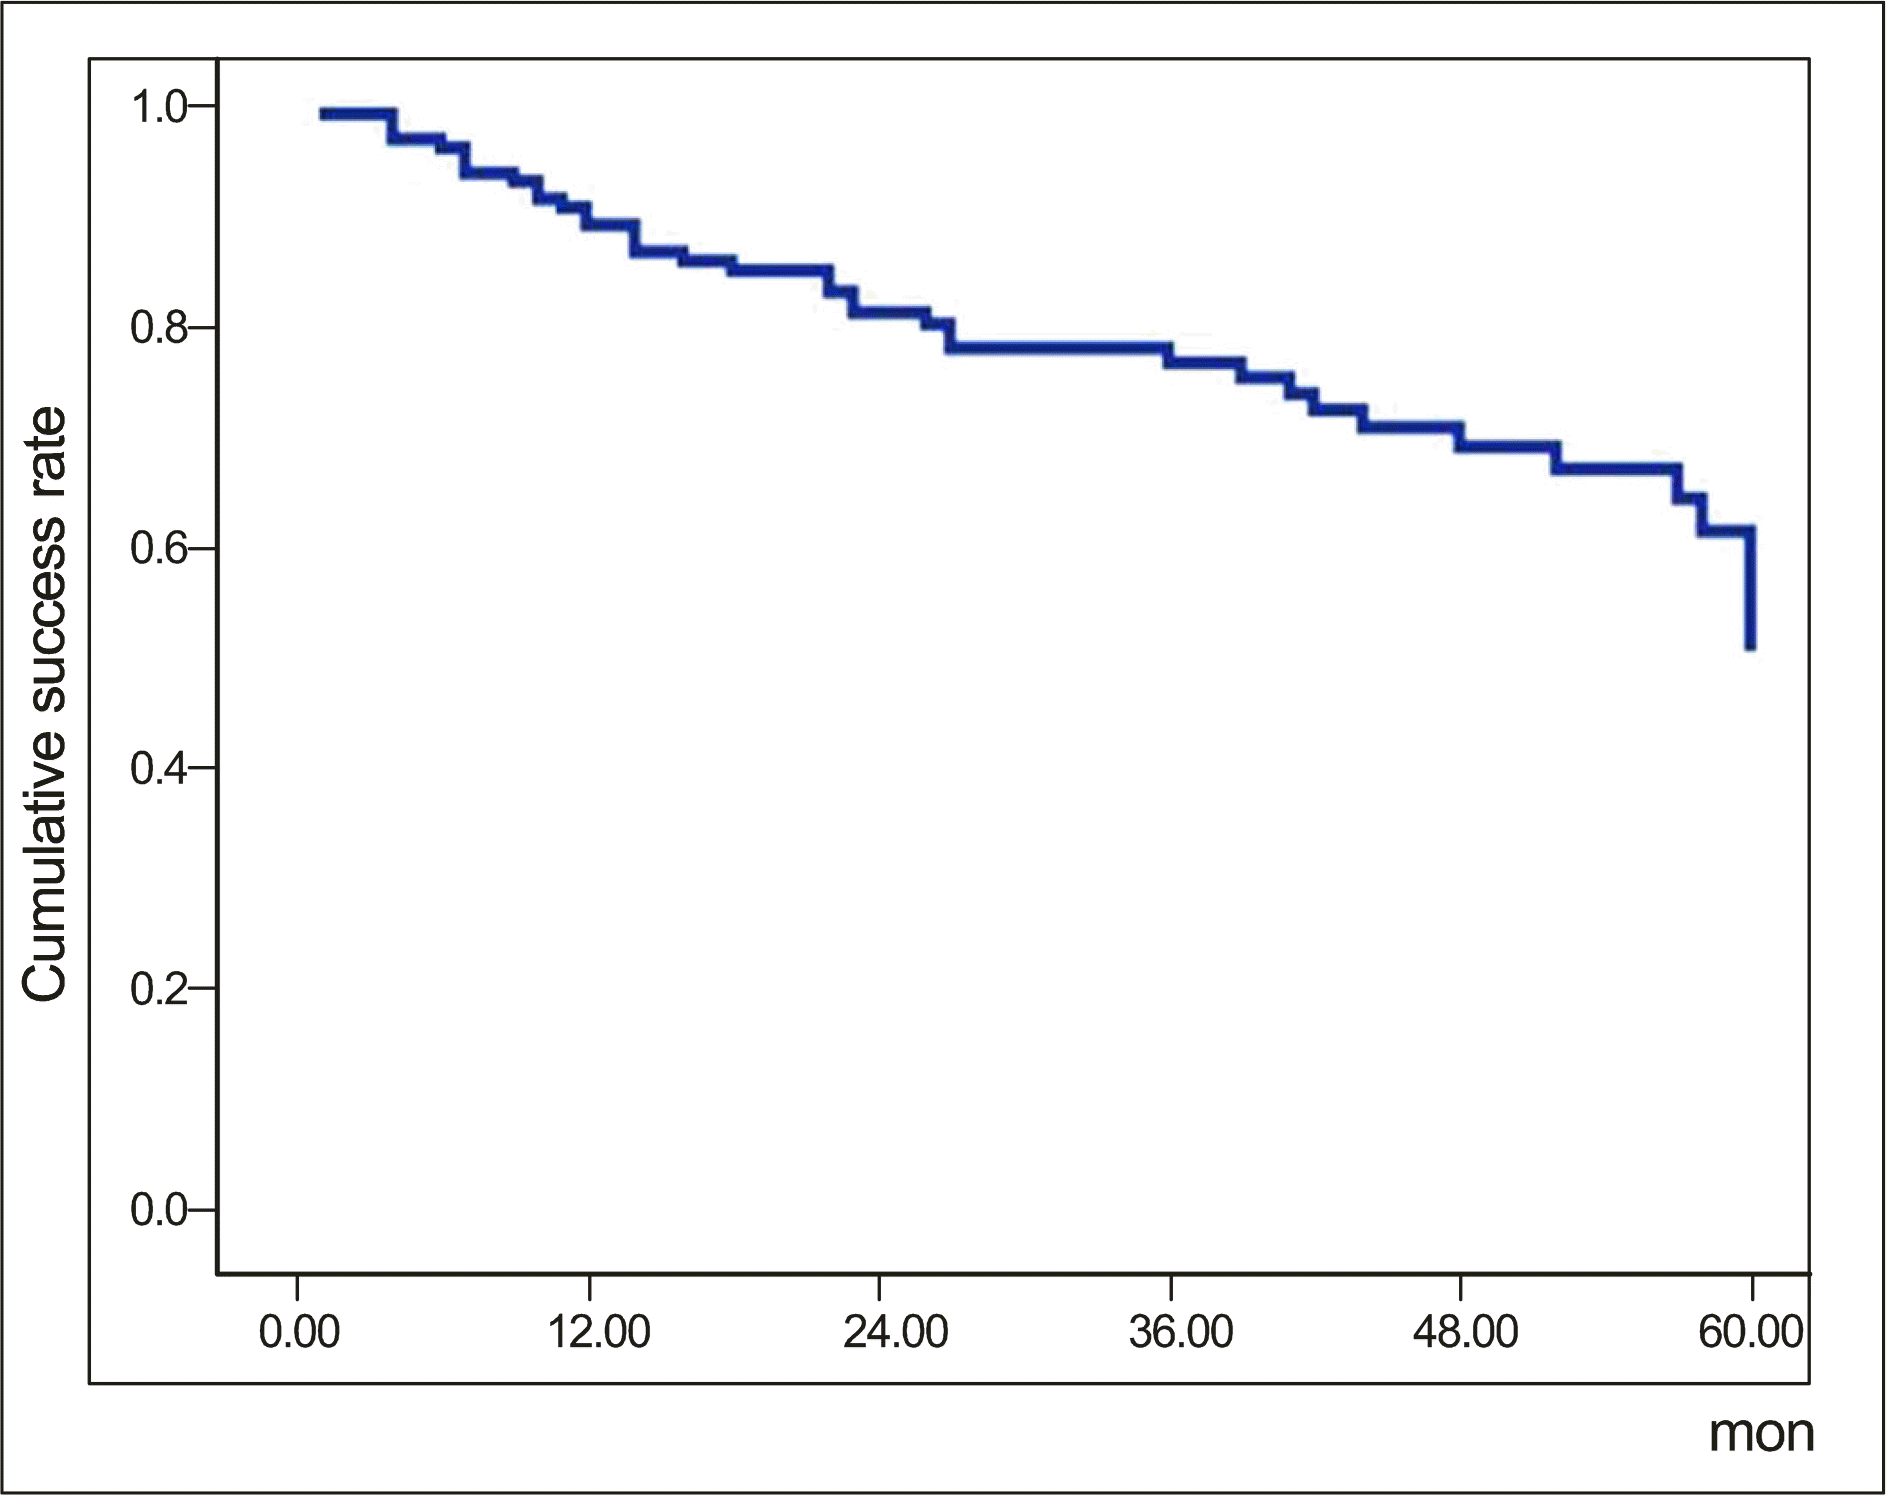
Figure 2.
Kaplan-Meier survival curve: Comparison of cumulative success after Ahmed glaucoma valve implant surgery between the group with hypertensive phase and without hypertensive phase. Success: 5 mm Hg < IOP < 22 mmHg (with or without anti-glaucoma medication). Cumulative survival in the group with hypertensive phase: 85.1% at 12 month, 75.0% at 24 month, 69.5% at 36 month postoperatively. Cumulative survival in the group without hypertensive phase was 95.9% at 12 month, 91.4% at 24 month, 88.2% at 36 months. The difference between the 2 groups was statistically significant (p = 0.007, log rank test).
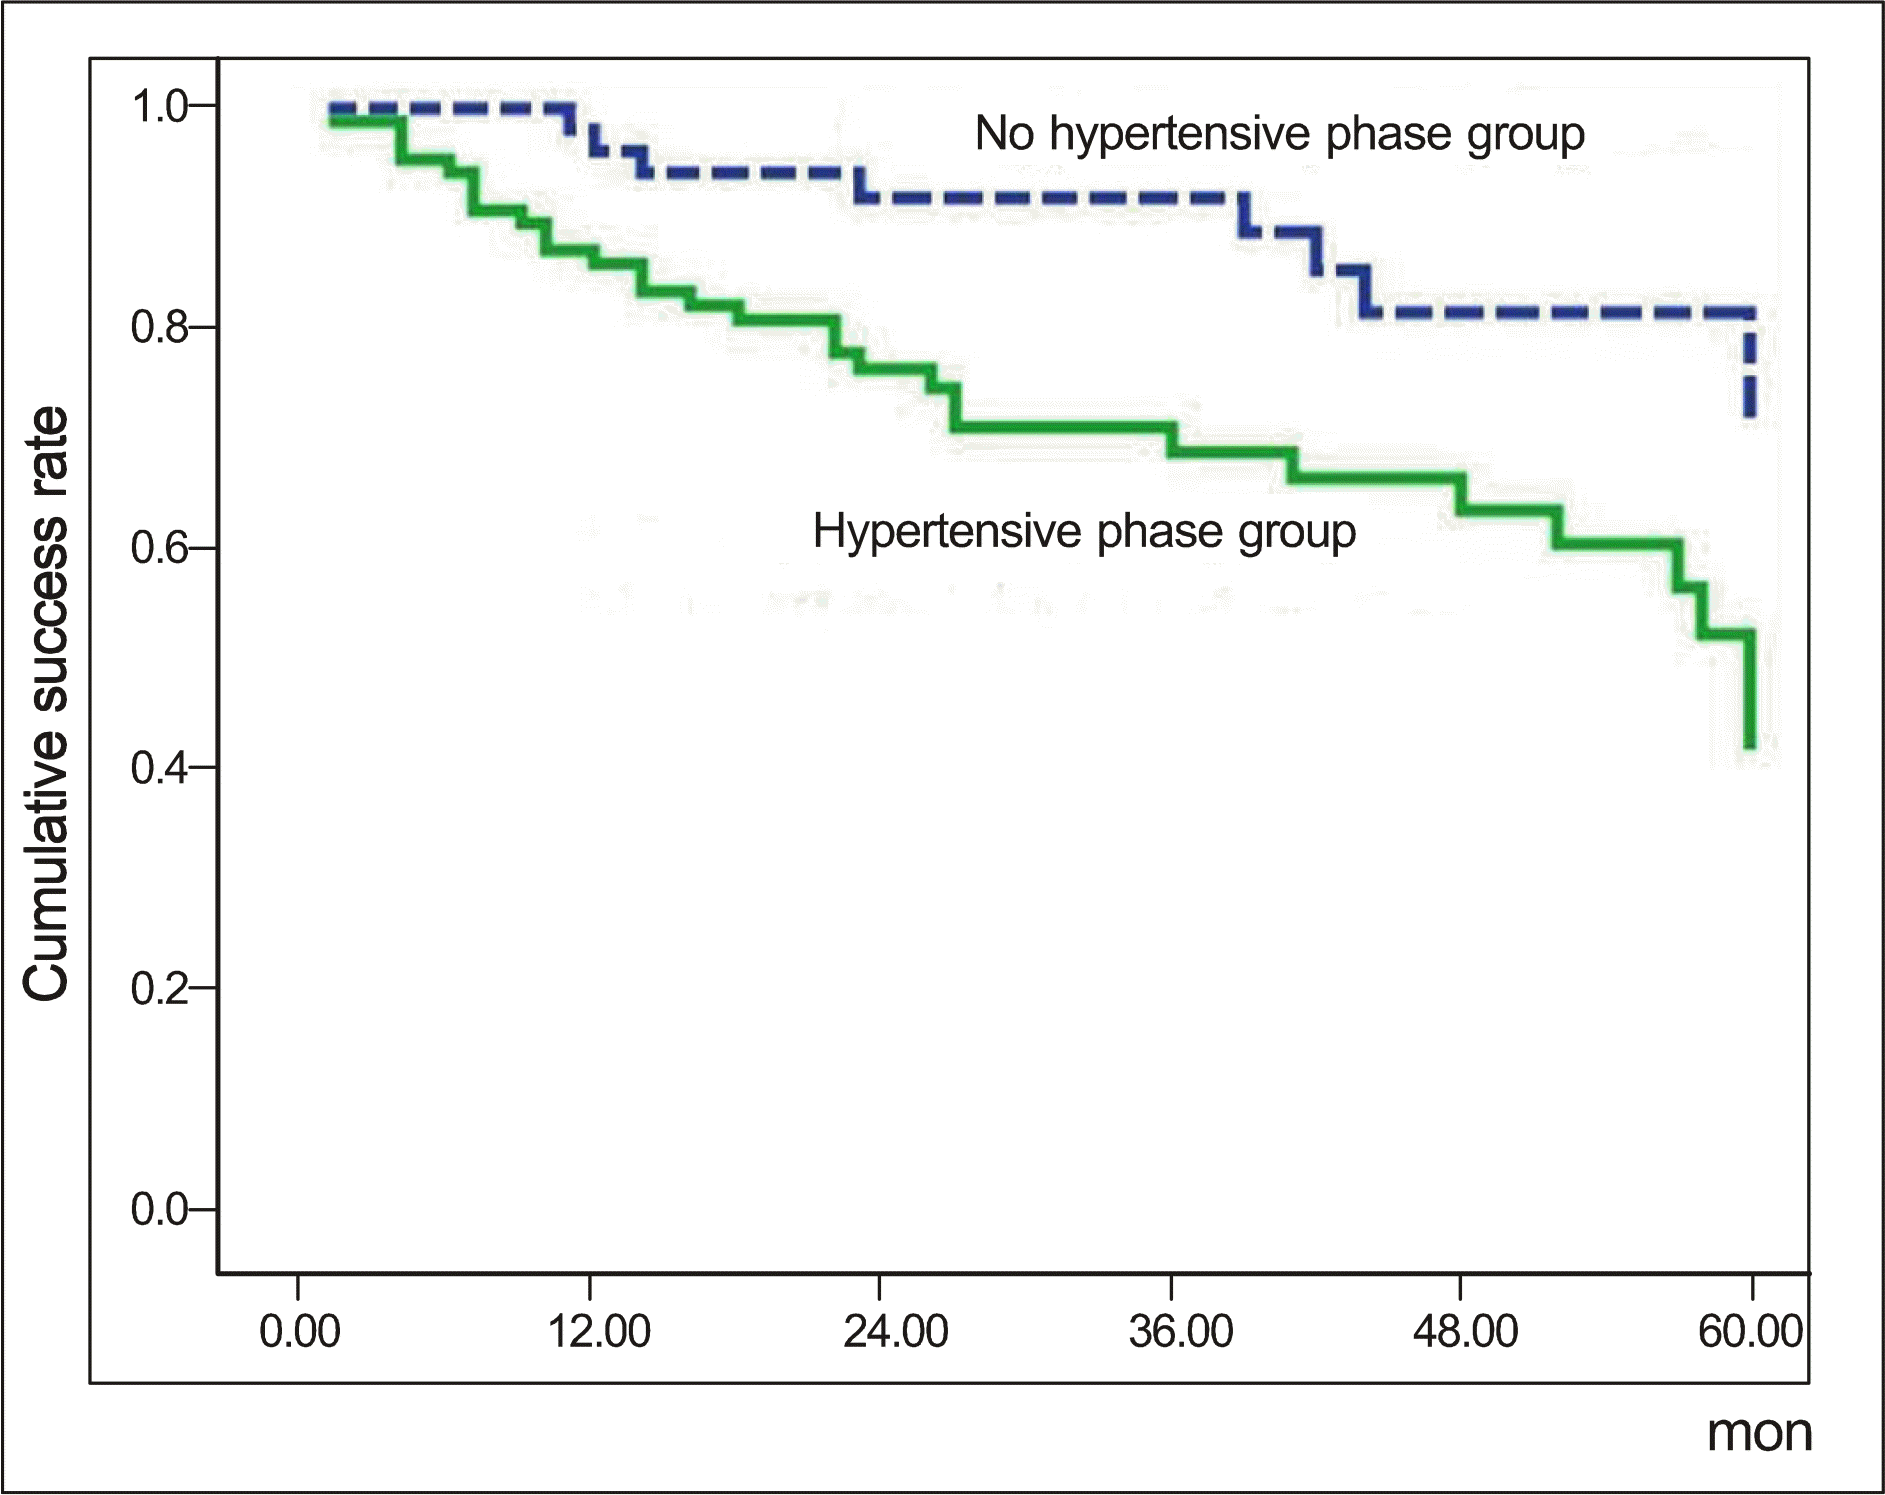
Figure 3.
Changes in intraocular pressure in the groups with and without hypertensive phase. ∗ Significantly higher IOP between 2 groups (p < 0.05, independent T-test).
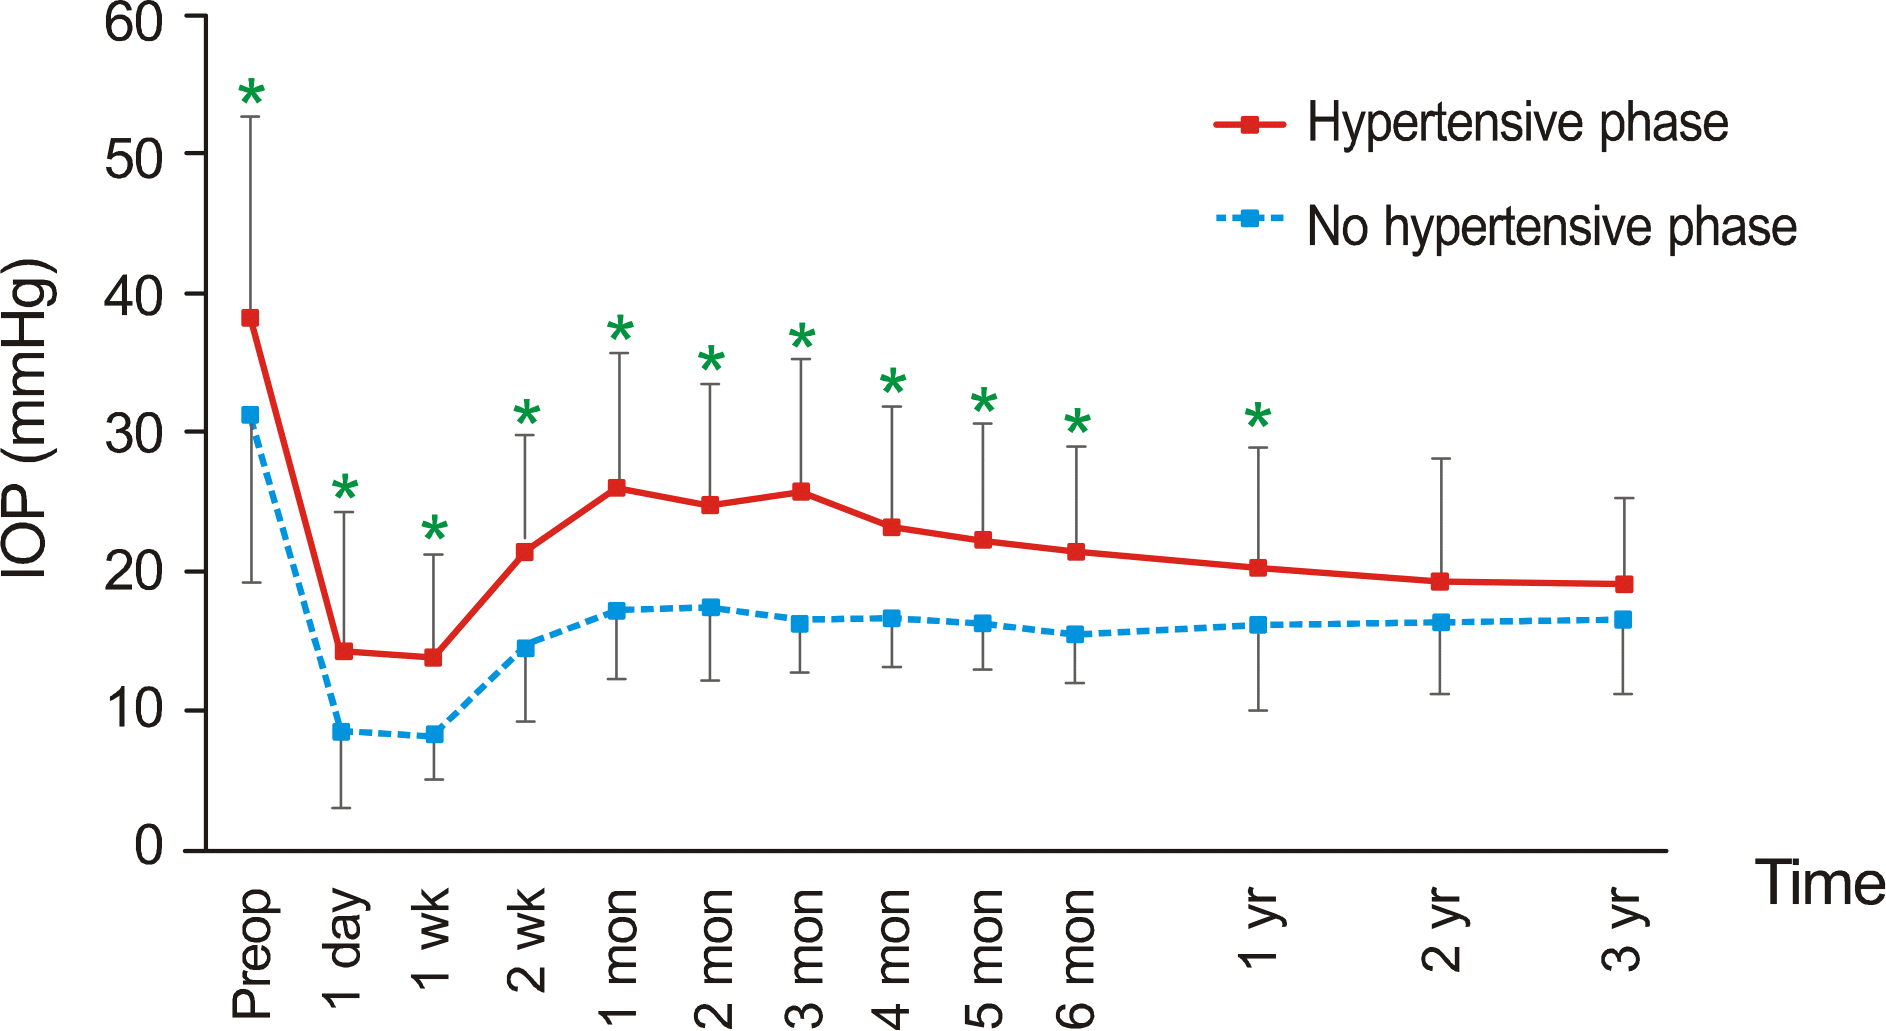
Figure 4.
Change in the number of glaucoma medications in the ∗ Significantly higher groups with and without hypertensive phase. number of medication between 2 groups (p < 0.05, independent T-test).
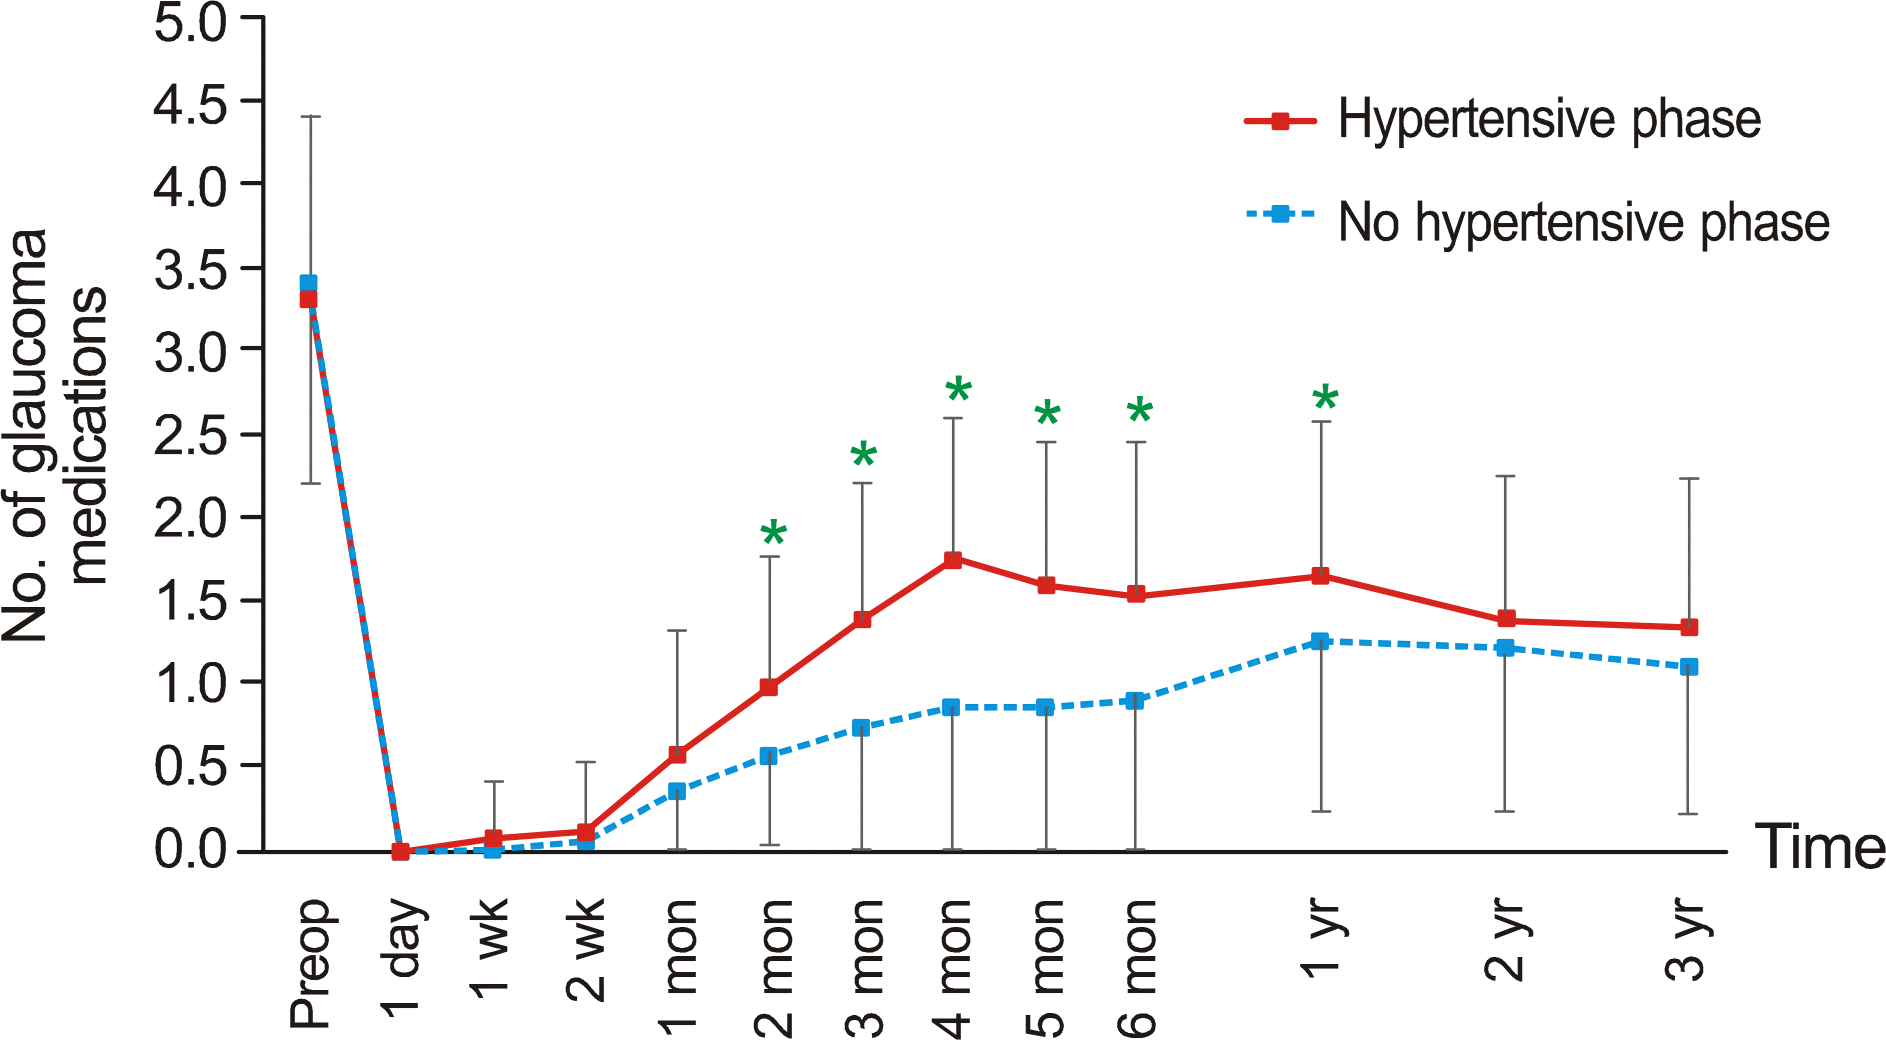
Figure 5.
Change in intraocular pressure in the groups with and without ocular massage. ∗ Significantly higher intraocular pressure between 2 groups (p < 0.05, independent T-test).
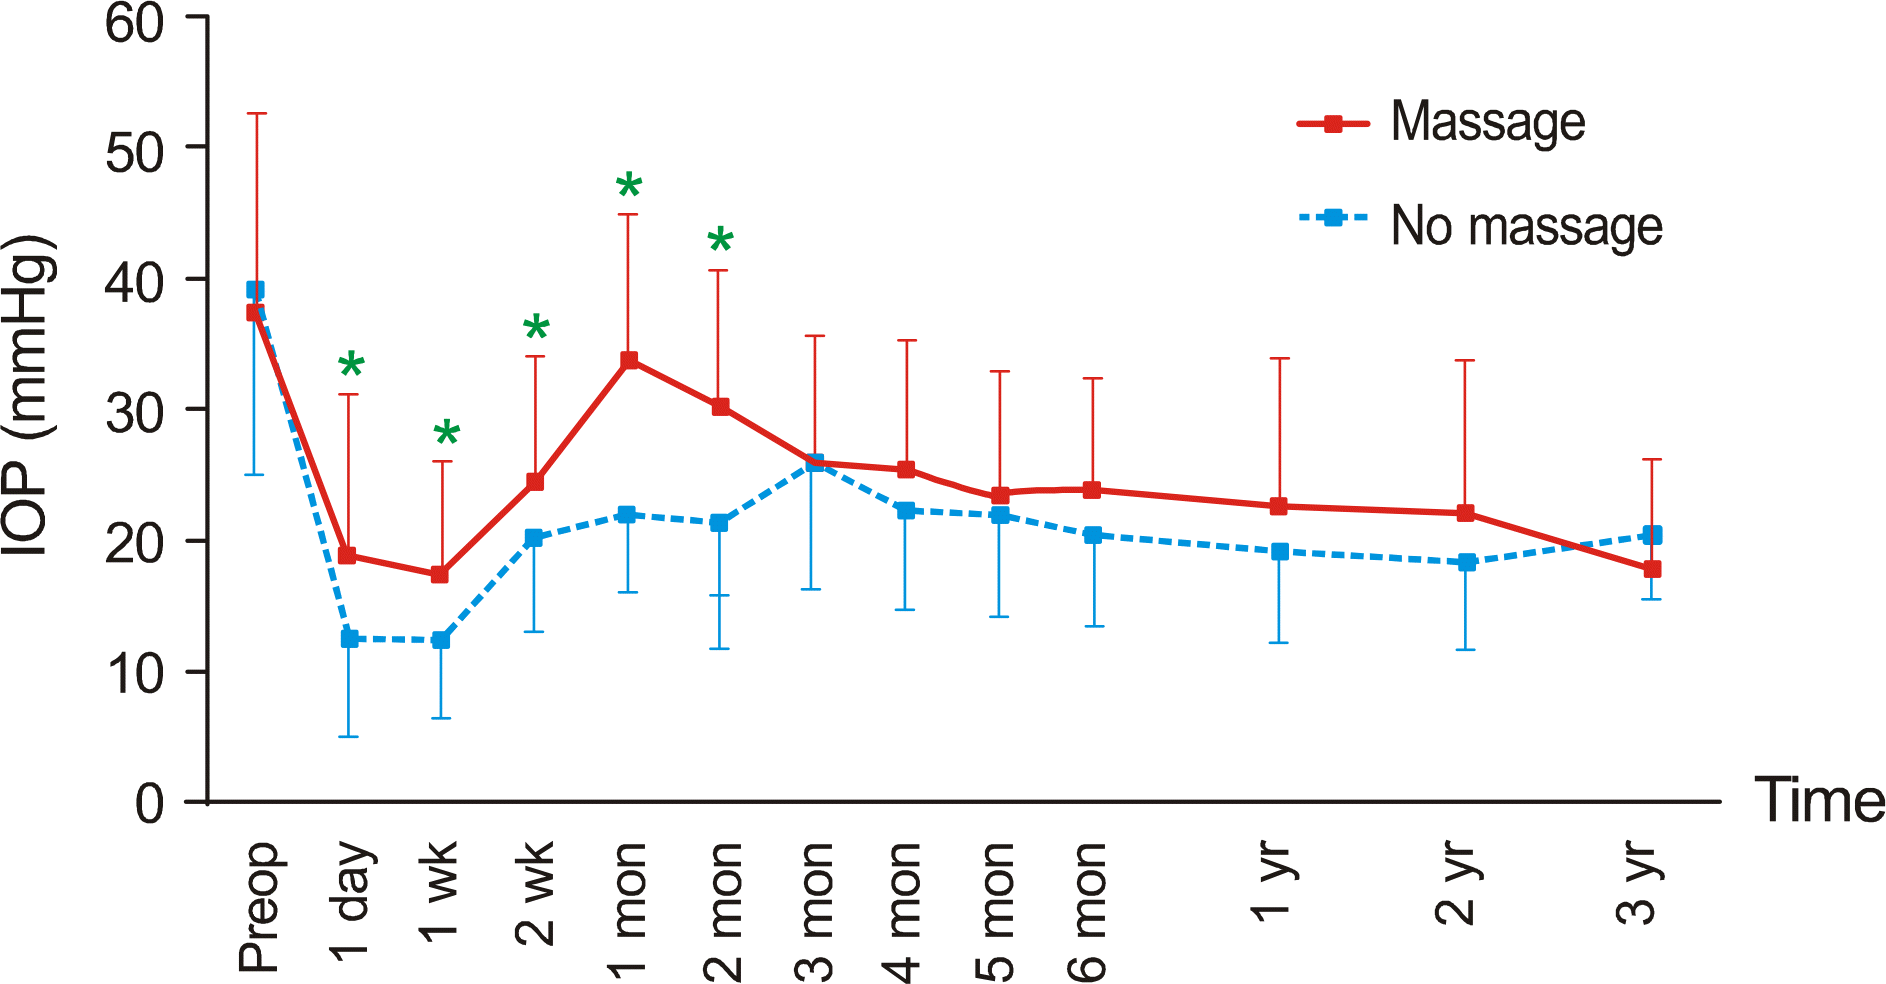
Figure 6.
Change in the number of glaucoma medication in the groups with and without ocular massage. There is no significant difference between two groups at all the time points.
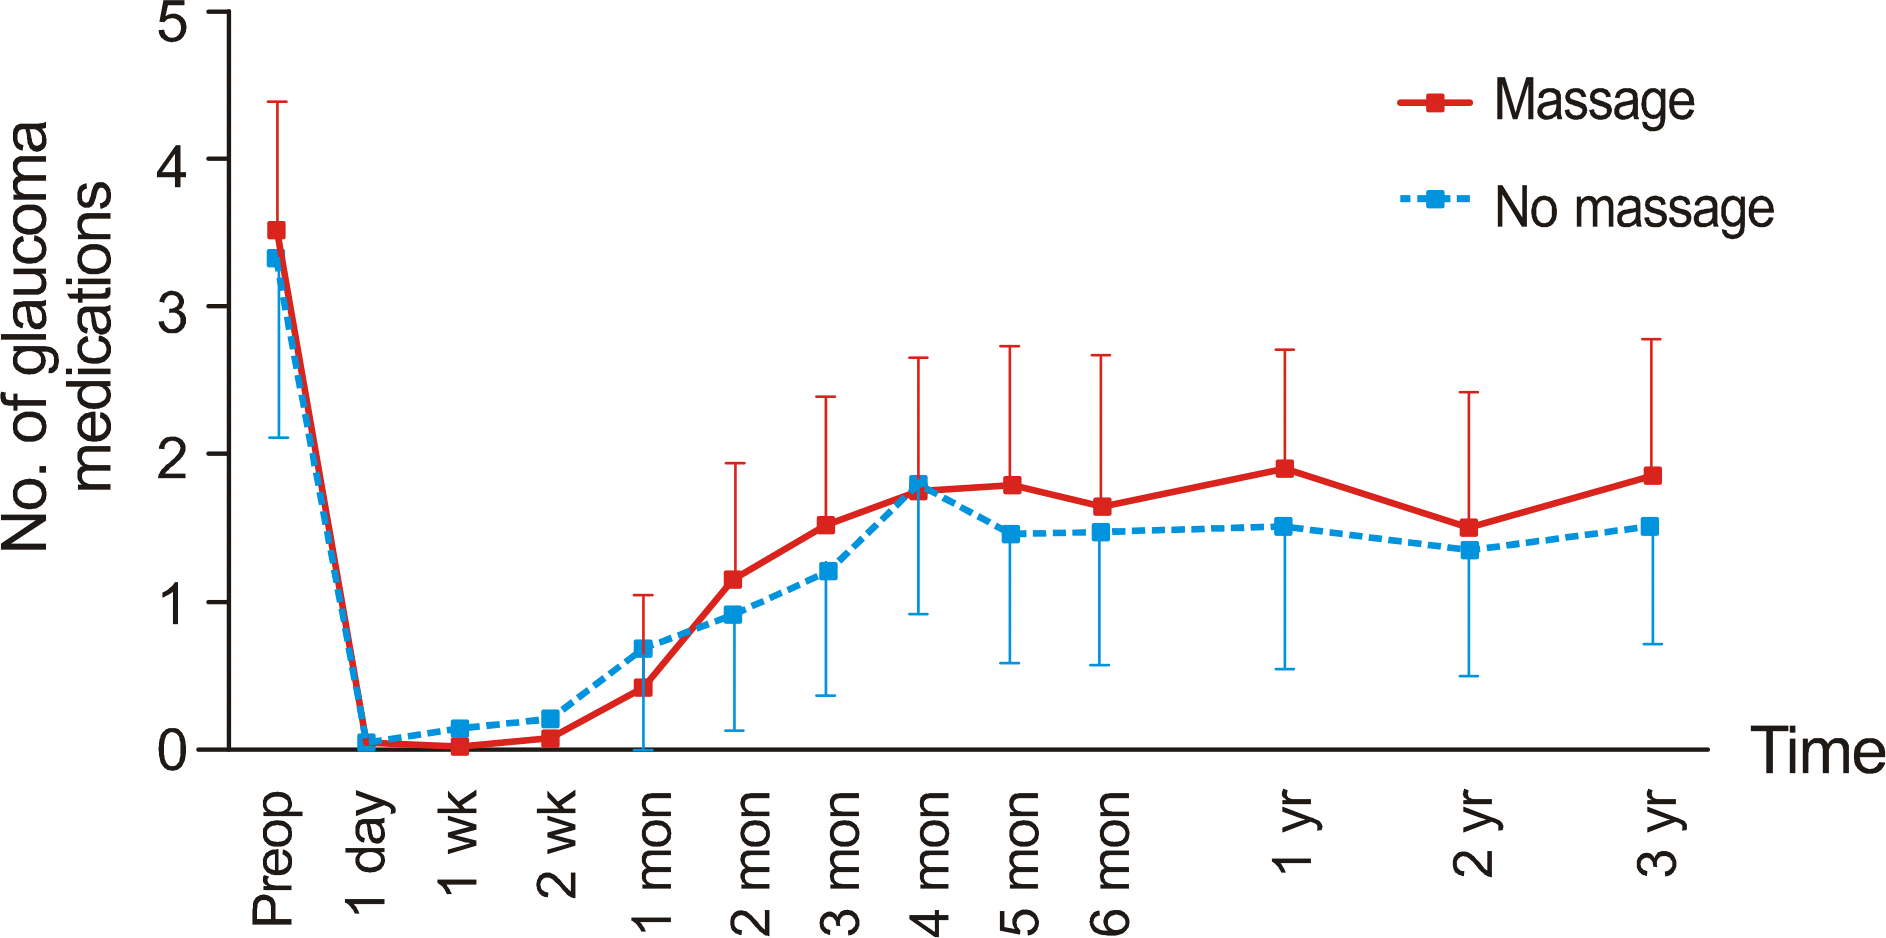
Figure 7.
The change in intraocular pressure from 1 month after surgery (reference IOP at the beginning of the ocular massage) in the groups with and without ocular massage. ∗ Significantly greater change in intraocular pressure in massage group (p < 0.05, independent T-test).
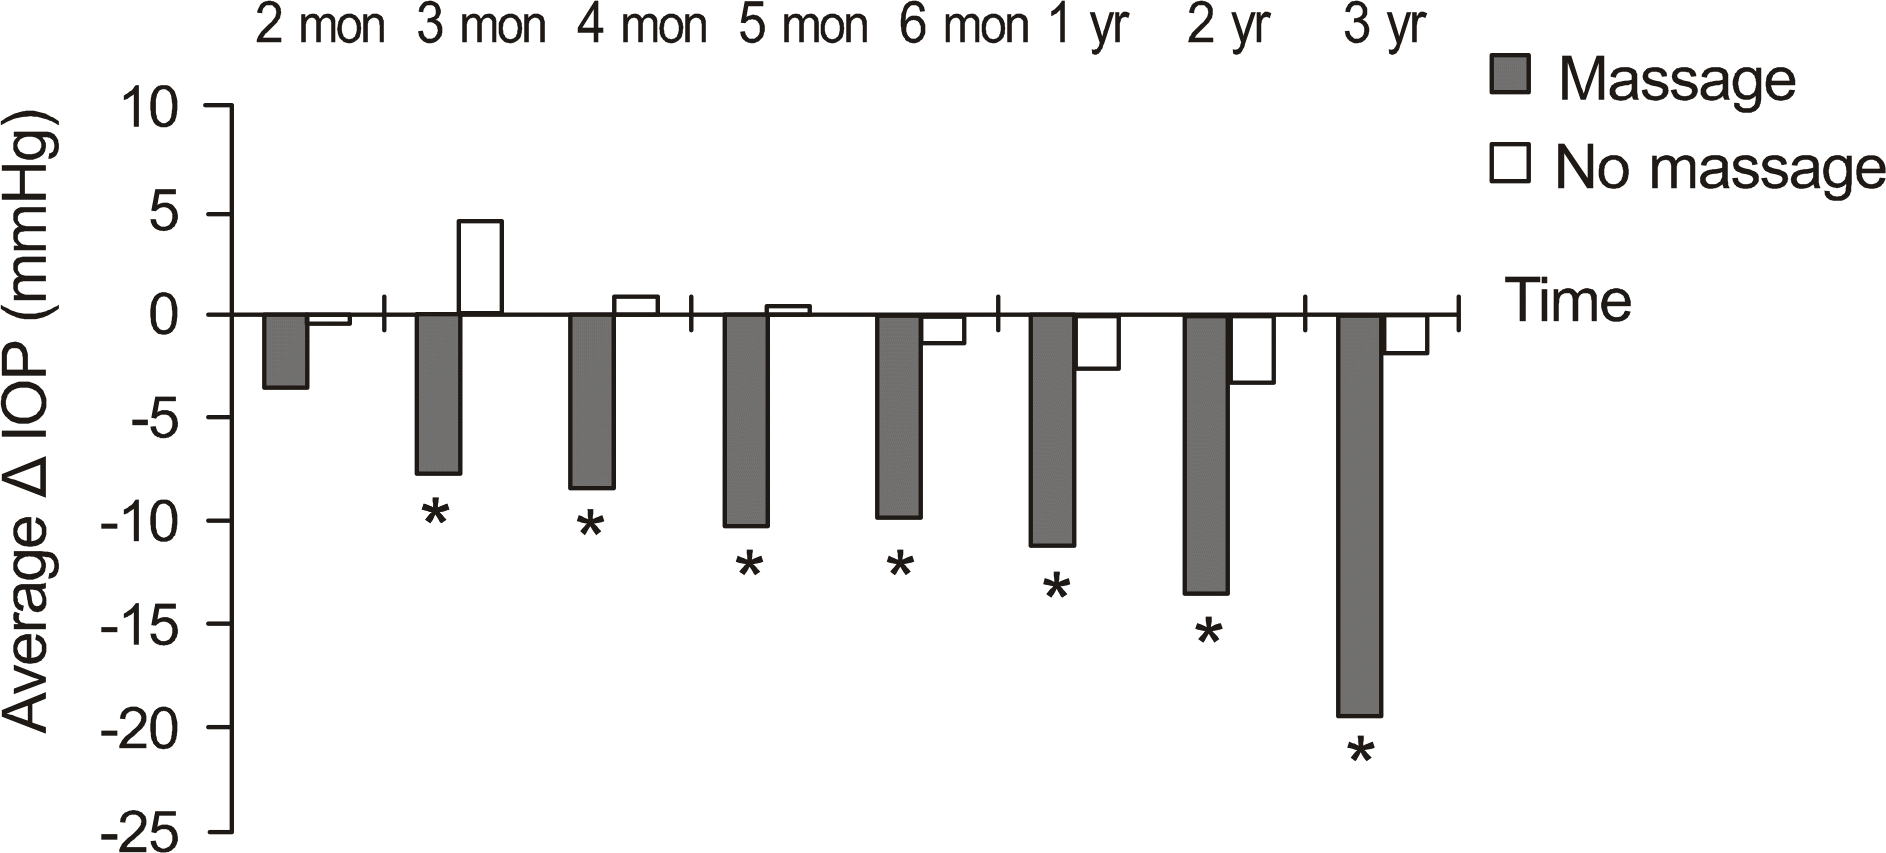
Table 1.
Baseline characteristics of subjects
Table 2.
Comparison of baseline characteristics of the subjects between the groups with and without hypertensive phase
| Variables | Hypertensive phase (n = 82) | No hypertensive phase (n = 49) | p-value |
|---|---|---|---|
| Age (mean ± SD, yr) | 54.4 ± 13.2 | 52.3 ± 17.1 | 0.448∗ |
| Sex (eyes, %) | 0.017† | ||
| Male | 65 (79.3) | 29 (59.2) | |
| Female | 17 (20.7) | 20 (40.8) | |
| Systemic disease (eyes, %) | |||
| Diabetes mellitus | 40 (48.8) | 12 (24.5) | 0.009† |
| Systemic hypertension | 25 (30.5) | 7 (14.3) | 0.057† |
| Glaucoma surgery history (eyes, %) | 15 (18.3) | 15 (30.6) | 0.133† |
| Duration of glaucoma (mean ± SD, yr) | 3.8 ± 5.7 | 2.5 ± 5.1 | 0.180∗ |
| Type of glaucoma | |||
| Neovascular glaucoma‡ | 47 (78.3) | 13 (22.7) | 0.001‡ |
| Secondary glaucoma | 21 (52.5) | 19 (47.5) | |
| Failed glaucoma surgery | 5 (35.7) | 9 (64.3) | |
| Primary open angle glaucoma | 9 (60.0) | 6 (40.0) | |
| Primary angle closure glaucoma | 0 (0.0) | 2 (100.0) | |
| Preoperative IOP (mean ± SD, mmHg) | 38.3 ± 14.4 | 31.4 ±12.1 | 0.006∗ |
| No. of glaucoma medication (mean ± SD) | 3.3 ± 1.1 | 3.4 ± 1.2 | 0.672∗ |
Table 3.
Results of logistic analysis on the variables of the development of hypertensive phase
| Variables | N |
Multivariate |
|
|---|---|---|---|
| Odds ratio (95% CI) | p-value | ||
| Sex | |||
| Female | 37 | 1.00 | |
| Male | 94 | 3.18 (1.35-7.49) | 0.008 |
| Diabetes mellitus | |||
| Non-DM | 79 | 1.00 | |
| DM patient | 52 | 1.92 (0.65-5.64) | 0.235 |
| Glaucoma | |||
| Others | 71 | 1.00 | |
| Neovascular glaucoma | 60 | 2.05 (0.69-6.11) | 0.195 |
| Preoperative IOP | 1.03 (1.00-1.06)∗ | 0.048 | |
Table 4.
Comparison of baseline characteristics of the subjects between massage group and no massage group
| Variables | Massge group (n = 30) | No massage group (n = 52) | p-value |
|---|---|---|---|
| Age (mean ± SD, yr) | 51.3 ± 12.8 | 56.1 ± 13.1 | 0.107∗ |
| Sex (eyes, %) | 0.580† | ||
| Male | 25 (83.3) | 40 (76.9) | |
| Female | 5 (16.7) | 12 (23.1) | |
| Systemic disease (eyes, %) | |||
| DM | 19 (63.3) | 32 (61.5) | 0.066† |
| Hypertension | 11 (36.7) | 14 (26.9) | 0.456† |
| Glaucoma surgery History (eyes, %) | 4 (13.3) | 11 (21.2) | 0.555† |
| Duration of glaucoma (mean ± SD, yr) | 2.6 ± 4.1 | 2.5 ± 5.6 | 0.953∗ |
| Preoperative IOP (mean ± SD, mmHg) | 37.2 ± 15.1 | 38.9 ± 14.1 | 0.607∗ |
| No. of glaucoma medication (mean ± SD) | 3.5 ± 0.9 | 3.3 ± 1.2 | 0.310∗ |
Table 5.
Comparison of baseline characteristics and final surgical outcome between successful massage group and massage failure group
| Variables | Massage success (n = 14) | Massage failure (n = 16) | p-value |
|---|---|---|---|
| Age (mean±SD, yr) | 52.3 ± 14.4 | 50.4 ± 11.7 | 0.692∗ |
| Sex (eyes, %) | 0.642† | ||
| Male | 11 (78.6) | 14 (87.5) | |
| Female | 3 (21.4) | 2 (12.5) | |
| Systemic disease (eyes, %) | |||
| DM | 9 (64.3) | 10 (62.5) | 1.000† |
| Hypertension | 5 (35.7) | 6 (37.5) | 0.707† |
| Glaucoma surgery history (eyes, %) | 0 (0.0%) | 2 (100%) | ‐ |
| Duration of glaucoma (mean ± SD, yr) | 3.6 ± 5.4 | 1.7 ± 2.3 | 0.207∗ |
| Preoperative IOP (mean ± SD, mmHg) | 34.1 ± 9.7 | 39.9 ± 18.5 | 0.297∗ |
| No. of glaucoma medication (mean ± SD) | 3.4 ± 1.1 | 3.6 ± 0.7 | 0.692∗ |
| Final outcome of operation (eyes,%) | 0.072‡ | ||
| Success | 11 (78.6%) | 7 (43.7%) | |
| Failure§ | 3 (22.4%) | 9 (56.3%) |


 PDF
PDF ePub
ePub Citation
 Print
Print


 XML Download