Abstract
Purpose
To investigate the fundus examination rate in diabetic patients and the public health factors associated with the fundus examination rate.
Methods
We analyzed the results of the third Korean National Health and Nutrition Examination Survey. We investigated the fundus examination rate in patients who had diabetes mellitus for more than 3 months during the previous year and determined the relationship of public health factors with the fundus examination rate.
Results
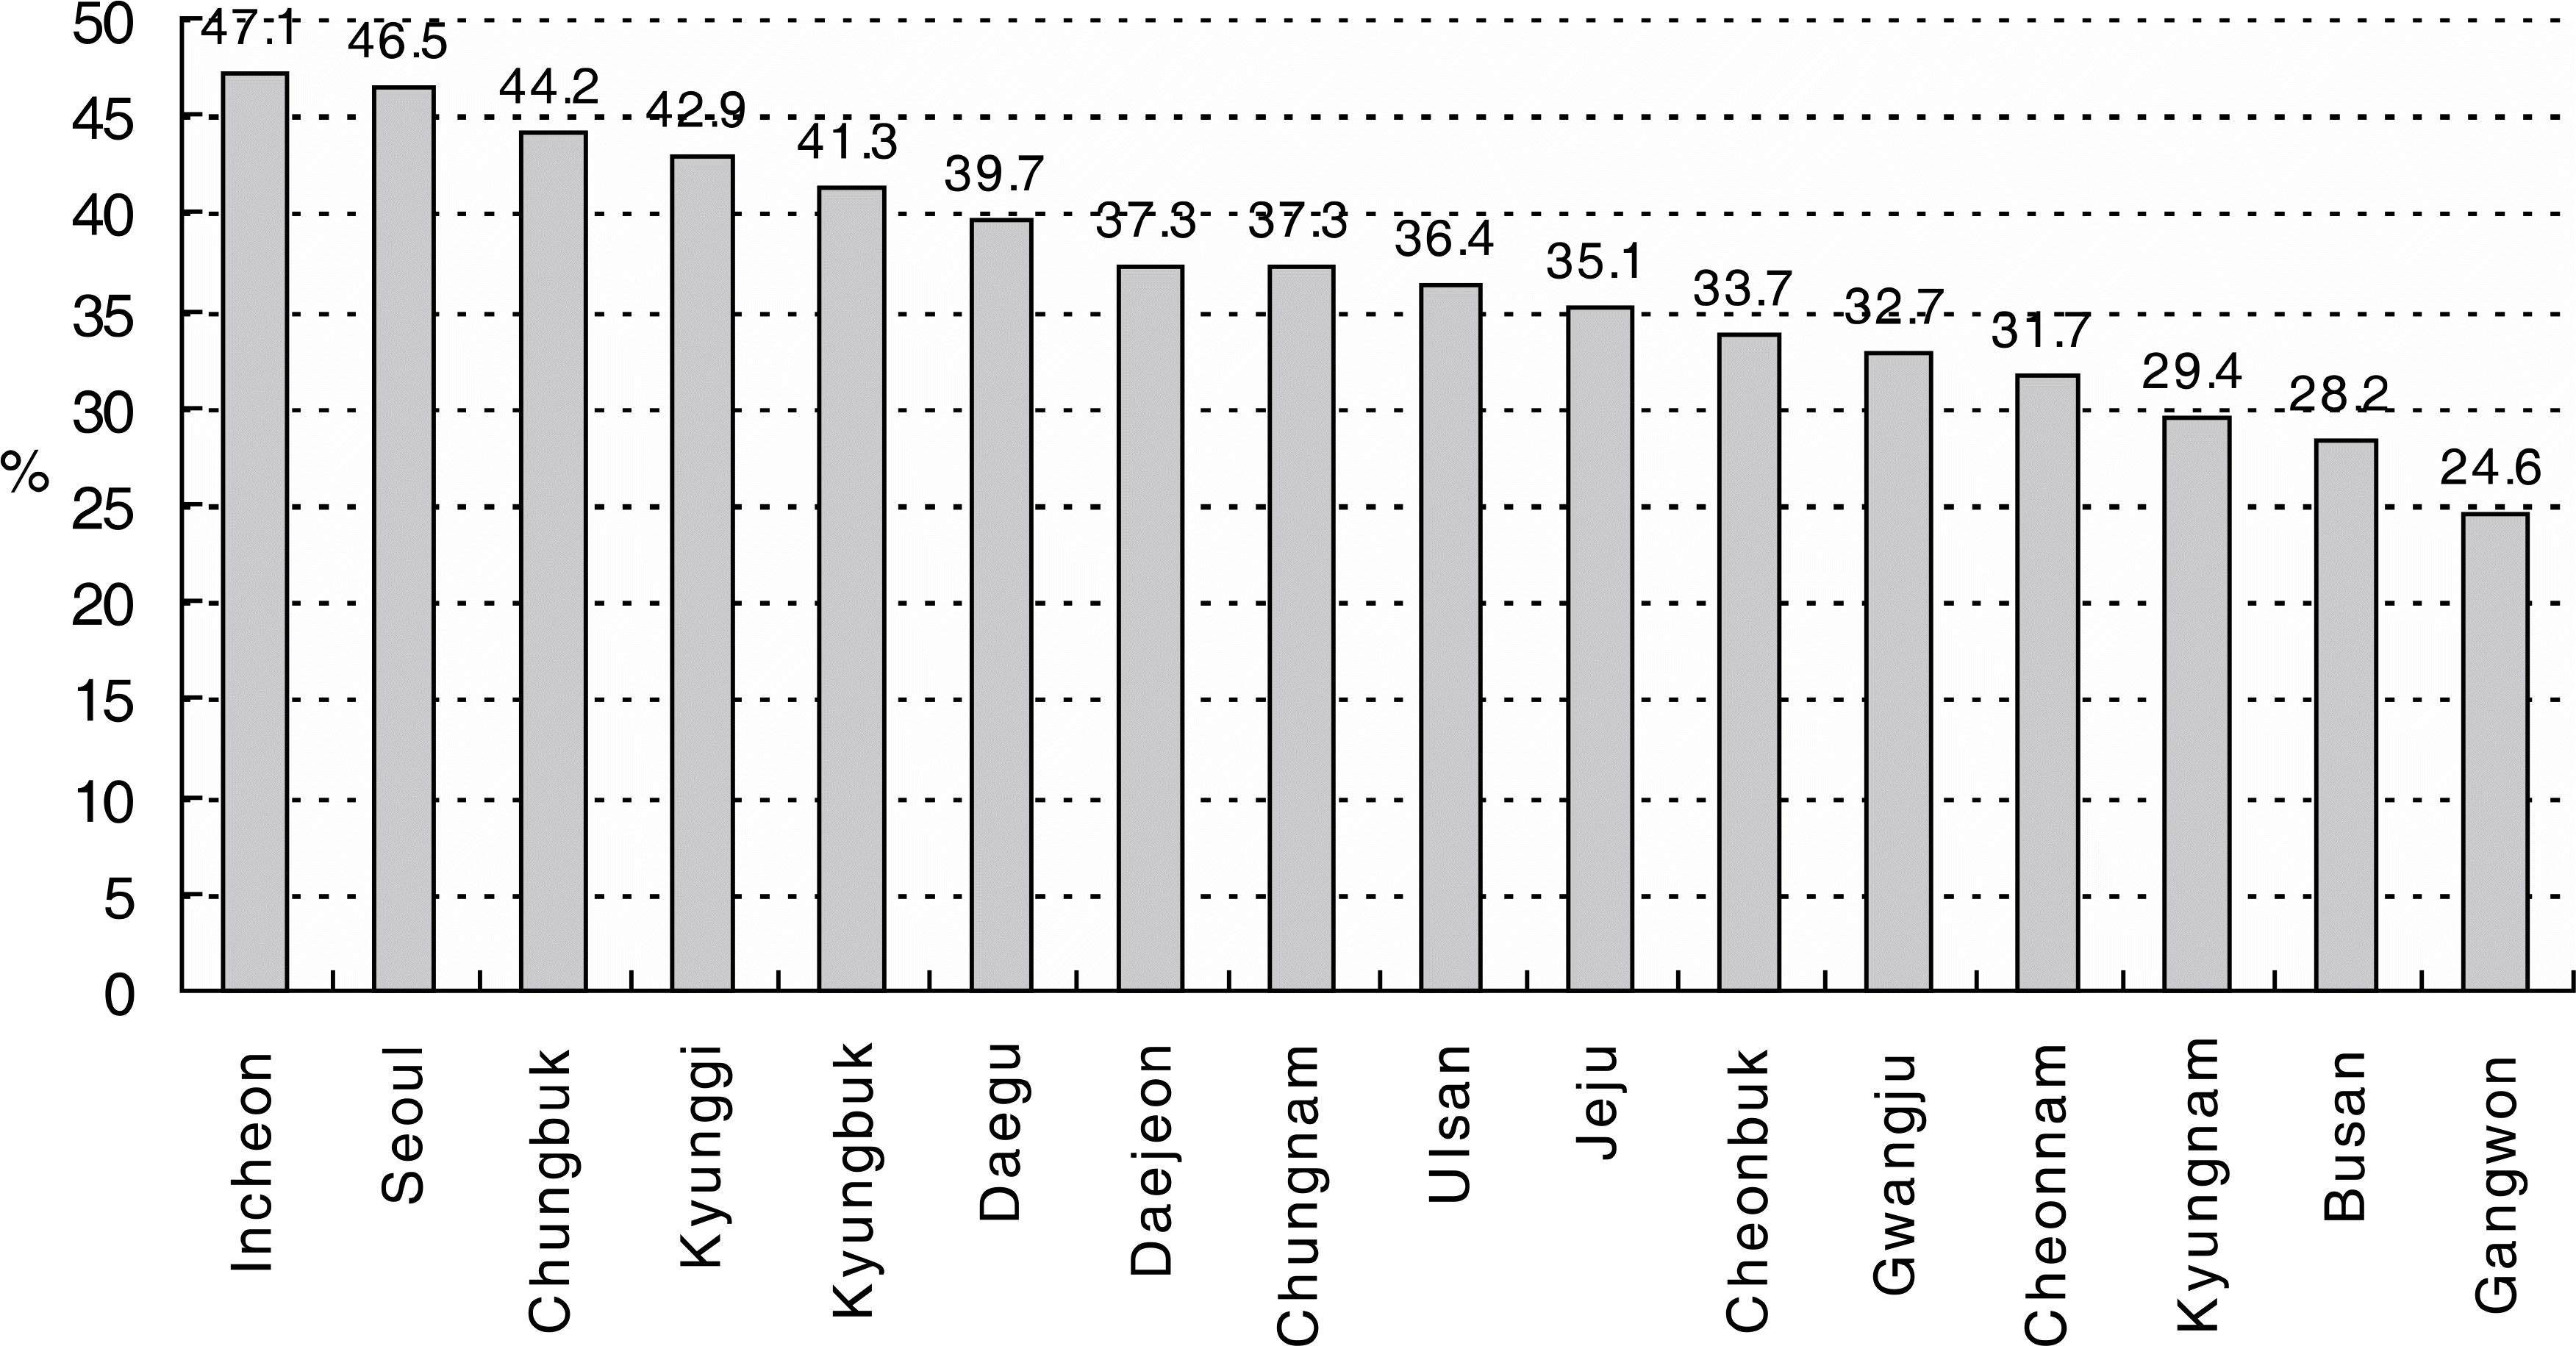
In all 547 patients (38.1%) received the fundus examination out of 1,437 total patients with diabetes mellitus. We found that many public health factors influenced the higher fundus examination rate, including patients who were residents in urban areas, women, office workers, university graduates, patients with a higher family income or more than 5 years duration of diabetes mellitus, patients with current insulin treatment, treatment of diabetes mellitus, education about diabetes mellitus, subjective visual problems or subjective health problems. However, age, marital status, health insurance and residential district did not influence the fundus examination rate.
Conclusions
The Korean National Health and Nutrition Examination Survey is the largest health survey in Korea. This study is meaningful as a population-based study, not a clinic-based cross-sectional study and it suggests the basic data for improving the fundus examination rate in diabetes mellitus patients.
References
1. Amos AF, McCarty DJ, Zimmet P. The rising global burden of diabetes and its complications: Estimates and projections to the year 2010. Diabetic Med. 1997; 14:S1–85.

2. American Diabetic Association. Diabetic Retinopathy. Diabetes Care. 2000; 23:S73–6.
3. Klein R, Klein BE, Moss SE. The Wisconsin Epidemiological Study of Diabetic Retinopathy: a review. Diabetic Metab Rev. 1989; 5:559–70.

4. Kwon HS, Kim KW, Kim DJ, et al. Diabetes mellitus epidemiologic study in Korea. 2005. Available at:. http://www.diabetes.or.kr.
5. American College of physicians, American Diabetes Association, American Academy of Ophthalmology. Screening guideline for diabetic retinopathy. Ann Intern Med. 1992; 116:683–5.
6. Early Treatment Diabetic Retinopathy Study Research Group. Early photocoagulation for diabetic retinopathy. Early Treatment Diabetic Retinopathy Study. Report Number 9. Ophthalmology. 1991; 98:766–85.
7. Zoega GM, Gunnarsdottir T, Bjornsdottir S, et al. Screening compliance and visual outcome in diabetes. Acta Ophthalmol Scand. 2005; 83:687–90.

8. Kim HK, Oh TS, Lee SM, Lee JB. The initial fundus examination and severity of diabetic retinopathy at a primary eye clinic. J Korean Ophthalmol Soc. 2005; 46:982–8.
9. Kim JS, Chin HS, Moon YS. A clinical analysis and referral rate on diabetic retinopathy in diabetic patients referred for eye examination at a tertiary hospital. J Korean Ophthalmol Soc. 2003; 44:1093–101.
10. Park MY, Ohn YH, Shin HH. Clinical analysis diabetic retinopathy for diabetics who were consulted from medical department. J Korean Ophthalmol Soc. 1994; 35:1068–72.
11. King H, Aubert RE, Herman WH. Global burden of diabetes, 1995-2025-Prevalence, numerical estimates, and projects. Diabetes Care. 1998; 21:1414–31.
12. Klein R, Klein BE, Moss SE, Linton KL. The Beaver dam eye study: Retinopathy in adults with newly discovered and previously diagnosed diabetes mellitus. Ophthalmology. 1992; 99:58–60.
13. Stolk RP, Vingerling JR, de Jong PT, et al. Retinopathy, glucose and insulin in an elderly population: the Rotterdam study. Diabetes. 1995; 44:11–5.

14. Mitchell P, Smith W, Wang JJ, Attebo K. Prevalence of diabetic retinopathy in an older community: the Blue Mountain Eye Study. Ophthalmology. 1998; 105:406–11.
15. Mitchell P, Moffitt P. Update and implications from the New-castle diabetic retinopathy study. Aust N Z J Ophthalmol. 1990; 18:13–7.

16. Narendran V, John RK, Raghuram A, et al. Diabetic retinopathy among self reported diabetics in southern India: a population based assessment. Br J Ophthalmol. 2002; 86:1014–8.

17. Nagi DK, Pettitt DJ, Bennett PH, et al. Diabetic Retinopathy assessed by fundus photography in pima indians with impaired glucose tolerance and NIDDM. Diabetic Med. 1997; 14:449–56.

18. American Academy of Ophthalmology Retina Panel. Preferred practice pattern guidelines. Diabetic Retinopathy. San Francisco, CA: American Academy of Ophthalmology;2008. Available at:. http://www.aao.org.
19. Dervan E, Lillis D, Flynn L, et al. Factors that influence the patient uptake of diabetic retinopahty screening. Ir J Med Sci. 2008; 177:303–8.
20. Jinaan BS, Donald SF, Janis Yao. Factors associated with followup eye examinations among persons with diabetes. Retina. 2008; 28:195–200.
21. Mukamel DB, Bresnick GH, Wang Q, Dickey CF. Barriers to compliance with screening guidelines for diabetic retinopathy. Ophthalmic Epidemiol. 1999; 6:61–72.

22. Moss SE, Klein R, Klein BE. Factors associated with having eye examinations in persons with diabetes. Ach Fam Med. 1995; 4:529–34.

23. Fred Ramsey, Ann Ussery-Hall, Danyael Garcia, et al. Prevalence of selected risk behaviors and chronic diseases - Behavioral Risk Factor Surveillance System (BRFSS), 39 Steps Communities, United States, 2005. MMWR Surveill Summ. 2008; 57:1–20.
24. Jin JH, Lee SJ, Lee HS, Kim SD. Prognostic factors of visual acuity in diabetes mellitus. J Korean Ophthalmol Soc. 2006; 47:755–62.
Table 1.
Fundus examination rate classified by major public health factors
Table 2.
The odd ratio of the fundus examination rate classified by the significant public health factors
| Odd Ratio | 95% CI | p value | ||
|---|---|---|---|---|
| Sex | Female / Male | 1.922 | 1.034∼3.572 | 0.039∗ |
| Educational status | Middle school / Elementary | 1.371 | 0.850∼2.210 | 0.195 |
| High school / Elementary | 1.427 | 0.910∼2.236 | 0.121 | |
| University / Elementary | 2.252 | 1.290∼3.931 | 0.004∗ | |
| Treatment of DM | Do / Do not | 5.986 | 3.705∼9.671 | 0.000∗ |
| Education for DM | Do / Do not | 2.351 | 1.656∼3.338 | 0.000∗ |
| Subjective visual | A little / No | 1.558 | 1.090∼2.226 | 0.015∗ |
| disturbance | Much / No | 2.380 | 1.361∼4.161 | 0.002∗ |


 PDF
PDF ePub
ePub Citation
 Print
Print


 XML Download