

 PDF
PDF ePub
ePub Citation
 Print
Print


INTRODUCTION
Patients with pancreatic carcinoma are characterized by a high frequency of malnutrition-related symptoms such as weight loss and diarrhea. Various screening tools such as Malnutrition Universal Screening Tool (MUST) and nutritional risk index (NRI) have been developed to identify risk of malnutrition of patients [1].
Pancreaticoduodenectomy (PD) has become a commonly used surgery method to treat both of malignant and benign tumors within the pancreas, duodenum and biliary tract [2]. The postoperative death rate after PD has decreased from 1%–2% to 5% in many tertiary care centers [345]. However, 45%–50% of patients’ experience complications such as delayed gastric emptying and postoperative pancreatic fistula [67]. Patients received PD are usually malnourished. It has been reported that 52%–88% of postoperative patients were at medium-high risk of malnutrition [8]. Recent studies revealed that PD had a significant effect on nutritional index, pancreatic function, and quality of life (QoL). Park et al. [9] reported that relative body weight (RBW) and triceps skinfold thickness (TSFT) had significantly decreased after the surgery and recovered to more than 90% of the preoperative value by 12 months whereas transferrin, albumin (Alb) and protein had returned to preoperative levels by 3 months. Muniz et al. [10] reported higher levels of glycemia, alkaline phosphatase, and C-reactive protein (CRP) among the PD group in comparison with control group.
Dietary intake after PD is usually suboptimal and poor and this can aggravate nutritional status of the patients. Kim [11] reported that energy intake via oral and intravenous injection approximates to 1,050 kcal/day in a group with postoperative PD patients. Enhanced recovery after surgery study also reported that adherence to postoperative targets was inappropriate: 55% for oral liquids and solid 53% for food [12]. And this study shows that low compliance to regimen was closely related to the severity of postoperative complications [12].
The purpose of this study was to evaluate postoperative dietary intake and nutritional status among patients who received PD. This study will add basic information on dietary intake and nutritional status for PD patients and provide valuable information for establishing regimen for PD patients.
MATERIALS AND METHODS
Subjects
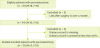
From December 2014 to June 2015, 37 patients (18 men and 19 women) who received pylorus preserving pancreaticoduodenectomy (PPPD) and distal pancreatectomy (DP) at Gangnam Severance Hospital were recruited as participants for the current study. Informed consent was obtained from all subjects. Three patients were excluded from the study because they answered less than 50% of their dietary intake record forms. Another 3 patients were excluded because of hospitalization due to severe complications. Finally, total of thirty-one subjects (15 men and 16 women) were included in this study (Figure 1). The study protocol was approved by Institutional Review Board of Gangnam Severance Hospital (No. 3-2015-0005).
General characteristics
The patients’ demographic data including age, sex, and medical history were collected at admission. One day before the surgery, anthropometric measurements, routine blood tests and evaluation of nutritional status were performed for all patients. During first 2–3 postoperative days (POD), most patients were advised to fast or drink small amount of water. From POD 2–3 to POD 5–6, liquid diet was provided through jejunostomy tube during operation. From POD 5–7, liquid diet was administered orally and records of patients’ dietary intake were commenced. From POD 6–7 to POD 12–13, soft diet was given to the patients. Nutritional status was assessed 1 day prior to discharge from the hospital. Body weight measurement and blood test were performed daily during hospitalization period (Figure 2).

Anthropometric and medical data
Body mass index (BMI) was calculated from body weight and height measurements of the subjects. The cut-off point for normal BMI was 23 kg/m2, according to the guideline of Korean society for the study of obesity. Blood test results including hemoglobin (Hb), total protein (TP), Alb, cholesterol (Chol), CRP, white blood cell (WBC), neutrophil and lymphocyte were obtained from electronic medical record.
Dietary intake data
The amount of dietary intake was self-recorded using dietary record form. The dietary intake was recorded for every meal and these records were examined by research dietitian. The amount of dietary intake was defined as the proportion (%) of the actual food intake in comparison with the food provided. The patients were asked to start dietary record from the day of first oral liquid diet until the leaving the hospital. Research dietitian interviewed the subjects 2–3 times per week for the evaluation of nutrition impact symptoms. Daily intakes of foods and nutrients were analyzed using Can-pro 4.0 (Korean Nutrition Society, Seoul, Korea).
Assessment of nutritional status
Nutritional status of the subjects was evaluated based on their pre-and post-operative body weight, BMI, NRI, and MUST. The postoperative evaluation was performed on discharge. The NRI and MUST are the most commonly used screening tools for the evaluation of nutritional status. The MUST is reported to be more sensitive for patients received PD [8].
Statistical analyses
Results are expressed as median (min–max). To compare nutrients intake by BMI level, Mann-Whitney test was used. A Wilcoxon signed-ranks test was performed to evaluate the changes in body weight and BMI after surgery. To study the changes in nutritional status, McNemar’s test was performed using data from NRI and MUST. Spearman correlation coefficients were calculated to test the relationship between dietary intake and nutritional status. If p value < 0.05, the difference was considered significant. Statistical analyses were performed using IBM SPSS Statistics 23 (IBM, New York, NY, USA).
RESULTS
General characteristics
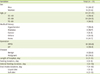
The general characteristics of the study participants are shown in Table 1. The median age of subjects was 60. Of the 31 subjects, 20 were aged range 50–69 years, 6 were aged range 30–49 and 5 were aged range 70–89. Twenty-five patients (80.6%) underwent PPPD and 6 patients (19.4%) had DP. Eight subjects were diagnosed with benign tumor and 23 subjects were diagnosed with malignant tumor. Median length of hospitalization, fasting times (nothing by mouth and sips of water), and enteral feeding duration were 12, 2, and 3 days, respectively. Median value of oral intake duration was 7 days. During that period subjects were on liquid diet for 1 day and on soft diet for 6 days, on the average. These results were in accordance with scheduled meals prescription.
Table 1
General characteristics of the study subjects*
Nutritional status
Pre- and post-operative variables on nutritional status such as body weight, BMI, NRI, and MUST are presented in Table 2. The average body weight of subjects showed modest level but significant decrease from 60.1 kg to 60.7 kg on leaving the hospital after the surgery. Also BMI has decreased from 22 to 22.9 kg/m2. Before the operation, 17 subjects (54.8%) were classified as ‘No nutritional risk group’ according to NRI, but only 4 subjects (12.9%) were left in the category after the operation. On the contrary, number of subjects in the ‘Moderate/Severe risk group’ has increased from 10 (32.2%) to 26 (83.8%, p = 0.002). According to MUST classification, 22 subjects (70.9%) were in the ‘Low risk group’ before the surgery. However, after the surgery, only 4 subjects (13.3%) were in the same category. Seven subjects (22.5%) were in the ‘High risk group’ before the operation, but this number has increased to 24 (77.4%, p < 0.001).
Table 2
Comparison of nutritional status among the subjects before and after surgery*

Changes in clinical indices of the patients after surgery are shown in Table 3. The CRP level has significantly increased after the operation (p = 0.001). Levels of Hb, TP, Alb, and Chol were significantly lower in postoperative state. Levels of WBC, neutrophil, and lymphocyte did not change according to surgery status.
Table 3
Comparison of clinical data between before and after surgery (n = 31)*

Dietary intake
1) Nutrients intakes
Nutrient intakes were analyzed based on the diet record form completed from the first oral liquid diet to the day of discharge. Median value of energy intake was 588.1 kcal. Median intakes of carbohydrate, fat and protein were 96.0, 11.8, and 27.0 g, respectively (Table 4). Subjects in the overweight or obese category (≥ BMI 23 kg/m2) consumed more energy from their diet, however the difference was not statistically significant. We conducted additional analysis according to the operation of subjects including both PPPD and DP, but there were no significant results.
Table 4
Dietary nutrient intakes of the subjects by BMI after surgery*
2) Changes in postoperative oral dietary intake during hospitalization
Changes in energy and protein intakes after the first oral intake are shown in Table 5. On average, the subjects proceeded to oral intake by POD 5. During the following 7 days, oral dietary intake increased, whereas parenteral nutrition (PN) drastically decreased. On the day of first oral intake, the median energy intake was 554.9 kcal and increased to 632.2 kcal on the third day. On the contrary, energy intake from PN was 1,082.2 kcal on the first day of oral intake and it decreased to 300.6 kcal on the third day. On the seventh day, it was only 19.5 kcal. Similar trends were observed in the protein intake. Protein intake from oral intake was 13.9 g on the first day and increased to 30.5 g on the third day. Protein supplied from PN was 48.7 g and decreased to 16.7 g on the third day.
Table 5
Daily consumption of total calorie and protein through parenteral and oral intakes among study subjects*

Nutrition impact symptoms
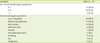
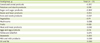
Postoperative nutrition impact symptoms were routinely assessed by research dietitian, interviewing the subjects (Table 6). Majority of the patients (n = 20, 64.5%) reported multiple symptoms. Eleven patients (35.4%) have 1 or less symptoms. Meanwhile, four patients (12.9%) showed 5 or more symptoms. The most frequent symptom was loss of appetite (n = 12, 38.7%), followed by abdominal distention and early satiety.
Table 6
Nutritional impact symptoms of study subjects after operation*
Association between dietary intake and other parameters
1) Association between dietary intake and changes in nutritional status
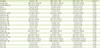
Spearman correlation coefficients were calculated to determine association between clinical indices and nutrient intake including enteral nutrition (EN) and PN (Table 7). Changes in body weight, BMI, Alb, CRP, Hb, TP, Chol, WBC, neutrophil, and lymphocyte were calculated using followed formula:
Table 7
Correlation coefficients of dietary intake and nutritional statement (n = 31)

Postoperative value / Preoperative value × 100
Our results showed that changes in CRP level were negatively associated with intakes of protein, fat and zinc. Change in WBC level was inversely correlated with all nutrients, except for sodium and potassium. Neutrophil change showed negative association with all nutrient intakes except for carbohydrate and potassium. Change in lymphocyte level was inversely associated with carbohydrate intake.
2) Association between dietary food groups and number of nutrition impact symptoms
Association between dietary food group and number of nutrition related symptoms is shown in Table 8. Subjects reported lower number of nutrition related symptoms when they consumed food items involved in cereal or sugar groups.
Table 8
Correlation coefficients of dietary food group intakes and number of nutrition impact symptoms (n = 31)
DISCUSSION
Diet therapy for postgastrectomy patients has been well established regarding amount and composition of diet according to the type of surgery and postoperative stages. However previous reports of regimen for PD have been scarce. This lack of proper regimen has made it difficult to maintain optimal dietary intake and, subsequently, nourishment of PD patients. So we aimed to collect basic information on dietary intake and nutritional status of PD patients and provide valuable information for establishing regimen for PD patients. In this study, perioperative data were prospectively collected form all study subjects, and the patients’ postoperative dietary intakes were recorded for all meals until being discharged from the hospital. And postoperative nutritional status at the discharge was compared to preoperative condition among each patient.
This study showed that body weight and BMI of the patients significantly decreased after PD despite of relatively short length of hospitalization period (median = 12 days, range = 4–18 days). Evaluation of NRI and MUST also showed that number of patients who involved in ‘Moderate/Severe risk group’ has dramatically increased. These results suggest that PD surgery has deleterious effect on nutritional status of the pancreatic cancer surgical patients. The previous literature reported a significant decrease in BMI after PD surgery. In addition, there was a significant difference in BMI between baseline and 3 months after surgery. Similar trends were observed in mid-arm circumference, triceps skin fold thickness and hand-grip [13]. Others reported that 90% of the patients who had PD surgery recovered their preoperative body weight by 12 months, whereas 60%–85% of the patients recovered their weight by 6 months [101415]. Previous studies stated that malnutrition and weight loss in PD group significantly affect QoL [16].
Our results showed that CRP level has significantly elevated after surgery (p < 0.05). Meanwhile the levels of Hb, TP, Alb, and Chol were decreased (p < 0.001). The results prove that pancreatic surgery aggravates malnutrition. Fujii et al. [17] evaluated total lymphocyte count (TLC) and serum levels of Alb, transferrin, and retinol-binding protein at the preoperative day and on POD 5, 12, and 21. And they found that all parameters were lowest at POD 5 [17]. Kim [11] also observed significant differences in levels of prealbumin, CRP, and TLC between 1 day before and 3 and 7 days after PD surgery. Park et al. [9] showed that serum transferrin, Alb and TP levels were the lowest at the day of leaving hospital after pancreatobiliary surgery. Similar trend was observed in the serum Chol level in a group of PPPD and DP patients [18].
The median oral energy intake of patients in this study was 588.1 kcal which was very low when compared to dietary reference intake. Our results highlight the suboptimal dietary intake of PD patients and emphasize the urgent need for improvement of regimen for PD patients.
Our results showed that changes in inflammatory markers were negatively associated with intakes of some nutrients. For example, change in CRP was inversely related with intakes of protein, fat and zinc. Changes in WBC and neutrophil were negatively correlated with almost all nutrients. Lymphocyte change was inversely associated with carbohydrate intake. These results show that nutrient intake has significant effect on immune functions among pancreatic surgical patients.
McMillan [20] reported that a chronic systemic inflammatory response is associated with weight loss, especially lean body mass, and in the progressive functional decline in the cancer patients. Akizuki et al. [21] reported that postoperative intraabdominal infection was significantly associated with lower total amount of dietary intake in a group of PD patients. Information on relationship between postoperative dietary intake and nutritional status in Korean PD patients is rare, however, there are few reports showed that poor dietary intake after postgastrectomy surgery was related to severe weight loss [22].
In this study, median value of energy intake was 588.1 kcal. Median intakes of carbohydrate, fat and protein were 96.0, 11.8, and 27.0 g, respectively. These values are quite low comparing to values from other studies. Kim [11] reported that the average energy intake by POD 3 from PN and oral intake was 1,050 kcal/day after PD surgery. Hwang et al. [23] studied the effect of early postoperative enteral nutrition on postoperative outcomes and reported that the mean of daily calorie and protein intake in the early oral feeding group (847.0 kcal and 42.4 g, respectively) were significantly higher than those in the traditional oral feeding group. One study on dietary intake after DP surgery reported that averages of energy intake were 579, 813, 1,060 kcal for 7, 10, and 14 days after the surgery, respectively [17].
The most frequently observed nutrition related symptom in our study was loss of appetite, followed by abdominal distention and early satiety. Others were abdomen pain, nausea, diarrhea/loose stool, vomiting, gas and indigestion. The revised regimen for PD patients should address these problems to increase postoperative dietary intake and improve nutritional status of patients. Other studies also observed various complications after PD surgery. Lee et al. [18] reported that abdominal distention, brash, burp, abdominal pain and steatorrhea were commonly observed in patients after PD. Meanwhile Choi et al. [19] reported that the most frequently observed complication after PD was, followed by flatus (76.3%), borborygmus (52.5%), and urgency (46.7%). Warren et al. [24] stated that postoperative nausea and loss of appetite is common symptoms among PD patients, occurring in 25%–30% of patients.
In summary, this study provides detailed nutritional and anthropometric information of patients who had PD. Future studies should be performed with larger number of subjects, longer-term follow-up period and further measures of QoL.
CONCLUSION
In conclusion, this study showed that postoperative values of body weight, BMI, NRI, and MUST were lower than preoperative values in PD patients. These results imply that PD surgery aggravates malnutrition status of patients. Oral dietary intake of the patients was poor and did not improve during hospitalization period. Total nutrient supplied from oral intake, EN, and PN was inversely associated with inflammatory indices such as CRP, WBC, neutrophil, and lymphocyte. Most patients had symptoms such as loss of appetite, flatulence, and early satiety. And these symptoms seemed to diminish when patients were provided with cereals or sugar products. This study points the urgent need for the development of meal prescriptions, satisfying the demands of PD patients.
 XML Download