

 PDF
PDF ePub
ePub Citation
 Print
Print


INTRODUCTION
Conventional bone-to-implant contact (BIC) measurements based on 2-dimensional (2D) histology have been widely used; however, this method is time-consuming, and bias can be present with regard to measurements performed by different individuals [1234]. Moreover, 2D histology may not allow the whole picture of the BIC to be obtained, and consequently, a direct 3D analytical approach is necessary [5]. However, previous publications have not provided a detailed algorithm for analyzing BIC with 3D micro-computed tomography (CT), and furthermore, have not clearly presented the entire scanned images; instead, only mean values have generally been calculated from 2D aspects assessed based on intermittent slices obtained by micro-CT [13467]. In 360° round scanning, even after long hours of acquisition, screw-shaped titanium (Ti) metal alloy implants may present artifacts such as halo, shadow, and blurring effects caused by the composition of the material (which has a high atomic number), the sharp-edged or perpendicular shape of the implant, and projection images from a fixed single optical axis. Therefore, a good image may not be obtained because of artifacts that make it difficult to differentiate bone from implant [8910]. Acquiring accurate BIC data may therefore be difficult, and an accurate but simpler and faster way to measure BIC on 3D micro-CT is desirable.
After much contemplation and searching for ways to solve this problem, we believe spiral scanning to be the solution to the problem of screw-shaped implants hindering measurements of BIC on 3D micro-CT. In addition, we developed a robust algorithm that can be applied to the measurement of BIC for Ti dental implants. Both round and spiral scanning can involve rotation through 360°, but in contrast to round scanning, spiral scanning also involves moving the sample through the direction of the length while it is rotating, whereas in round scanning, the object does not move through the scanner during rotation. In round scanning, an object that lies in the optical axis has no magnification, while as objects are positioned away from the axis they become magnified; therefore, every image slice scanned is subject to optical distortion and/or artifacts. However, spiral scanning prevents such distortions, and allows high-quality images to be obtained, which consequently enables the clear differentiation of soft tissue, bone, and implant. In the Bruker Academy method note, the partial volume effect (PVE) is not specifically dealt with, but instead ‘all artifacts’ are mentioned ambiguously. Therefore, clarification of the term ‘metal artifact’ is necessary.
The purpose of this study was therefore to present a method for BIC assessment through spiral scanning using an advanced algorithm, a method particularly suited to analysis of screw-shaped implants. The procedure allows BIC measurements to be made from continuous scanning, rather than from intermittent image slices, and allows results to be obtained in less than 1 hour.
MATERIALS AND METHODS
Specimen preparation, surface modification, and surface characteristics
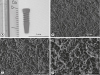
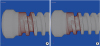
Five Ti implants (grade 4 commercially pure Ti, diameter: 3.0 mm, length: 12 mm) were prepared; 3 were used for surface topography and 2 for in vivo surgery. A straight form with square macrothreads was designed from the top of the implant to the middle, while a tapered form with V-shaped microthreads was designed from the middle to the bottom for bone anchorage (Figure 1A). The implant surface was modified by sandblasting with large alumina (Al2O3) grit and etching with hydrochloric acid solution (SLA surface, Deep Implant Systems, Seongnam, Korea). The surface topographical features (Figure 1B-D) were observed under field emission scanning electron microscopy (S-4700, Hitachi, Tokyo, Japan).
Figure 1
Design and surface characteristics of the specimen. (A) The design of the implant used in this study is shown. (B-D) These field emission scanning electron microscope images show the typical features of sandblasted, large-grit, acid-etched implant surfaces, which are rough with a honeycomb texture. The bars in (A-C), and (D) indicate lengths of 1.0 mm, 50.0 μm, 20.0 μm, and 10.0 μm, respectively.
In vivo surgery
This study was approved by the institutional animal research ethics committee of Cronex Co., Ltd., Hwaseong, Korea (CRONEX-IACUC: 201807001), and followed the ARRIVE guidelines for reporting of in vivo animal experiments [11]. One New Zealand white rabbit (age: 1–2 years; body weight: 2.7 kg) with no signs of disease was used. The rabbit was anesthetized via an intramuscular injection of tiletamine/zolazepam (15 mg/kg; Zoletil 50, Virbac Korea Co. Ltd., Seoul, Korea) and xylazine (5 mg/kg; Rompun, Bayer Korea Ltd., Seoul, Korea). Before surgery, the skin over the area of the proximal tibia was shaved and washed with betadine, and an antibiotic (Cefazolin, Yuhan Co., Seoul, Korea) was administered intramuscularly. Lidocaine was injected locally into each surgical site. The tibiae were exposed after muscle dissection and periosteal elevation following skin incision. Drilling with profuse sterile saline irrigation for preparation of implant sites was performed on flat tibial surfaces. Drilling was performed bicortically, with final diameters of 3 mm in the upper cortical bone to prevent physical involvement, including friction, and 1.5 mm in the lower cortical bone for stability. The rabbit received 2 implants (1 on each tibia). Resorbable 4-0 Vicryl sutures were used to suture the muscle and fascia, and the outer dermis was closed with a nylon suture. The rabbit was housed separately after surgery, and was anesthetized and sacrificed via an intravenous overdose of potassium chloride after 28 days of bone healing. The tibiae were exposed, and the implants were surgically removed en bloc with an adjacent bone collar, and were immediately fixed in 10% neutral formaldehyde.
BIC assessment
Micro-CT scanning and artifact removal
A specimen was selected for micro-CT scanning. SkyScan 1172 and SkyScan 1275 (Bruker microCT, Kontich, Belgium) micro-CT scanners were used for all X-ray imaging. Scanning parameters included an acceleration voltage of 100 kV and a pixel size of 9.85 µm on the SkyScan 1172 and 10 µm on the SkyScan 1275. Each sample was scanned 3 times, using 360° round scanning on the SkyScan 1172 and 1275 and spiral scanning on the SkyScan 1275. The scan time was 12 hours for the SkyScan 1172 and 2 hours for the SkyScan 1275 in both scanning techniques. To minimize metal artifacts, the Bruker Academy method note recommends using high voltage, high filtering, a small rotation step, a high frame averaging value, and 360° scanning. However, the term ‘metal artifact’ is not appropriate for biodegradable materials such as collagen, which exhibit similar kinds of artifacts to metals (i.e., shadow, halo, and blur artifacts). Therefore, rather than referring to ‘metal artifacts,’ we used the term ‘optical artifacts’ in this study. Metal artifacts have also been referred to as ‘cone-beam artifacts’ because the artifacts become severe as the image gets further from the optical axis [8]. A shadow artifact is a region darker than neighboring pixels that may be erroneously classified as void. A halo artifact is a region brighter than neighboring pixels that infiltrates a region that should be signal void in the thresholding process, and may be falsely identified as real material. A blur artifact is a region not much brighter or darker than neighboring pixels, but for which it is difficult to determine whether it is halo or shadow. This latter artifact is mostly false bone or false void; however, spiral scanning clearly separates blur into bone and void.
Reconstruction and PVE optimization
Reconstruction was performed using NRecon (v. 1.7.3.2, Bruker microCT). In this procedure, the contrast limit for the attenuation coefficient histogram is the most important parameter for optimizing the PVE (Figure 2); if the maximum value increases, the number of pixels involved in the PVE increases (Figures 3 and 4). A large region of pixels showing the PVE hampers the BIC measurement accuracy, and therefore the PVE should be optimized as much as possible.
Figure 2
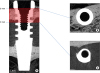
Contrast limit designation of the attenuation histogram. The left red line is the lower boundary, and the attenuation value of this line is set to 0. The right red line is the upper boundary, and the attenuation value of this line is set to 255. Each peak represents a dominant material in the histogram (a: air, b: soft tissue, c: bone, e: implant, d: partial volume effect). The placement of peaks is determined by the atomic number.
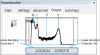
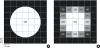
Figure 3
Sampling in the image process and partial volume averaging. Each voxel is assigned the mean gray value of its components, and the boundary pixels, which the object only partially occupies, do not have the same values as the circle or void, but instead have unique values. In (A), the real object area is πr2=1,962.5 µm2. In (B), with the thresholding limited to 255, the object area is 900 µm2. With thresholding ranges of 230–255, 200–255, and 40–255, the area becomes 1,300, 2,100, and 2,500 µm2, respectively. The values are approximated here.
Analysis and visualization overview
The analysis was performed in CTAn software (v. 1.18.4.0, Bruker microCT), and involved the visualization software DataViewer (v. 1.5.4.0, Bruker microCT) and CTVox (v. 3.3.0, Bruker microCT). The analysis height was designated as the point in the upper cortical region where the implant entirely interfaces with bone to the point where the implant is no longer in contact with the bone interface (Figure 5).
Figure 5
Height of interest. (A) The volume of interest height is designated by the red box. (B) The height begins from the point where the implant entirely interfaces with the bone. (C) The height ends where the implant no longer interfaces with bone.
BIC was analyzed on data from round and spiral scanning performed on the SkyScan 1275. The results from the SkyScan 1172 were not assessed, as they did not correlate with the results of the SkyScan 1275 because of different pixel sizes. Nonetheless, the images from the SkyScan 1172 appeared very similar to those obtained using round scanning on the SkyScan 1275.
Conventional BIC measurement
The Bruker Academy method note proposes a method for conventional BIC measurement. Before measuring the BIC, the implant and bone require segmentation, with both the implant and bone selected by thresholding in the binary selection procedure. BIC is then described as the total intersection surface. As the surface area varies according to the object, the percent of the area is more significant than the actual area of surface contact. Thus, the equation for the total percent BIC in the summary results of the 2D analysis is as follows:

The reason that 2D analysis was used rather than 3D is well explained in the method note. By definition, the total volume of interest (VOI) surface includes the entire surface, not only the area of the side or peripheral VOI surface, but also the area of the top and bottom surfaces. However, to calculate BIC, both the top and bottom cut ends of the implant must be excluded. Hence, the peripheral VOI surface should replace the total VOI surface in the calculation. Although this procedure described in the method note is simple and powerful, it is not widely accepted as a certified method because it lacks a precise differentiation of implant and bone. Although the spiral scanning method itself helped to clear up scanning artifacts, the precise differentiation of bone and implant was also made possible through the algorithm used, unlike the conventional method.
Partial volume and the optimized implant
The PVE is an inevitable phenomenon that occurs when a voxel includes multiple materials (Figure 3). Partial volume (PV) refers to the mean attenuation value of the mixture of materials within the voxel; as such, PV does not have the same attenuation value as any of the individual materials inside the voxel. Therefore, completely accurate object volume measurement is not possible, although as the size of the object increases, its thresholded volume converges towards the true volume. In the scans performed here, PV showed attenuation values similar to or higher than those of bone; therefore, the PV was included in the segmentations of the implants. The optimized implant is therefore the sum of the thresholded implant and the PV layer (Figure 6). As other artifacts are clearly removed, the next surface layer of the optimized implant can be defined as BIC.
Figure 6
Simplified schematic of the improved algorithm for measuring BIC in 2 dimensions. The optimized implant region includes not only the thresholded implant region, but also the partial volume region. The next layer of partial volume effect is the newly defined BIC layer. The ROI for the BIC layer is dilated 1 pixel from the optimized implant region (red shaded area, 7 pixel columns from the left). The ROI perimeter is the entire layer of the BIC layer, the interval demonstrated by the double-ended vertical black arrow. The intersection (BIC) perimeter is where the bone meets the BIC layer, the interval represented by the double-ended vertical blue arrow. The percent BIC is the ratio of the BIC perimeter and ROI perimeter. When the dilation radius of the ROI increases, the new BIC perimeter and percent BIC values of the different layers can be measured.
BIC: bone-to-implant contact, ROI: region of interest, PVE: partial volume effect.
RESULTS
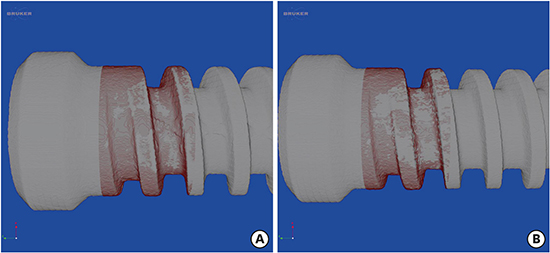
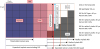
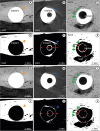
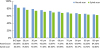
Spiral scanning allowed the accurate acquisition of BIC measurements, which could not be achieved with round scanning, even after long hours of scanning (Figure 7). The spiral scanning technique removed all the artifacts that were present in the round scanning, and a method to optimize partial averaging was determined through the algorithm, allowing the whole of the bone area in contact with the implant to be measured (Figure 8). As can be seen in Figure 9, the percent BIC values were higher in the round scanning results. However, these higher values were caused by halo and blur artifacts. Shadow artifacts were observed to a much lesser extent and had little impact on the results (Figures 9 and 10). When the algorithm was applied to measure the increase in bone thickness, the radius of the expansion ranged from 1 to 10 pixels (10 to 100 µm): the higher the radius, the further the measurement from the true BIC value (Figure 9).
Figure 7
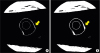
Comparison of coronal cross-section images. (A) Round scanning on SkyScan 1172. (B) Round scanning on SkyScan 1275. (C) Spiral scanning on SkyScan 1275. Blue arrow: halo, yellow arrow: shadow.
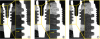
Figure 8
Artifacts depending on the scanning vectors. (A-C) Images taken from the round scan Skyscan 1275. Artifacts, including shadow (A), halo (B), and blur (C) are found. The shadow is darker than the neighbor pixels (A, orange arrow), while the halo is brighter than the neighbor pixels (B, blue arrow). The blur causes the imaged area to be processed as bone, which is eventually misinterpreted as bone contact (C, green arrows). (D-F) The thresholded images taken from the round scan show those artifacts more clearly. The shadow leaves black speckles that look like voids without bone, although actual bone exists (D, orange arrow). Conversely, the halo produces a false image of bone (E, blue arrow). The blur generates an incorrectly processed image with a thick white area that looks like bone (F, green arrows). (G-I) Images taken from spiral scan Skyscan 1275 are shown. The artifacts from the round scan are eliminated to disclose bone (G, orange arrowhead), just void (H, blue arrowhead), and no bone contact (I, green arrowheads). (J-L) The thresholded images from the spiral scan rectify those misinterpretations from the round scan: no void (J, orange arrowhead), no bone (K, blue arrowhead) and no bone contact (L, green arrowheads). The thin white line corresponds to the optimized partial volume effect pixels (red arrows), which were processed to be included as the implant in this study.
DISCUSSION
There is no standard protocol available for measuring BIC, and its measurement is therefore a difficult task for researchers and clinicians. Moreover, 2D measurements of BIC using histological analysis are invasive, a long time is needed to acquire the data, and the process of making the histological slides is particularly long. In addition, the right staining choice is important; however, whether staining is inadequate or properly performed, it is not easy to define and measure bone contact or volume with screws, because of the thread design. Furthermore, 2D histological analysis is not representative of bone formation as a whole; rather, it shows just a single section. This indicates the need for a standardized BIC measurement technique for dental implants, and we therefore developed and demonstrated the use of an advanced algorithm for measuring BIC.
The spiral scanning technique means that artifacts in the 3D images are controlled at the voxel level; therefore, the volume of new bone formation can be easily calculated, without the presence of optical artifacts such as halo, shadow, and blur artifacts, which can make it hard to differentiate bone from implant and can make determining the area ratio impossible at the bone-implant interface. Optical artifacts are not only caused by metal implants and bone specimens, but may also occur due to biodegradable polylactic acid (PLA) implants, and can be removed by the unique optical axis method of spiral scanning. By using spiral scanning and the advanced algorithm, it is now possible to continuously acquire area data from 3D reconstructed images and eventually to calculate the area ratio. This process, including the scanning time and extraction of BIC data, can be completed in less than 3 hours, which is a fraction of the time required to create and analyze 2D histological slides. Furthermore, as it is non-invasive, this advanced 3D BIC analysis procedure provides new experimental opportunities.
Aside from Ti implants, materials such as PLA, polylactic-co-glycolic acid, collagen, and Mg can also be evaluated with this algorithm, provided that the peaks of the attenuation histogram are clearly separated [712]. However, in the case of heavy materials such as Zr and Pt, scanning itself is problematic, even before analysis, because attenuation may be too severe and an adequate image may not be obtainable. Even though an object may be scanned under high-power output, the attenuation peaks can be superimposed, and thus no algorithm is effective.
A previous study used synchrotron-radiated micro-CT (Bessy II, Berlin, Germany), which is expected to provide images of equal quality to spiral scanning; however, this technique is not widely accessible, as it requires considerable time and the worldwide availability of such machines is very low [6]. Furthermore, this study did not use a fresh specimen, and monochromatic energy output does not optimize the PVE, but parallel-beam geometry does. Another study using other desktop micro-CT systems aside from spiral scanning achieved images that initially appeared to be of high quality; however, when closely examined, artifacts were present, and were falsely included as bone or implant in the BIC measurements [13]. Furthermore, detailed information regarding BIC was not fully presented.
While the observation of histological features with light microscopy is still required, this advanced algorithm clarifies the quantitative analysis of 3D BIC. Furthermore, it is non-invasive, accurate, and time-saving.
 XML Download