Abstract
Summary of Literature Review
The shape and the spatial orientation of the pelvis determine the organization of the lumbothoracic spine. The purpose of our study was to determine the relationship between pelvic tilt and lumbar disc degeneration.
Materials and Methods
Sixty patients over 50 years of age who had undergone lumbar spine magnetic resonance imaging were recruited. In individuals between 41 and 60 years of age, the normal pelvic tilt is 14°. Patients were divided into a low pelvic tilt (PT) group (<14°) and a high pelvic tilt (PT) group (≥14°). Lumbar disc degeneration was graded from I to V according to the Pfirrmann grade. We defined grades IV and V as high-grade degeneration and the others as low-grade degeneration. Radiologic parameters and lumbar disc degeneration were compared between these 2 groups.
Results
In the low PT group, the average degeneration grade of each lumbar segment was 2.61 in L1-L2, 2.61 in L2-L3, 3.00 in L3-L4, 3.39 in L4-L5, and 3.84 in L5-S1. The corresponding grades in the high PT group were 2.34 in L1-L2, 2.62 in L2-L3, 3.07 in L3-L4, 3.76 in L4-L5, and 3.55 in L5-S1. The grade of degeneration of the high PT group was significantly higher than that of the low PT group for L4-L5 (p=0.031). High-grade degeneration of the L4-L5 segment was significantly more common in the high PT group (odds ratio=4.65; 95% CI, 1.406-15.381; p=0.012).
REFERENCES
1. Vialle R, Levassor N, Rillardon L, et al. Radiographic analysis of the sagittal alignment and balance of the spine in asymptomatic subjects. J Bone Joint Surg Am. 2005; 87:260–7.

2. Keorochana G, Taghavi CE, Lee KB, et al. Effect of sagittal alignment on kinematic changes and degree of disc degeneration in the lumbar spine: an analysis using positional MRI. Spine (Phila Pa 1976). 2011; 36:893–8.
3. Legaye J, Duval-Beaupere G, Hecquet J, et al. Pelvic incidence: a fundamental pelvic parameter for three-dimensional regulation of spinal sagittal curves. Eur Spine J. 1998; 7:99–103.

4. Doi T, Tono O, Tarukado K, et al. A new sagittal parameter to estimate pelvic tilt using the iliac cortical density line and iliac tilt: a retrospective X-ray measurement study. J Orthop Surg Res. 2015; 10:115.

5. Herrington L. Assessment of the degree of pelvic tilt within a normal asymptomatic population. Man Ther. 2011; 16:646–8.

6. Boulay C, Bollini G, Legaye J, et al. Pelvic incidence: a predictive factor for three-dimensional acetabular orientation-a preliminary study. Anat Res Int. 2014; 2014:594650.

7. Legaye J, Duval-Beaupere G, Barrau A, et al. Relationship between sacral pelvic incidence and acetabular orientation. Hip Int. 2011; 21:87–97.

8. Schwab F, Lafage V, Boyce R, et al. Gravity line analysis in adult volunteers: age-related correlation with spinal parameters, pelvic parameters, and foot position. Spine (Phila Pa 1976). 2006; 31:E959–67.
9. Pfirrmann CW, Metzdorf A, Zanetti M, et al. Magnetic resonance classification of lumbar intervertebral disc degeneration. Spine (Phila Pa 1976). 2001; 26:1873–8.

10. Schwab F, Patel A, Ungar B, et al. Adult spinal deformity-postoperative standing imbalance: how much can you tolerate? An overview of key parameters in assessing alignment and planning corrective surgery. Spine (Phila Pa 1976). 2010; 35:2224–31.
11. Duval-Beaupere G, Schmidt C, Cosson P. A Barycentre-metric study of the sagittal shape of spine and pelvis: the conditions required for an economic standing position. Ann Biomed Eng. 1992; 20:451–62.

12. Legaye J. The femoro-sacral posterior angle: an anatomical sagittal pelvic parameter usable with dome-shaped sacrum. Eur Spine J. 2007; 16:219–25.

13. Vialle R, Ilharreborde B, Dauzac C, et al. Intra and interobserver reliability of determining degree of pelvic incidence in high-grade spondylolisthesis using a computer assisted method. Eur Spine J. 2006; 15:1449–53.

14. Gelb DE, Lenke LG, Bridwell KH, et al. An analysis of sagittal spinal alignment in 100 asymptomatic middle and older aged volunteers. Spine (Phila Pa 1976). 1995; 20:1351–8.

15. Boulay C, Tardieu C, Hecquet J, et al. Sagittal alignment of spine and pelvis regulated by pelvic incidence: standard values and prediction of lordosis. Eur Spine J. 2006; 15:415–22.

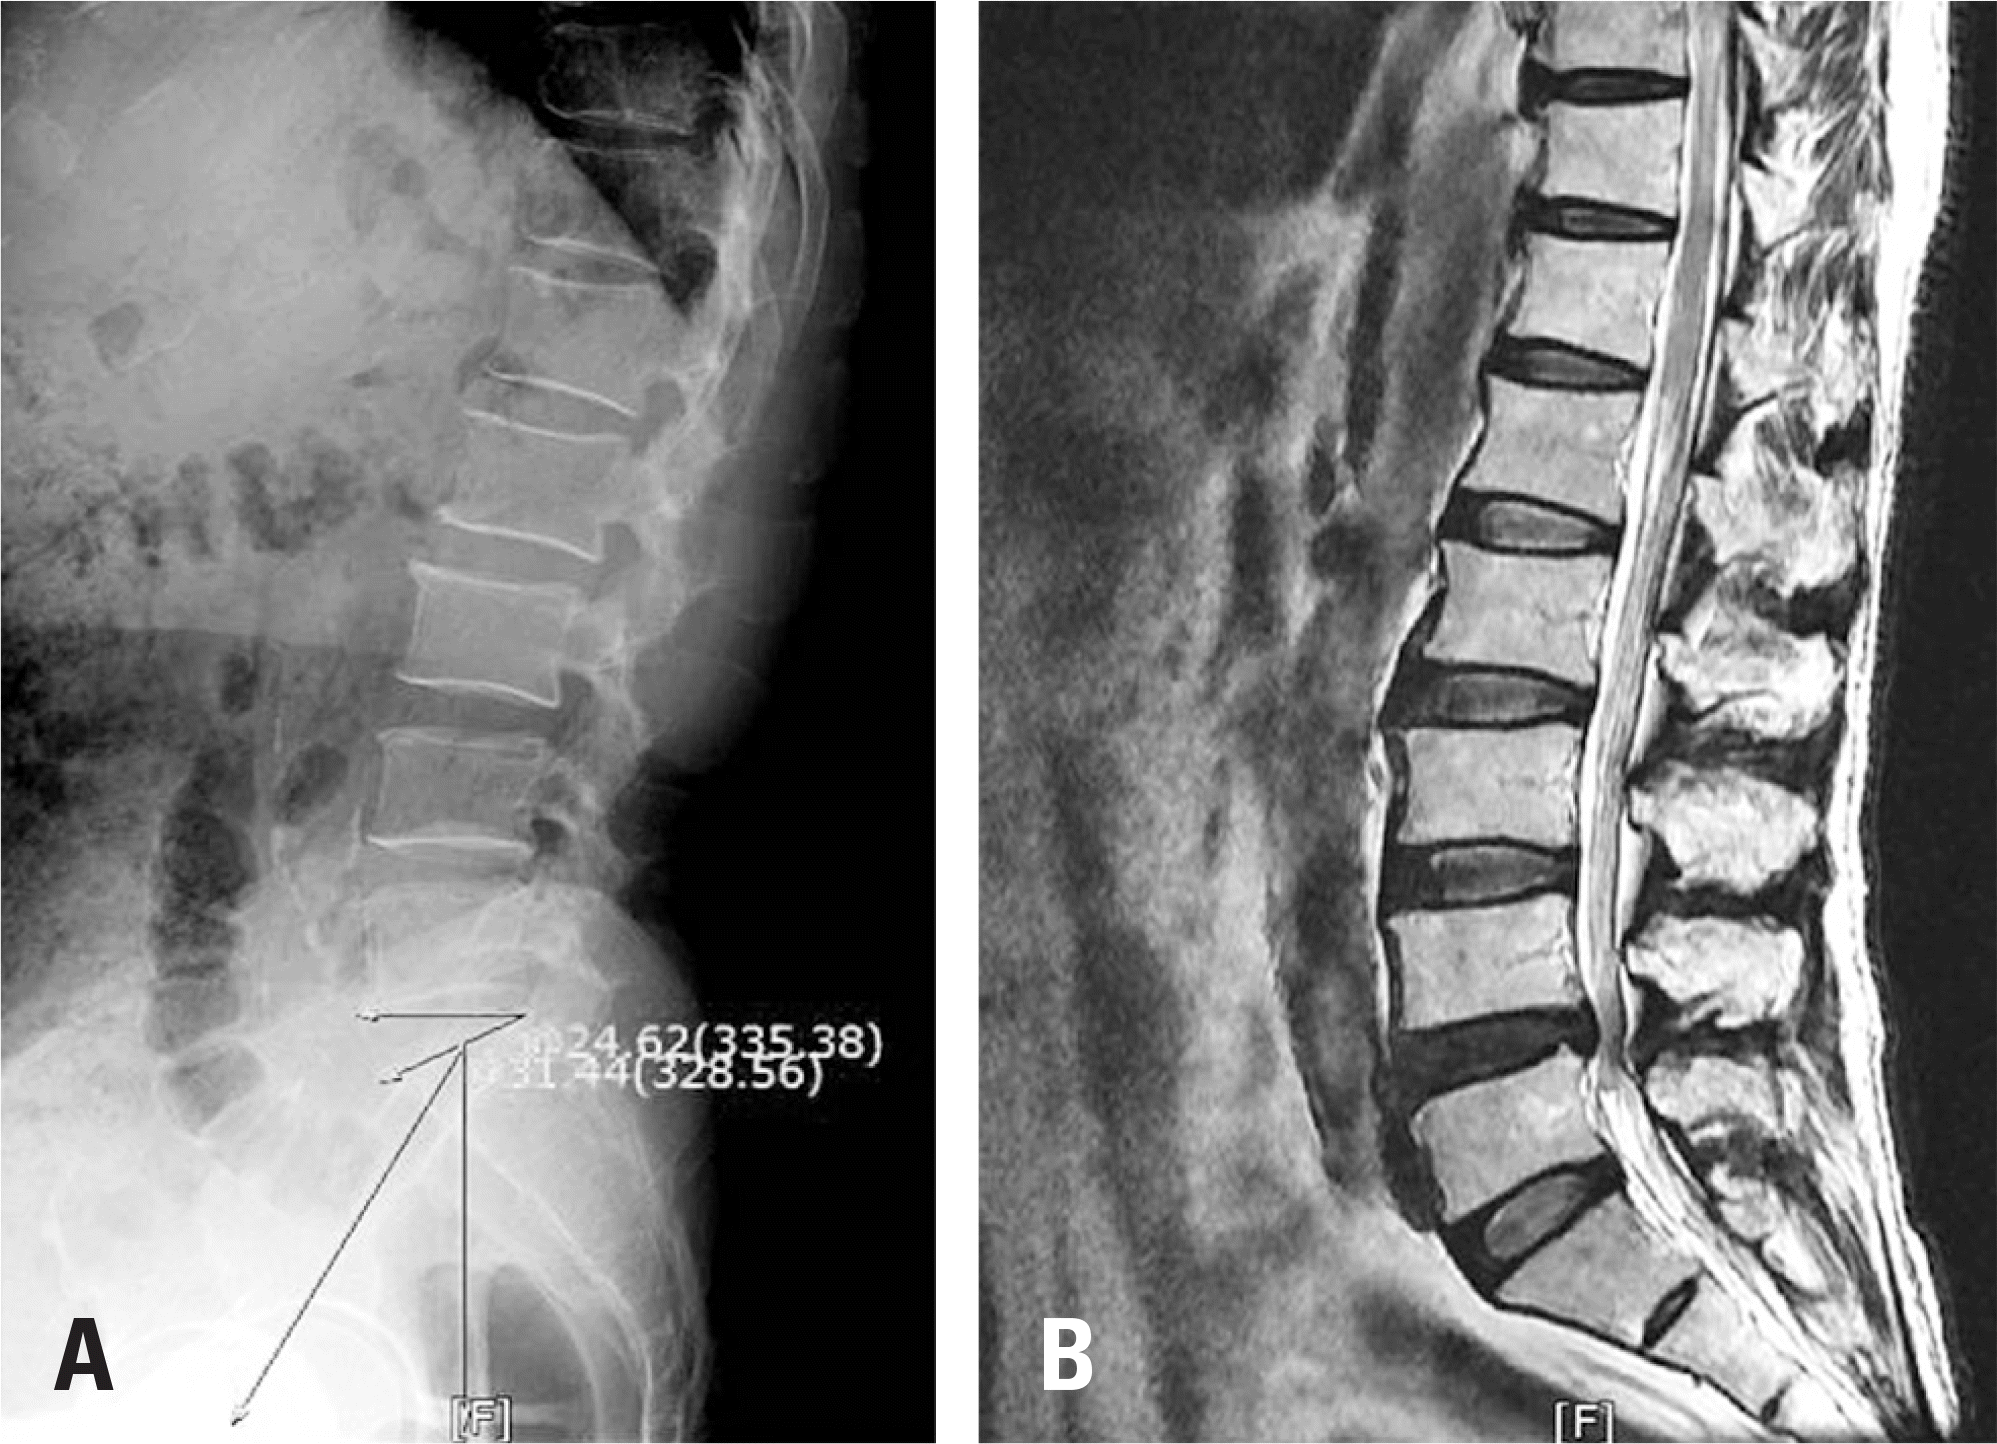
Fig. 1.
Radiography of a 67-year-old male with high pelvic tilt. (A) Upright lateral X-ray. (B) T2 sagittal image of lumbar magnetic resonance imaging.

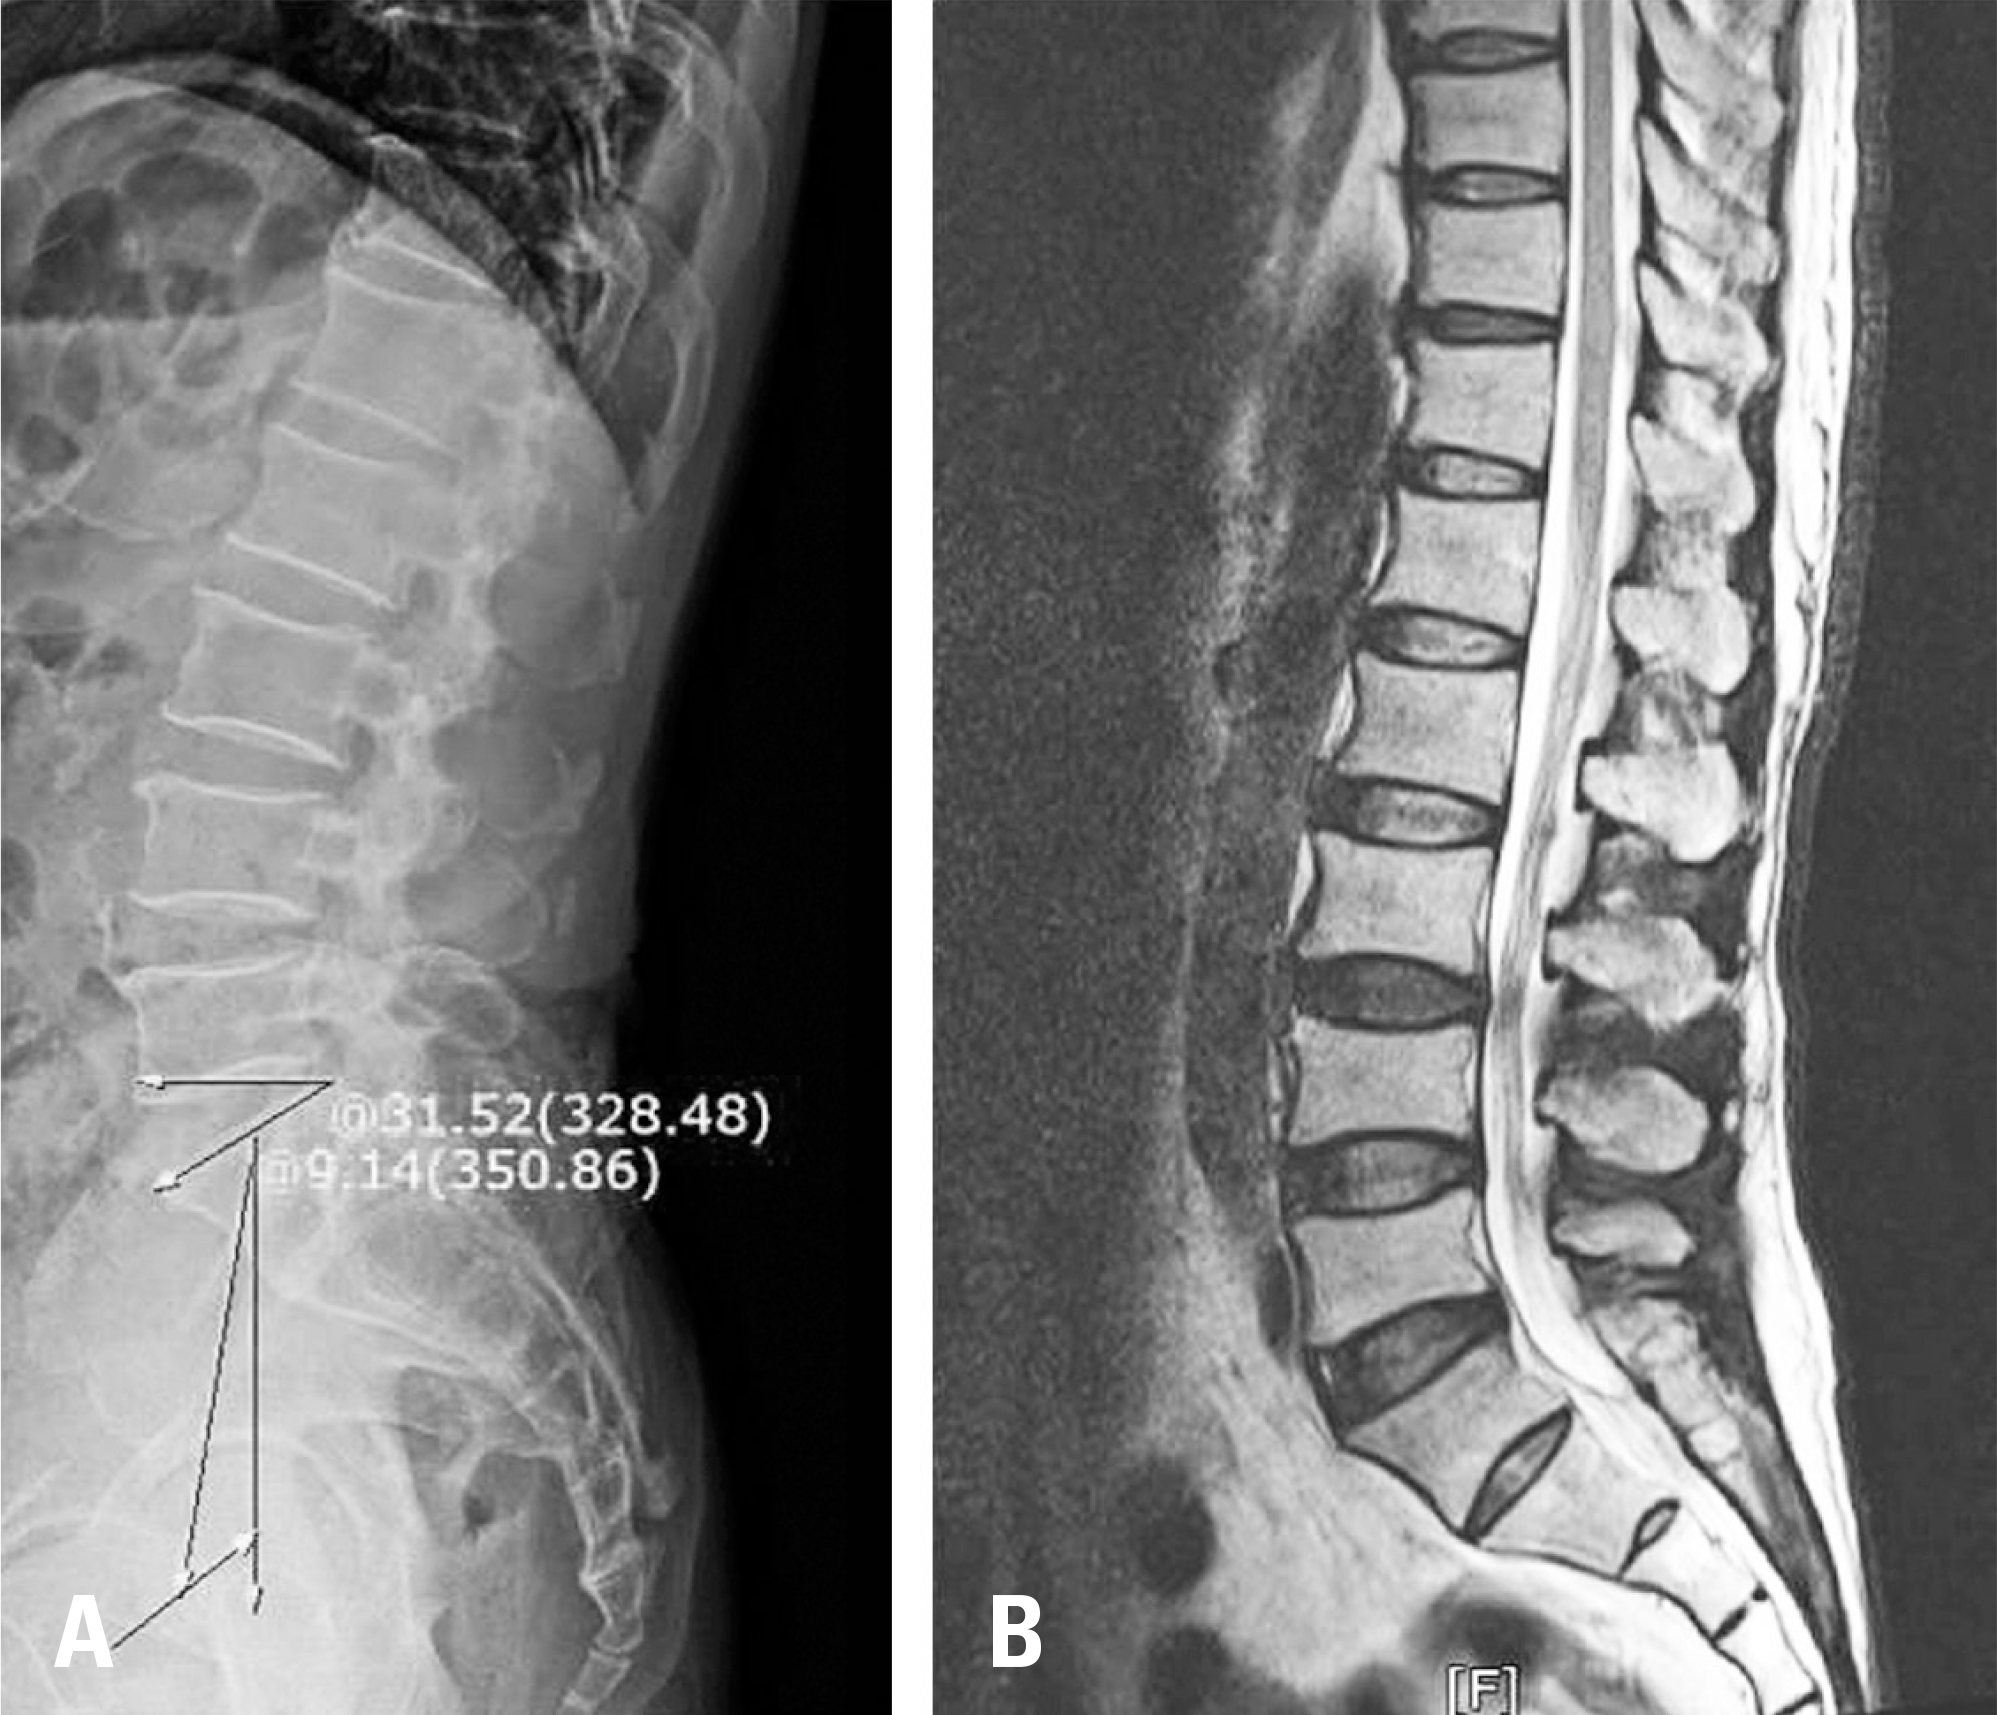
Fig. 2.
Radiography of a 69-year-old male with low pelvic tilt. (A) Upright lateral X-ray. (B) T2 sagittal image of lumbar magnetic resonance imaging.

Table 1.
Descriptive data of patients
Table 2.
Comparison between Low PT group and High PT group
Table 3.
Comparison of radiologic parameter on MRI between low PT group and high PT group using t-test
Table 4.
Comparison of radiologic parameter between low PT group and high PT group using chi-square test


 PDF
PDF ePub
ePub Citation
 Print
Print


 XML Download