

 PDF
PDF ePub
ePub Citation
 Print
Print


INTRODUCTION
Better understanding of the biological behavior and prog nosis of each subtype of breast cancer has become a critical issue in patient management because breast cancer is a hetero geneous disease in which each distinct subtype shows as distinguishable clinical course and prognosis [123]. In clinical practice, im muno histochemical criteria has been established to define breast cancer subtypes with the use of different prognostic information and treatment approaches have been tailored according to immunohistochemical subtype [1].
Since a small piece of cancer mass, a size generally used for immunohistochemical staining, cannot sufficiently reflect the whole breast cancer burden, there have been many reports that describe the imaging characteristics of each subtype [4567]. To note, breast MRI has offered not only structural but also functional properties of cancers analyzed mainly with compu terized calculation [68]. Furthermore, as more studies have been published on the gene expression profiles of breast cancer [9], several studies have focused on the relationship between gene expression and computer-derived MRI phenotypes of breast cancer to propose noninvasive prognostic biomarkers through MRI [10111213]. However, computer-derived calculated parameters might be difficult to apply in actual routine practice, because the interpretation of breast MRI is generally based on the Breast Imaging Reporting and Data System (BI-RADS) by the American College of Radiology; to our knowledge, a study on the gene expression of breast cancers according to the BI-RADS MRI lexicon has not been reported.
Therefore, we intended to evaluate whether the BI-RADS MRI lexicon could reflect the genomic information of breast cancers by matching data sets of breast MRI from The Cancer Imaging Archive (TCIA) and gene expression profiles from The Cancer Genome Atlas (TCGA) and to suggest intuitive imaging features as biomarkers rather than complicated computer-derived parameters [1415].
METHODS
Study sample
Open data accessible to the public which included clinical, pathologic, and immunohistochemical stain information were downloaded from TCGA and TCIA (http://www.cancerimagingarchive.net/); the data were de-identified. Eighty-six patients had breast MRI results available that corresponded to TCGA data. Sixteen out of the 86 patients were excluded for the following reasons: uncertain visualization of a proven malignancy on magnetic resonance (MR) images (n = 4) and nonmass enhancement on MR images as a proven malignancy (n = 12). Finally, a total of 70 patients (median age, 54.5 years; interquartile rage, 45.7–63.3 years) were included in this study. We downloaded breast cancer level 3 mRNA microarray data from the Genomic Data Analysis Center Firehorse website (http://gdac.broadinstitute.org/) [16]. The data set was a median-based integrated expression data set assembled using column-centered level 3 data. The immunohistochemical subtypes of breast cancers determined by estrogen receptor (ER), progesterone receptor (PR) and human epidermal growth factor recep tor type 2 (HER2) statuses were categorized according to the clinical guideline issued by the American Society of Clinical Oncology and the College of American Pathology [151718]. The subtypes were classified as follows according to ER, PR, and HER2: luminal (ER positive or PR positive, regardless of HER2 positivity [luminal A, luminal B and luminal-HER2 types were all included); HER2-enriched (ER negative, PR negative, and HER2 positive); and triple-negative (ER negative, PR negative, and HER2 negative) subtypes [12].
Image analysis
Two radiologists (GRK and YJK) with 6 and 8 years of breast im aging experience reviewed the 70 MRI examinations accord ing to BI-RADS and were blinded to TCGA data [19]. They assessed the lesion on DICOM files by using a picture archiving and communication system (Maroview 5.4; Innfinitt, Seoul, Korea) with high-resolution monitors. The MR images for the 70 cancers were analyzed based on the BI-RADS MRI lexicon for shape, margin and internal enhancement characteristics whereas the kinetic curve assessment was not performed since not all MRI examinations included 1 precontrast and 5 postcontrast examinations. BI-RADS lexicon was assigned by the 2 readers in consensus for all 70 cases. Tumor size was determined on the postcontrast axillar or sagittal images, from whichever image was available, and the largest diameter of the 3-dimensional planes was considered the tumor size. Multiplicity was determined when multifocal or multicentric lesions were detected.
Frequency analysis was done with the Mann-Whitney U-test for continuous variables and the chi-square test or Fisher exact test for categorical or ordinal variables. Statistical analysis was performed using IBM SPSS Statistics ver. 19.0 (IBM Co., Armonk, NY, USA), and statistical significance was defined when P-values < 0.05.
Microarray data analysis
The lowess normalized mRNA expression microarray data set of 70 cases with matching MRI imaging data was used for analysis. After removing outliers, the data set was filtered to include the most varying 5,000 genes. Unsupervised hierarchical clustering was performed to group samples with similar gene expression signatures. The Limma package was then used to identify differentially expressed genes in each cluster [20]. After calculating the differential expression between clusters, gene signatures were generated by choosing genes that met the selection criteria of a fold change greater than 2 and a false discovery rate (FDR) of less than 0.05. Subsequent functional annotation analysis was performed using DAVID [21]. Gene Set Enrichment Analysis (GSEA) was done using GSEA software distributed from the MIT Broad institute website (http://software.broadinstitute.org/gsea) [2223]. For GSEA, we used all sets from Molecular Signatures Database (MSigDB) version 5.2 [22]. After calculating the enrichment score (ES) for each signature (gene set), significant signatures with a FDR < 25% were chosen. When no signature met the criteria of a FDR < 25%, signatures with a nominal P-value < 0.01 were selected instead.
RESULTS
Patient characteristics
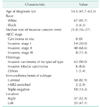
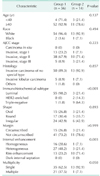
Of the 70 patients with matched TCIA MR images and TCGA microarray gene expression profile data, 67 (95.7%) were white females. All 70 had invasive breast cancers; the pathologic stage was stage I or II in 62 out of 70 patients (88.6%). Invasive carcinoma of no special type was the most frequent breast cancer (n = 63, 90.0%). Immunohistochemical subtypes of the 70 cancers were as follows: luminal (n = 58, 82.9%); HER2-enriched (n = 2, 2.9%); and triple-negative (n = 10, 14.3%) (Table 1). The location of the cancers were relatively evenly distributed in both breasts (Table 1).
Clinicopathologic and MRI characteristics according to subtype found by unsupervised hierarchical clustering of the gene expression profile
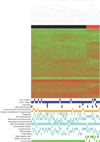
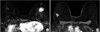
To investigate potential subgroups of breast cancer, we applied unsupervised hierarchical cluster analysis to TCGA micro array gene expression data set and found 2 major subgroups (groups 1 and 2) (Fig. 1). The luminal subtype, which was determined by immunohistochemical stain, was exclusively predominant in group 1 (98.2%) while the triplenega tive subtype was predominant in group 2 (64.3%) (P < 0.001). According to the BI-RADS MRI lexicons of mass, internal enhancement was significantly different between 2 groups (P = 0.003). Heterogeneous enhancement was most frequently seen in group 1 (48.2%), which was followed by homogenous enhancement (28.6%) and rim enhancement (23.2%), whereas rim enhancement was dominantly observed in group 2 (71.4%) (Fig. 2). The breast cancers of group 2 were single lesions (92.9%) while 37.5% of the breast cancers of group 2 were multiple lesions (P = 0.050). Other MRI characteristics were not significantly different between the 2 groups (Table 2).
Differentially expressed genes and gene set enrichment analysis
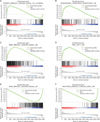
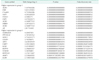
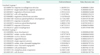
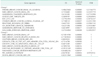
Limma analysis was performed to identify genes differentially expressed between the 2 groups with above-mentioned criteria. We found 1,303 genes significantly associated with each group (Table 3, Supplementary Table 1). Compared to group 1, group 2 had 604 overexpressed and 699 underexpressed genes. Subsequent functional annotation analysis revealed that mitotic cell division related processes were one of the most-enriched biological processes in group 2 whereas mammary gland development and hormone related processes had higher fold-ES s in group 1 (Table 4, Supplementary Table 2). Group 1 had significantly higher expression of AR and ESR1. To identify significantly enriched signatures in the 2 groups, GSEA was performed. In group 1, 2 gene sets were found to be significant with a FDR < 25%, which included gene signatures related to the luminal subtype (FARMER_BREAST_CANCER_BASAL_VS_LUMINAL) excluding those related to the basal subtype (SMID_BREAST_CANCER_BASAL_DN). In group 2, no gene sets were significant with a FDR < 25%, but 40 gene sets met the criteria of nominal P-value < 0.01 (Fig. 3, Table 5, Supplementary Table 3).
DISCUSSION
During the last 10 years, the breast cancer survival rate has increased from 83.2% to 91.3%, with the number of breast cancer survivors steadily increasing as well. Accordingly, the expected lifetime of these survivors has lengthened mainly due to early detection and development of treatment options and this has led to more emphasis on prognostic management [24]. However, the heterogeneity of breast cancer is still a hurdle in the success ful treatment of breast cancer patients with prognostic infor mation [25]. As tissue samples might not represent the entire tumor burden, breast MRI has emerged as an object of “radiogenomics” to provide structural and functional properties of the entire tumor [10111213]. Breast MRI is very sensitive and is able to complement histopathologic or molecular markers to predict tumor biology [1].
In our study, the clustering of gene expression profiles found two distinct groups and MRI features of internal enhancement were significantly different between the 2 groups. There have been several reports suggesting that computer-derived MRI phenotypes can be related with the gene expression of breast cancers [10111213]. In these previous studies, radiogenomic analy ses were performed with the computerized calculation of MR images. Tumor size differed according to gene expression status whereas breast cancer stages according to the commonly applied American Joint Committee on Cancer guidelines were not differently distributed between 2 groups in our study [1213].
Recently, rim enhancement on MRI has been reported to be related to poor prognosis of breast cancers [1026]; for exam ple, a high calculated score indicating rim enhancement on MRI was associated with early occurrence of metastasis and certain RNAs were correlated with the high score of rim en hance ment [10]. Rim enhancement was predominant in group 2 of our study sample in which the genes related to poor prognosis were overexpressed. Matrix metalloproteinase-1 which is related to tumor growth and metastasis and epidermal growth factor receptor which is associated with poor clinical outcomes of tumor were dominantly expressed in group 2 [2728]. However, whether these genes cause rim enhancement is still unclear and information on long-term outcome or metastasis was unavailable in our study. Therefore, in order to clarify the relationship between rim enhancement and certain genes of poor prognosis, a further research would be needed. Targeted acquisition of tissue sample in fibrotic cores or microvessel density which have been associated with rim enhancement histopathologically might be help reveal the mech anism behind the presentation of rim enhancement by specific genes [26].
Since the development of DNA microarray technology, breast cancers have been divided into 2 large categories based on gene expression pattern of ER biology [2]. Despite the continuous development of state-of-the-art analytic methods, un super vised hierarchical clustering probably remains the most basic and robust method and our results agree with the results of previous studies which performed similar an alyses [9]. Since DNA microarray is not routinely performed in clinical practice, breast cancer subtypes are currently based on the immunohistochemical staining levels for the expression of the ER, PR, and HER2 [1]. Because luminal cancers were predominant in group 1 and triple-negative cancers were predominant in group 2 of our study sample, known char ac teristics of luminal cancers such as heterogeneous enhance ment or multiplicity were frequently observed in group 1 [456] and single manifestation or rim enhancement, which are known to be frequent in triple-negative cancers, were predo minantly seen in group 2 [4567]. Nevertheless, even though the specific imaging features mentioned above were strongly related to a peculiar molecular subtype of breast cancer [456726], cer tain clustered gene expression profiles may be associated with specific imaging features such as rim enhancement or hetero geneity of internal enhancement according to our results as well as prior studies [1013]. Since ERBB4, a gene correlated with aggressiveness mainly in triple-negative breast cancers, was one of the markedly underexpressed genes in group 2 in spite of triple-negative cancers being absolutely predominant in this group, we can hypothesize that an undiscovered intrinsic relationship might exist between gene expression char acteristics and imaging features [29].
Our study has several limitations. First, our sample size is relatively small; we integrated TCGA and TCIA data to conduct this analysis and a future study with a large study sample is necessary. Second, information on long-term outcome or metastasis was unavailable in our study sample, thus rela tionship between prognosis and MRI features or specific genes enriched in each group cannot be evaluated. Third, we did not con sider interobserver variability when interpreting breast MRI, but we did assess tumors using the standard BI-RADS lexicon with arbitration between the 2 readers. Moreover, moderate to substantial agreement on BI-RADS MRI lexicon has been reported before [30]. Fourth, we excluded patients who had non-mass enhancement on MRI for their breast cancers. Thus, our results are not applicable to all breast malignancies found on MRI. However, non-mass enhancement has lower agreement among readers and is assessed by different imaging descriptors compared to mass. A future study about non-mass enhancement with a large sample might be needed because we had only 12 nonmass enhancement cases in this study. Finally, we did not perform kinetic analysis of breast MRI. As the MR images of all dynamic enhancing phases under regular conditions were unfortunately unavailable, interpretation of kinetic features without supplementary computerized parameters might be limited.
In conclusion, our results identified intuitive imaging features of breast MRI associated with distinct gene expression pro files using the standard imaging variables of BI-RADS, a lexicon which is routinely used in real clinical practice. The internal enhancement pattern on MRI might reflect specific gene expres sion profiles of breast cancers, which can be recognized by visual distinction.
 XML Download