

 PDF
PDF ePub
ePub Citation
 Print
Print


Introduction
Obesity has been reported to be a serious public health problem among children and adolescents across the developed and developing country in recent years [1]. In the developed country, obesity is the most common disease in children and adolescents [1]. About 22 million of children worldwide are overweight [2]. Based on the National Health and Nutrition Examination Survey (NHANES III and NHANES 1999-2000), the prevalence of overweight among US adolescents aged 12 to 19 years has increased from 10.5% in 1988-1994 to 15.5% in 1999-2000 [3]. On the contrary, the prevalence of underweight has decreased from 5.5% in 1970s to 3.3% in 1990s [4]. These studies have reported a rapid increase in prevalence of overweight and obesity as well as decrease in prevalence of underweight among adolescents worldwide.
The high prevalence of overweight and obesity should be highlighted as one of the priority health issues among adolescents, since overweight and obesity during adolescence tend to persist till adulthood [5]. About 70% to 80% of obese adolescents remained to be obese during adulthood [6]. In addition, overweight and obesity are one of the independent risk factors for many non-communicable chronic diseases [7]. There are several short term and long term consequences of overweight and obesity in children and adolescents. In short-term consequences, overweight and obese children and adolescents may experience behavioral problems, low self-esteem, and clinical conditions such as asthma, systemic inflammation, type 1 diabetes mellitus and cardiovascular risk factors [8]. Meanwhile, long term consequences of obesity include adverse social and economic outcomes, increased cardiovascular risk, diabetes, hypertension, stroke, some types of cancer and premature mortality in future adulthood [7,8].
Based on previous studies in western countries, dietary practices of adolescents include eating large amounts of snack that are high in sugar and fat [9]. The modern society's life style is increasingly sedentary and this problem has been observed among adolescents too [10,11]. Adolescents tend to spend most of their time playing computer games, doing homework and other relevant activities instead of spending time on exercise and sports [11]. Levels of physical activity tend to decline among adolescents, and physical inactivity during adolescence might carry on towards adulthood [12]. Low level of physical activity and unhealthy dietary practices are found to be predictors of obesity among adolescents [13]. Furthermore, body image plays an important role in determination of body weight status, particularly among adolescents [14]. Adolescents who have negative body image are more likely to practice dieting behaviors such as skipping meals, use of laxatives and vomiting [15]. Dieting is associated with binge eating behaviors that may lead to obesity problem among adolescents [16].
Malaysia is also experiencing the similar situation where prevalence of overweight and obesity among children and adolescents are increasing. The prevalence of overweight among adolescents has increased from 9.5% in 1997 to 19.6% in 2007 [17,18]. On the other hand, the prevalence of underweight has decreased from 14.8% in 2004 to 11.4% in 2006 [19,20]. As published findings were limited, there is a need to determine the obesity-related behaviors of Malaysian adolescents. Therefore, the present study aims to determine three obesity-related behaviors that may associate with overweight and obesity among Malaysian adolescents, namely dietary practices, physical activity and body image.
Subjects and Methods
Subjects and study design
A cross-sectional study was conducted among secondary school students in Kajang district of Selangor state. A list of secondary schools in Selangor was obtained from the State Education Department of Selangor and all secondary schools within Kajang district were identified. Three secondary schools that met the inclusion criteria of comprising multiracial and co-educational in their student composition were randomly selected. All second year students were invited to participate in this study.
A total of 382 respondents with 49.0% males and 51.0% females were involved in this study. The age of the respondents ranged from 13 to 15 years with a mean age of 14.0 ± 0.8 years. Of the total respondents, 56% were Malays, 30.1% were Chinese and 13.9% were Indians. This study was approved by the medical research ethic committee of faculty of medicine and health sciences, UPM, the ministry of education and state education department of selangor. Information sheets were distributed to the students and their parents to explain the content of the study. Signed consents were obtained from both students and parents.
Anthropometric measurement
Body weight was measured using a TANITA digital scale while body height was measured using a SECA body meter. Each measurement was measured twice with weight recorded to the nearest 0.1 kg and heights to the nearest 0.1 cm. Body weight status of the respondents were determined based on their BMI-for-age derived from the WHO Growth Reference 2007 [21].
Dietary practicesd
Dietary practices of adolescents were assessed for meal skipping, snacking behaviors, and energy and nutrient intakes. Meal skipping and snacking behaviors of the adolescents were assessed using a self-administered Eating Behaviors Questionnaire (EBQ) [22]. Adolescents who skipped at least one meal per day and consumed foods or beverages between meals per day were considered as skipping meal and snacking, respectively. Energy and nutrient intakes were obtained from the two-day dietary record. All respondents were taught how to record a detailed dietary record for two days (a weekday and a weekend). Respondents were taught how to record types and amount of food and beverage taken in the given form. Each type and amount of food and beverage taken as well as supplements consumed were self-reported. Details such as brand names and preparation method were recorded. The Nutritionist Pro™ Diet Analysis software was used to assess energy and nutrient intakes.
Physical activity
A two-day physical activity record was used to provide information on physical activity level and total daily energy expenditure. Respondents were required to record their activity performed every 15 minutes for two days (similar days of recording their diet). Based on the compendium of physical activities, each activity recorded by respondents was assigned to a MET value (1 MET = 3.5 ml 02/kg body weight/minute or resting metabolic rate) [23]. Energy expenditure for each activity was calculated and total daily energy expenditure (TDEE) for each respondent was estimated by summing up the energy expenditure spent for each activity in a day. Furthermore, the physical activity level (PAL) of respondents was calculated by dividing the total daily energy expenditure (TDEE) with the basal metabolic rate (BMR) (TDEE/BMR) [24,25]. Physical activity level was classified into four categories namely, sedentary (< 1.40), light activity (1.40-1.69), moderate-level physical activity (1.70-1.99) and vigorously active (2.00-2.40) [24].
Body image
Body image was assessed using the Multi-dimensional Body Image Scale (MBIS) [26]. It comprises of seven dimensions (62 items) including preoccupation with thinness and dieting behavior, appearance and body satisfaction, body importance, muscle increasing behavior, appearance importance, extreme dieting behavior, perception of body size and shape dimensions. All items are scored using the 5-point scale, and higher composite MBIS score indicates that higher risk of being at-risk of negative body image. The instrument has been shown to be reliable and valid for Malaysian female adolescent sample [26]. The internal consistency for the current sample was 0.881.
Statistical analysis
SPSS for Windows version 17.0 (SPSS, Inc. Chicago, IL, USA) was used for data analysis. Descriptive statistics such as mean, standard deviation (SD), frequency and percentage were used to describe all variables. Pearson product-moment correlation was used to determine significant relationships between continuous variables. Chi-square test was used to determine associations between categorical variables and independent samples t-test was used to determine differences between variables. Multiple linear regression analysis was used to determine the factors associated with overweight and obesity. A statistical level of P < 0.05 was considered as significant.
Results
Body weight status
The overall mean body weight of the respondents was 50.0 ± 13.1 kg (male: 52.1 ± 13.2 kg; female: 48.1 ± 12.8 kg; t = 2.994, P < 0.05) whereas the mean height of the respondents was 1.59 ± 0.08 m (male: 1.62 ± 0.08 m; female: 1.56 ± 0.06 m; t = 7.692, P < 0.05). This study reported a mean body mass index (BMI) of 19.8 ± 4.5 kg/m2 for all respondents. The mean BMI for males was 19.8 ± 4.4 kg/m2 and mean BMI for females was 19.7 ± 4.7 kg/m2 (t = 0.243, P > 0.05). Additionally, the mean BMI for Malays, Chinese and Indians were 20.2 ± 5.0 kg/m2, 19.1 ± 3.6 kg/m2 and 19.5 ± 4.1 kg/m2, respectively (F = 2.548, P > 0.05). There were no differences in BMI regardless of sex and ethnicity.
Based on WHO Growth Reference 2007 [21], majority of the respondents were normal weight (70.0%), followed by overweight and obese (19.5%) and underweight (10.5%). Among male respondents, majority of them were normal weight (70.4%), followed by overweight and obese (19.3%) and underweight (10.3%). As for female respondents, most of the female respondents were under the category of normal weight (69.6%), followed by overweight and obese (19.5%) and underweight (10.8%). In other words, about one in five of the adolescent boys and girls in this study were either overweight or obese.
Dietary practices
Meal skipping and snacking behaviors
More than half (72.3%) of the respondents skipped at least one meal per day. The remaining respondents (27.7%) did not skip any meals. It should be noted that the most frequently missed meal was breakfast (55.7%), followed by lunch (42.9%) and dinner (21.4%). There were no significant differences in the proportion of adolescents who skipped meals between body weight status (χ2 = 0.15, P > 0.05). Additionally, more than half (56.2%) of the respondents snacked between meals daily and the remaining (43.8%) did not snack between meals daily. The proportion of normal weight respondents (70.8%) snacked between meals daily was higher than underweight (11.3.3%) and overweight and obese respondents (17.9%), but the differences were not significance (χ2 = 0.602, P > 0.05). Foods that were commonly snacked by the respondents between meals were fruits, breads and local cakes (such as fried banana (pisang goreng), fish cake (keropok lekor) and curry puff), while beverages that were commonly snacked by the respondents between meals were tea and chocolate malted drink.
Energy, macronutrient and micronutrient intakes
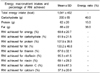
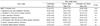
The mean total energy intake for all respondents was 1,641 ± 452 kcal per day (Table 1). In terms of macronutrients intake, the mean intake for carbohydrate, protein and fat of all respondents were 200 ± 65 g, 62 ± 20 g and 66 ± 22 g, respectively. The energy intake of respondents reached an average of 69.8% of the recommended nutrient intake (RNI) level [27]. Intakes of protein and fat showed high attainment, achieving the RNI levels of 107.9% and 133.2% respectively. For mean carbohydrate intake, 61.9% of RNI was achieved. All vitamins intake include thiamin (67.0%), riboflavin (95.3%), niacin (69.1%), and vitamin C (63.9%) achieved less than 100% of the RNI, while calcium intake achieved 37.3% of RNI level. In other words, adolescents in this study did not achieve adequate energy, carbohydrate, most of the vitamins and calcium. However, the protein and fat intakes were rather high among respondents in this study. Carbohydrate contributed to 49.0% of total energy intake of respondents, followed by fat (36.0%) and protein (15.0%).
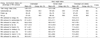
As shown in Table 2, the energy and nutrient intakes were compared by body weight status of the respondents. In particular, the mean total energy intake for overweight and obese respondents (1,760 ± 464 kcal per day) was the highest, while the mean total energy intake for underweight (1,601 ± 517 kcal per day) and normal weight respondents (1,617 ± 438 kcal per day) were similar. Hence, no significant differences of mean total energy intake were found between body weight status of the respondents (F = 1.771, P > 0.05). There were also no differences were found between macronutrient intakes and the ratio of macronutrient contribution to total energy intake and body weight status of the respondents (Table 2). Similarly, there were no significant differences in percentage of RNI achieved for energy, macronutrient and micronutrient intakes and body weight status of respondents (Table 2).
Physical activity
Energy expenditure
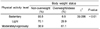
The mean crude energy expenditure of the respondents was 1,631 ± 573 kcal per day. Overweight and obese respondents had significantly higher mean crude energy expenditure (2,354 ± 552 kcal per day) compared to underweight (1,129 ± 298 kcal per day) and normal weight respondents (1,512 ± 423 kcal per day) (F = 77.287, P < 0.05) (Table 3). However, when body weight was taken into consideration, there was no significant differences in energy expenditure per kilogram of body weight between body weight status of respondents (F = 1.067, P > 0.05) (Table 3).
Physical activity level
The mean physical activity of the respondents was 1.30 ± 0.34, indicating a sedentary lifestyle among respondents. The mean physical activity for overweight and obese respondents (1.58 ± 0.33) was significantly higher than underweight (1.06 ± 0.31) and normal weight respondents (1.27 ± 0.31) (F = -25.190, P < 0.01) (Table 3).
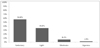
The prevalence of physical activity level among adolescents in Kajang, Selangor is presented in Fig. 1. Majority of the respondents (56.8%) were practicing sedentary lifestyle followed by light active (35.0%) and moderately active (6.4%). Only small percentage of respondents (1.8%) engaged in vigorous activity (Fig. 1). In order to compare the physical activity level and body weight status of the respondents, chi-square analysis was performed. For fulfilling the chi-square analysis assumption, underweight and normal weight respondents were categorized into non-overweight group and were compared to overweight and obese group. A higher proportion of overweight and obese respondents (61.1%) engaged in moderate/vigorously active lifestyle as compared to underweight and normal weight respondents (38.9%) (χ2 = 39.056, P < 0.01) (Table 4).
Body image
The mean composite score for MBIS was 55.98 ± 7.98 with a minimum of 29.35 ± 8.71 and a maximum of 78.23 ± 8.71. The mean composite score for MBIS among overweight and obese respondents (62.02 ± 6.88) was significantly higher than underweight (51.04 ± 8.17) and normal weight respondents (55.09 ± 7.31) (F = 35.793, P < 0.01) (Table 5). In other words, overweight and obese respondents had higher risk of negative body image than underweight and normal weight respondents. As body image comprises of seven dimensions, Table 5 shows the mean score of each dimension. In particular, overweight and obese respondents (47.21 ± 10.84) had significantly higher score for dimension of appearance and body satisfaction than underweight (40.00 ± 9.00) and normal weight respondents (39.21 ± 9.84) (F = 18.571, P < 0.01). Similarly, score for dimension of perception of body size and shape was significantly higher among overweight and obese respondents (19.75 ± 2.37) than underweight (11.69 ± 2.75) and normal weight respondents (15.65 ± 2.61) (F = 135.550, P < 0.01). Overweight and obese respondents (43.68 ± 10.25) also had significantly higher score of preoccupation with thinness and dieting behavior as compared to underweight (26.88 ± 12.64) and normal weight respondents (35.60 ± 11.61) (F = 29.101, P < 0.01). There were no significant differences in score of body importance, appearance importance, muscle increasing behavior and extreme dieting behavior dimensions between body weight status of respondents.
Factors associated with body weight status
There were no significant associations between socio-demographic factors namely age, sex and ethnicity and body weight status. In order to run multiple linear regression analysis, associations between continuous variables and BMI were determined using Pearson Product-Moment Correlation (r). Based on Pearson Product-Moment Correlation (r), energy intake was found to be weakly correlated with body mass index (BMI) (r = 0.153, P < 0.05). Conversely, energy ratio from carbohydrate (r = -0.105, P > 0.05), protein (r = 0.022, P > 0.05) and fat (r = 0.132, P > 0.05) were not correlated with BMI. On the other hand, there was a strong significant correlation between energy expenditure and BMI (r = 0.747, P < 0.05). However, when body weight was taken into consideration in energy expenditure calculation, no significant correlation was found between energy expenditure per kg body weight and BMI (r = 0.057, P > 0.05). It was also found that physical activity was positively and moderately correlated with BMI (r = 0.463, P < 0.05). Additionally, composite score of MBIS was moderately correlated with BMI (r = 0.424, P < 0.05), indicating negative body image was correlated with overweight and obesity in adolescents. In the stepwise regression model, three variables were found to be significant in explaining body weight status (Table 6). Physical activity (R2 = 0.213, B = 5.346, P < 0.01), body image (R2 = 0.136, B = 0.209, P < 0.01) and energy intake (R2 = 0.02, B = 0.001, P < 0.01) contributed significantly to overweight and obesity in adolescents (R2 = 0.369, F = 41.865, P < 0.01). The R-square of 0.369 indicated that about 36.9% of the variances in body weight status were explained by physical activity, body image and energy intake. In other words, high physical activity, negative body image and high energy intake were correlated with overweight and obesity among adolescents.
Discussion
Malnutrition problems, particularly overweight and underweight were both reported among adolescent boys and girls in Kajang, Selangor. The prevalence of overweight and obesity among adolescents (19.5%) was about twice the prevalence of underweight (10.5%). The prevalence of overweight and obesity among adolescents in this study was almost similar or higher compared to other studies conducted among adolescents in Malaysia [17-20].
This study found that total daily energy intake was associated with BMI. This finding was consistent with several studies where energy intake was positively associated with obesity [19,28-31]. Similar to a local study, Zalilah et al. [19] stated that total energy intake was higher among overweight adolescents as compared to their normal counterparts. A prospective study among adolescents found that increase in energy intake was associated with increase in BMI after one year [31]. Rapid urbanization and changes in the environment result in exposure to wide variety of foods among population. Over a past few decades, energy intake of adolescents had increased due to increased in the consumption of animal products, soft-drink, fast food and salty snacks and decreased in the intakes of complex carbohydrate, fruits and vegetables [32-35]. Changes in the dietary pattern together with decreased in the physical activity were associated with increased in the prevalence of overweight and obesity worldwide. The National Coordinating Committee on Food and Nutrition of Malaysia recommended that carbohydrates should contribute 55-75%, fat 20-30% and proteins 10-15% to total daily energy intake [27]. In the present study, the total energy intake of all respondents had less than 55% from carbohydrate and more than 30% from fat. This indicated that the male and female respondents in this study consumed a low in carbohydrate but high in fat diet. However, ratio of the macronutrients to total energy intake were not associated with BMI. In other words, high total energy intake was associated with overweight and obesity regardless of its macronutrient proportion.
Meal skipping was prevalent (72.3%) among adolescents in this study and it was consistent with several other studies [22,36]. The most frequent missed meal among adolescents in this study was breakfast (55.7%). Several local studies also reported that breakfast was the most frequent missed meal among Malaysian adolescents [22,36]. Reasons given by adolescents for skipping breakfast include time constraint, overslept and no appetite [37]. Breakfast skipping was also related to disordered eating such as dieting behaviors and weight lost strategy among adolescents [38]. Additionally, more than half (56.2%) of the respondents snacked between meals daily. Findings from Chin and Mohd [22] also reported that half (51.4%) of the adolescent girls snacked between meals daily. Snacking plays important role in replenishing energy needs since meal skipping was prevalent among Malaysian adolescents. When compared to body weight status of the adolescents, both meal skipping and snacking behaviors were not significantly contributed to overweight and obesity problems. A qualitative study is needed to explore the phenomenon of disordered eating behaviors of Malaysian adolescents, including reasons of meal skipping, particularly breakfast.
Our findings showed that high BMI was associated with high energy expenditure. This was in line with Hassapidou et al. [39] whereby overweight adolescents had significantly higher energy expenditure compared to normal weight adolescents. Similarly, local study reported that energy expenditure was significantly higher among overweight compared to normal weight adolescents [19]. High energy expenditure among overweight and obese respondents may be due to the increased requirement of energy for them to perform similar activity compared to adolescents with lower body weight [40]. In other words, even though overweight and obese adolescents spend more energy for physical activity compared to non overweight, it does not necessarily mean they are more active than their counterparts. However when body weight was controlled, no significant association was found between energy expenditure per kg body weight and BMI. Other likelihood of higher energy expenditure among overweight and obese respondents is due to misreporting of time spent and intensity of physical activity performed that will results in overestimation of physical activity-associated energy expenditure [41].
Based on the physical activity level, only a small proportion of respondents (8.2%) were engaged in moderate and vigorous physical activity level and it was consistent with other study among adolescents in Malaysia [42]. In this study, adolescents with high BMI were more likely to be physically active than normal-weight counterparts. Overweight and obese adolescents in this study may have engaged in some forms of weight loss methods such as exercising. Exercise is known to be one of the most common weight loss strategies [19]. However, the current study was unable to assess the involvement of weight loss practices in this group of adolescents. These respondents might also have been exposed to some forms of health and nutrition education information that educate them to practice active lifestyle to control their body weight status.
This study reported that composite score of MBIS was significantly correlated with BMI. Based on the dimensions of body image, overweight and obese respondents were more likely to be dissatisfied with their appearance and body, perceived themselves as having a bigger body size and shape, preoccupied with the thin ideal figure and engaged in dieting behavior than their counterparts. Consistent with previous studies, negative body image such as incorrect perception of body size, desired to be thin and body dissatisfaction was associated with overweight and obesity [15,26,43]. For instance, a longitudinal study by Mooney et al. [15] depicted that female adolescents who have body dissatisfaction were about 1.02 times to be at-risk of being overweight 5 years later [15]. In other words, adolescents who have negative body image were more likely to encounter overweight and obesity problems. Enhancing positive body image is needed to be included as one of the major components of healthy body weight management for adolescents.
Based on our findings, physical activity, body image and energy intake contributed to 36.9% of variances in body weight status among adolescents. Physical activity contributed the most (21.3%) towards overweight and obesity problem among respondents followed by body image (13.6%) and energy intake (2.0%). High energy intake, high physical activity and negative body image are common weight-related behaviors associated with overweight and obesity among adolescents. These adolescents may be at-risk of unhealthy weight loss practices that may jeopardize their health and development.
There were several limitations in this study that should be taken into consideration. This cross-sectional study lacks the ability to show cause and effect relationships. Besides, results from this study were not able to reflect the generalization of the whole adolescent population in Malaysia as it involved only adolescents in a selected district. Most of the data were self-reported, causing the possibility of self-report bias. This study used a two-day dietary record and two-day physical activity record to assess energy intake, energy expenditure and physical activity, respectively. It relied very much on respondents' cooperation to record their daily food intake and physical activity. Meanwhile, requesting respondents to record a two days detailed food intakes and physical activity may cause respondents to lose patience and tend to simplify their recording process including reduced amount, types, and frequency of food and snacks eaten or types and durations of activities performed. Hence, respondents may under-report or over-report their daily energy intake and energy expenditure [19].
In conclusion, the current study shows that the prevalence of overweight and obesity was high among adolescents. High energy intake, high physical activity and negative body image are common weight-related behaviors associated with overweight and obesity among adolescents. It is recommended that the components of dietary practices, physical activity, and body image should be incorporated in future health intervention programs for Malaysian adolescents.


 XML Download