

 PDF
PDF ePub
ePub Citation
 Print
Print


Introduction
Obesity has been a major health concern worldwide, and the World Health Organization estimated that approximately 1.5 billion adults were overweight and that over 200 million men and nearly 300 million women were obese in 2008. The National Health and Nutrition Examination Survey of Korea has also reported that 34.0% of the population is either overweight or obese, raising a serious health hazard. Major metabolic disturbances due to excess body fat include insulin resistance, which is characterized by the impeded capacity of peripheral tissues to utilize glucose effectively [1], causing hyperglycemia and hyperinsulinemia. Increased circulating concentration of insulin also result in changes in lipid metabolism, cell growth, and cell-to-cell communication [2] which eventually lead to obesity-related disease development.
The glycemic index (GI) was introduced to classify starchy foods according to their effect on postprandial glycemia [3]. Later, the glycemic load (GL) concept was introduced reflecting the quality (GI) and quantity of a specific food consumed that affect postprandial glycemic response [4]. Both low GI foods and low GL diets have been successfully applied to alleviate hyperglycemic and hyperinsulinemic conditions in prediabetic and diabetic individuals. Besides GI and GL, a growing body of research has focused on functional substances inhibiting carbohydrate digestion enzymes [5-6].
Previous preliminary studies have indicated that several monosaccharides act as glucosidase inhibitors [7-8]. D-xylose at a 10 mmol/L concentration inhibits intestinal sucrase activity by 52.1% [8]. Rats fed a combination of sucrose (2 g/kg) and xylose (0.1 g/kg) solution have significantly reduced postprandial blood glucose concentrations at 30 and 60 min compared to those of rats fed a sucrose solution alone [9]. One small-scale human study (n = 5) showed the efficacy of xylose to suppress the increase in postprandial blood glucose in which healthy males showed lowered postprandial blood levels glucose and insulin at 30 min after consuming the solution containing xylose (7.5 g) mixed with, 75 g of sucrose compared to levels after consuming a 100% sucrose solution. However, no significant difference was observed in blood glucose or insulin concentrations for the remaining time points. Gruzman et al. [10] reported that D-xylose increases the rate of glucose transport in a non-insulin-dependent manner in rats and human myotubes in vitro. These results suggest that xylose may be a good candidate functional food to control the postprandial blood glucose and insulin surges and possibly alleviate metabolic disturbances.
Previous studies have reported that diet composition particularly quantitatively important macronutrients influence postprandial glycemia by affecting the rate of carbohydrate digestion and absorption. Dietary fat, carbohydrate, and protein in a single meal interact with each other to influence the rate of absorption [11]. Therefore, digestive enzyme inhibitors such as xylose may act differently when they are used as ingredients of specific food products.
Thus, the objectives of this study were to assess the inhibitory effects of two different concentrations of xylose on postprandial serum glucose and insulin concentrations in a large group of healthy human subjects and to evaluate its efficacy in the form of a food product.
Subjects and Methods
Subjects
Forty-nine subjects (25 males and 24 females) participated in study 1. Their average age was 35.4 ± 6.4 years (range, 25-49 years), and their body mass index was 23.8 ± 3.0 kg/m2. In study 2, 50 subjects (24 males and 26 females) participated. Their average age was 33.7 ± 6.0 years (range, 25-49 years), and their body mass index was 23.9 ± 3.2 kg/m2. The study subjects were recruited from a university website advertisement based on the following criteria: (1) fasting serum glucose < 7 mmol/L; (2) absence of any disease; (3) under no medications or dietary supplements; and (4) non-pregnant women. Thirty subjects (13 males and 17 females) were enrolled in both studies. This study was approved by the Institutional Review Board of Sookmyung Women's University (SM-IRB-11-0217-001), and eligible subjects gave informed written consent.
Sample size was calculated based on a previous clinical trial [12-14], and a 1.0 mmol/L reduction in the peak glucose concentration during the oral glucose tolerance test (OGTT) was considered to be the primary efficacy point with the average standard deviation (SD) of 1.2 mmol/L at a two-tailed alpha = 0.05 and 1-β = 80%.
Study design
Study 1
This study used a randomized double-blind three treatment cross-over design. The overnight fasted study subjects visited the trial center at the university once per week for 3 weeks and consumed a test sucrose solution (50 g sucrose in 130 ml water) containing 0, 5, or 7.5 g D-xylose powder each week in random order. Xylose concentrations were determined based on a previous report in which xylose mixed with sucrose at a 10% level showed a delay in glucose absorption [9]. Study subjects were asked to maintain their usual dietary and physical activity habits throughout the study. No significant differences in nutrient intake were observed (by 24-recall method) between visits (data not shown).
Study 2
Study 2 was conducted as a randomized double-blind two treatment cross-over trial. The overnight-fasted study subjects visited the trial center once per week for 2 weeks and consumed a test meal in a given time (10 min) in random order. The test meal consisted of a muffin (60 g) and a sucrose-containing solution (200 ml). The control meal provided 64.5 g of carbohydrates (sucrose 50 g), 4.5 g of fat, and 10 g of protein. The xylose meal was identical to the control meal except 5 g of D-xylose was additionally added to the muffin mix. Study subjects were asked to maintain their usual dietary habits and physical activity level throughout the study. No significant differences in nutrient intake were observed (by 24-recall method) between visits (data not shown).
Blood analyses
A cannula was placed in the antecubital vein and blood samples were taken at the following times: 0, 15, 30, 45, 60, 90, and 120 minutes after taking the test solution or meal. The samples were left at room temperature for 30 min, centrifuged for 15 min at 2,500 rpm to separate the serum, and then stored at -70℃. Serum glucose concentrations were measured using the Pureauto S GLU reagent (Daiichi Pure Chemicals, Tokyo, Japan). Insulin was measured by electrochemiluminescence immunoassay (Roche Diagnostics GmbH, Mannheim, Germany). Serum glucose and insulin were measured at every time point (0, 15, 30, 45, 60, 90, and 120 minutes) after taking the test solution or meal, and the blood glycated hemoglobin (HbA1c), serum total cholesterol, triglyceride, and high density lipoprotein (HDL)-cholesterol were measured at only one time point (0 minutes). Blood HbA1c was determined by high performance liquid chromatography. An autoanalyzer (Hitachi 747 auto-analyzer, Tokyo, Japan) was used to quantify blood concentrations of serum total cholesterol, triglyceride, and HDL-cholesterol. Serum low-density lipoprotein (LDL) cholesterol concentration was calculated according to the Friedewald formula [15].
Calculations and statistical analysis
All results are presented as mean ± SD. The areas under the glucose (AUCg) or insulin (AUCi) curves were calculated using the trapezoidal rule [16]. Statistical analyses were performed to compare the AUC of glucose and insulin and to compare concentrations of serum glucose and insulin between treatments at each time point. Differences were assessed using repeated-measure analysis of variance followed by Tukey's multiple comparisons test (study 1) or Student's paired t-test (study 2). The two-tailed significance threshold was set at P < 0.05. Statistical analyses were performed using SAS program version 9.1 (SAS Institute, Cary, NC, USA).
Results
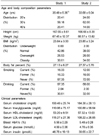
Body compositions and clinical parameters of the study participants at baseline of each study are shown in Table 1. In study 1, the proportion of individuals with dyslipidemia was 12.2% for cholesterol (reference range, ≥ 230 mg/dl), 8.2% for triglycerides (reference range, ≥ 200 mg/dl), and 4.1% for LDL-cholesterol (reference range, ≥ 150 mg/dl), and the proportion of the impaired fasting glucose individuals was 8.2% for glucose (reference range, fasting glucose ≥ 100 mg/dl and < 126 mg/dl). In study 2, the proportion of individuals with dyslipidemia was 4.0% for cholesterol (reference range, ≥ 230 mg/dl), 8.0% for triglycerides (reference range, ≥ 200 mg/dl), and 4.0% for LDL-cholesterol (reference range, ≥ 150 mg/dl). The proportion of individuals with impaired fasting glucose was 2.0% for glucose (reference range, fasting glucose, ≥ 100 mg/dl and < 126 mg/dl).
Study 1
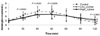
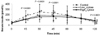
The postprandial glucose and insulin responses after ingestion of 50 g sucrose with 5 g (low) xylose, 7.5 g xylose (high), or control (sucrose only) are presented in Figs. 1 and 2. The concentrations of serum glucose at 15 min (P < 0.0001), 30 min (P < 0.0001), and 45 min (P = 0.0005) were significantly lower after consuming both concentrations of xylose-containing solutions compared to those after consuming the control solution. However, glucose concentration was significantly higher at 120 min for those who consumed the xylose-containing solution (P < 0.0001). Serum concentrations of insulin at 15 min (P < 0.0001), 30 min (P < 0.0001), and 45 min (P = 0.0001) were also significantly lower after consuming both concentrations of xylose-containing solution than those after consuming the control solution. However, the xylose-containing solution significantly increased serum insulin at 120 min (P < 0.0001) compared to that in the control solution. No differences were observed for postprandial serum glucose or insulin concentration at either 60 or 90 min.
The incremental area under the curve of postprandial serum glucose and insulin are shown in Tables 2 and 3. Xylose-containing solutions exhibited significantly lower AUCg values at 0-15 min (P < 0.0001), 0-30 min (P < 0.0001), 0-45 min (P < 0.0001), 0-60 min (P < 0.0001), and 0-90 min (P < 0.0001). However, the 0-120 min AUCg for in the 5 g xylose-supplemented solution was significantly lower than that of the control solution (P = 0.0071). The percent decreases in AUCg with 5 g xylose supplementation compared to those of the control were 47.3% (0-15 min), 39.9% (0-30 min), 35.5% (0-45 min), 32.3% (0-60 min), 26.2% (0-90 min), and 21.4% (0-120 min), respectively. Both 5 and 7.5 g xylose supplementation significantly reduced postprandial AUCi at 0-15 min (P < 0.0001), 0-30 min (P < 0.0001), 0-45 min (P < 0.0001), 0-60 min (P < 0.0001), 0-90 min (P < 0.0001), and 0-120 min (P = 0.0016). The percent decreases in AUCi with 5g xylose supplementation compared to those of the control were 45.2% (0-15 min), 39.2% (0-30 min), 35.2% (0-45 min), 30.7% (0-60 min), 24.5% (0-90 min), and 21.3% (0-120 min), respectively.
Study 2
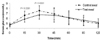
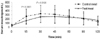
The mean postprandial serum glucose and insulin responses after ingestion of either the control meal or test meal are presented in Figs. 3 and 4. The concentrations of serum glucose at 15 min (P < 0.0001) and 30 min (P < 0.0001) after intake of the test meal were significantly lower than those after intake of the control meal. Additionally, the concentrations of insulin at 15 min (P < 0.0001) and 30 min (P = 0.0136) after intake of the test meal were significantly lower than those after intake of the control meal. No differences were observed for postprandial serum glucose or insulin concentrations at 45, 60, 90, or 120 min.
The incremental area under the curve of postprandial serum glucose and insulin are shown in Tables 4 and 5. The test meal significantly lowered AUCg values at 0-15 min (P < 0.0001), 0-30 min (P < 0.0001), 0-45 min (P < 0.0001), 0-60 min (P = 0.0002), and 0-90 min (P = 0.0396). The percent decreases in AUCg with the test meal compared to those of the control meal were 37.0% (0-15 min), 32.4% (0-30 min), 26.5% (0-45 min), 21.4% (0-60 min), and 12.8% (0-90 min), respectively. The test meal significantly reduced postprandial AUCi at 0-15 min (P < 0.0001), 0-30 min (P < 0.0001), 0-45 min (P = 0.0005), 0-60 min (P = 0.0025), and 0-90 min (P = 0.0246). The percent decreases in AUCi with a test meal compared to those of the control meal were 47.8% (0-15 min), 39.5% (0-30 min), 32.7% (0-45 min), 28.9% (0-60 min), and 21.5% (0-90 min), respectively.
Discussion
Two acute randomized double-blind cross-over studies were conducted to examine the effect of D-xylose on postprandial glucose and insulin responses following an OGTT. Xylose is classified as a monosaccharide of the aldopentose type containing five carbon atoms and an aldehyde functional group. It is a precursor to hemicellulose, one of the main constituents of biomass. Corn cob, coconut, seed hulls, and straw are rich sources of D-xylose. D-xylose has been suggested as a potent sucrase inhibitor possibly by suppressing the postprandial glucose surge; however, no concrete scientific evidence has been provided for its efficacy in humans.
Recent statistics indicate that a growing number of the population are either overweight or obese due to excess dietary energy intake, which promotes create insulin resistance. Evidence suggests that the initial pathophysiological changes during the progress of type 2 diabetes, cardiovascular heart diseases, and cancer are closely related to hyperinsulinemia, which lead to metabolic dysregulation. Post-challenge glucose levels of 108 mg/dL in mononuclear cells and monocytes results in a > two-fold elevation in reactive oxygen species [17]. High circulating levels of glucose can also generate glycation products from other important biological molecules that can cause undesirable functional and morphological changes [18]. In patients with type 2 diabetes, postmeal hyperglycemia induces diabetic complications [19]. Therefore, the homeostatic control of blood insulin and glucose possibly by regulating glucose absorption from the gut has been implicated as an important intervention target to suppress abnormal metabolic changes and prevent disease development.
The GIs of various carbohydrate foods have been determined to develop a dietary means to control postprandial blood glucose. The GI is the increase in the area under the blood glucose curve produced by a standard amount of carbohydrate in a food, usually 50 g, relative to the area of increase produced by the same amount of carbohydrate from a standard source, usually white bread or glucose [16]. A low GI diet and low GI food intake delays or reduced rapid increases in blood glucose and improves insulin sensitivity. Elevated postprandial glucose excursions may increase the risk for cardiovascular disease even in nondiabetic persons [20]. Additionally, high GI diets have been associated with the development of insulin resistance [21], cardiovascular disease [22-23], and type 2 diabetes [24]. Thus, it is important to delay the rapid increase in blood glucose to improve insulin response and prevent other chronic metabolic diseases.
Not only the diet itself but functional substances including different types of dietary fiber and monosaccharides have been developed to control postprandial glucose and insulin excursions. A recent human intervention trial using L-arabinose as a sucrase inhibitor indicated that a 75 g sucrose challenge supplemented with 4% w/w L-arabinose produces an 11% lower glucose peak and a 33% lower and delayed insulin peak [25]. A 23% reduction in the increase in the AUCi was also observed. In the present study, 5 g or 7.5 g xylose supplementation during a 50 g oral sucrose challenge effectively reduced serum glucose and insulin increases, and glucose absorption was delayed. D-Xylose possesses similar sucrase inhibitory activity as L-arabinose in vitro [26]. The 21.4% reduction in AUCg at 0-120 min and the 21.3% reduction in AUCi at 0-120 min after subjects ingested D-xylose as observed in the present study are close to a previous report on the efficacy of L-arabinose [26]. An earlier study indicated that 80% inhibition of sucrase activity is required to reduce the glycemic response by 50% following treatment with castanosperminem, an established strong sucrase inhibitor, suggesting the sucrase inhibition activity may partly explain the reduction in the glucose response. However, no adaptive response to sucrose digestion was observed after a long-term (14 days) treatment, indicating that sucrase blockers may be safely used as functional substances for glucose homeostatic control. The present study showed no dose-response inhibitory activity, suggesting that there may be an optimal dose to inhibit enzyme activity. The manner of sucrase inhibition by D-xylose has not been previously reported, whereas L-arcabose selectively inhibits sucrose activity in an noncompetitive manner with dose-responsive efficacy [8]. Therefore, further kinetics studies are required to understand the mechanism of enzyme inhibition.
Because xylose is a sucrase inhibitor, it may be useful as a functional ingredient in sugar or other sucrose-rich food products to inhibit the blood glucose rise. In our second study we supplemented muffins with xylose to examine if xylose sustains its activity in a food matrix with large proportions of protein and fat. Previous studies have suggested that dietary protein increases insulin secretion and lowers blood glucose [11]. Additionally, the initial glycemic response is reduced after consuming a meal with higher fat content [27]. These results suggest that xylose supplemented in a meal with high fat or protein may not exert an identical effect as when supplemented in a sucrose solution. The results showed that a xylose-supplemented meal effectively reduced postprandial serum glucose and insulin responses; however, the extent of suppression was smaller than that of a xylose-supplemented solution. Xylose supplementation maintained its inhibitory activity up to 60 min for both AUCg and AUCi, and the increases in AUCg and AUCi at 0-120 min were reduced by 6.7% and 15.2 %, respectively. Previous studies have suggested that dietary protein increases insulin secretion and lowers blood glucose [11]. A shortened effectiveness may be explained by the presence of a higher amount of carbohydrate in test meals in study 2 compared to that in study 1 (65 g vs. 50 g) and/or the presence of starch in the test muffin, which may have less opportunity to counteract the sucrase inhibitor in a given time. As xylose is a sucrase inhibitor, it possesses no inhibitory effect on other carbohydrate digestive enzymes [9]. Several natural dietary substances have been tested for their inhibitory effects on the absorption of starch and sucrose in rats and pigs [28]. L-arabinose is effective for reducing postprandial blood glucose only after a sucrose challenge, but not with a rice starch challenge, whereas bean extract and hibiscus extract were more effective for reducing postprandial blood glucose after a rice starch challenge indicating that each substance may have different specificity to different carbohydrate digestive enzymes. We used a high-fat containing muffin as a test meal as opposed to a sucrose solution to observe possible changes in blood glucose responses due to high-fat content. Because we did not observe a significant difference except a loss of difference in AUCg and AUCi at one time interval (0-120 min), it was assumed that there was not a great deal of interaction between macronutrients and xylose. Further studies using different foods and food products are necessary to confirm the efficacy of xylose for postprandial glucose control.
In conclusion, the present study indicated that coconut-derived D-xylose favorably affected postprandial glucose and insulin response when used as a supplement with sucrose. As repeated glucose and insulin excursions are closely related to metabolic stress, the proper application of xylose in different sucrose-based products may lessen the undesired effects of sucrose.


 XML Download