

 PDF
PDF ePub
ePub Citation
 Print
Print


Introduction
Obesity is characterized by excess body fat accumulation, in which there is a shift in the homeostatic balance between cellular lipogenic and lipolytic activities [1]. The liver plays an important role in various aspects of lipid metabolism and fat accumulation. Because fatty liver is closely associated with obesity-related physiological features, including hyperlipidemia, hyperglycemia, and hepatic lipid accumulation [2], hepatic triglyceride (TG) synthesis is an important factor in the development of obesity. Fatty acids are key substrates for TG synthesis. Among several fatty acids, palmitoleate (C16:1) and oleate (C18:1) are considered major substrates for TG synthesis [3]. Stearoyl-CoA desaturase 1 (SCD1), which catalyzes the conversion of palmitate (C16:0) and stearate (C18:0) to palmitoleate (C16:1) and oleate (C18:1), respectively, is upregulated in obese humans and animals [4]. Moreover, the high ratio of monounsaturated to saturated fatty acid (C16:1/C16:0 and C18:1/C18:0) has been used as an index of obesity-related hyperlipidemia [5]. Therefore, measuring these lipogenesis- and lipolysis-related gene parameters and fatty acid composition will help elucidate the role of the liver in obesity development.
Several human studies have clearly shown that consumption of high levels of whole grain foods negatively correlates with a low incidence of obesity and related chronic diseases. Whole grains contain high fiber and essential nutrients, as well as phytochemicals such as polyphenols, sulfur compounds, and betaine [6]. Whole grains such as foxtail millet, hog millet, sorghum, Job's tears, and barley have been used as ingredients in traditional Korean food. In a preliminary study by our group, hog millet (Panicum miliaceum L.) extract showed the highest anti-adipogenic activity by effectively inhibiting lipid synthesis, as measured by lipid-detecting Oil Red O staining, among extracts of nine types of cereal grains in a 3T3-L1 cell system [7].
In this study, we hypothesized that adding P. miliaceum L. extract (PME) to food would lead to weight loss and a decreased incidence of hyperlipidemia by regulating fatty acid metabolism. To test this hypothesis, we examined the effects of PME consumption on changes in obesity-related biomarkers, hepatic fatty acid metabolism-related gene expression, and white adipose tissue (WAT) fatty acid composition in normally obese C57BL/6J-ob/ob mice. The results confirmed the hypothesis.
Materials and Methods
Preparation of P. miliaceum L. extract
P. miliaceum L. was obtained from the National Agricultural Cooperative Federation (Shinlim, Wonju, Korea). The millet was ground into fine powder (50 g), which was ultrasonically extracted twice with 500 mL hot water for 3 h at room temperature. The preliminary extract was then concentrated at 80℃ in a rotator vacuum evaporator (EYELA N-1000, Tokyo Riakikai Co. Ltd., Japan). The final extract was subsequently freeze-dried and stored at -70℃. PME yield was 5.3%.
Animals and study design
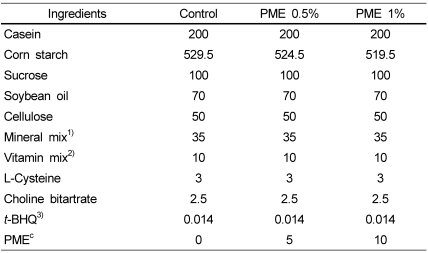
Male leptin-deficient (C57BL/6J-ob/ob) mice and their counterpart C57BL/6J lean mice controls were purchased at 5 weeks of age from Jung-Ang Lab Animal Inc. (Seoul, Korea). The mice were housed two per cage in air-conditioned quarters with 12-h light/dark cycles. The animals were acclimated to the laboratory environment for 2 weeks and were then divided into four groups (n = 10 per group) based on their body weights: two groups (lean and ob/ob control groups) were fed the AIN-93G control diet [8], and two groups were fed the PME-supplemented AIN-93G diets (0.5% and 1.0%, respectively). The respective composition of the experimental diets is shown in Table 1. After 4 weeks, the mice were anesthetized with light ether, and blood and tissues (liver and white adipose tissue) were collected. During the experimental period, animals had free access to water and food, and their body weights and food intake were measured twice weekly. The experimental design was approved by the National Academy of Agricultural Science, RDA (Approved No. NAAS 1003).
Preparation of blood and tissue samples
Serum was separated by centrifuging whole blood at 2,000 × g for 20 min and stored at -70℃ until assay. Liver and WAT (epididymal and peripheral WAT) were rinsed, weighed, frozen on dry ice, and stored at -70℃.
Blood lipid assays
Serum TG, total cholesterol (T-CHO), and high-density lipoprotein cholesterol (HDL) were determined using commercial assay kits (Asan Pharm., Seoul, Korea) according to the manufacturer's protocols.
Intraperitoneal glucose tolerance test
At the end of the 4-week diet protocol, an intraperitoneal glucose tolerance test (IGTT) was performed without anesthesia after an overnight (16 h) fast. Mice were fasted overnight to establish baseline glucose levels at time zero (0 min). Mice were weighed and then received an intraperitoneal injection of 2 g glucose/kg body weight. Subsequent blood samples were taken from the tail at 0, 30, 60, and 120 min after the glucose injection. Serum glucose was measured using an OneTouch Ultra Glucose Analyzer (LifeScan, Inc., Milpitas, CA, USA). Areas under the curve (AUCs) obtained from glucose measurements during the IGTT were used to reflect whole body glucose tolerance in this study.
Hematoxylin and eosin staining of liver and WAT sections
Mice livers and WAT tissues were fixed in 10% buffered formalin solution immediately after harvest. The tissues were then dehydrated in ethanol, embedded in paraffin wax, sectioned, and stained with hematoxylin and eosin.
Serum insulin and inflammatory cytokine measurements
Serum insulin was measured with an enzyme-linked immunosorbent assay (ELISA) kit according to the manufacturer's protocol (Millipore, Corp., Billerica, MA, USA). Serum tumor necrosis-α (TNF-α), interleukin-6 (IL-6), and monocyte chemotactic protein-1 (MCP-1) were measured using ELISA kits (R&D Systems, Inc., Minneapolis, MN, USA) according to the manufacturer's protocol.
Fatty acid analysis
The fatty acid composition of WAT was analyzed using the method of Roberts et al. [9]. For fatty acid analysis, the lipid layer was obtained from the RNA isolation step. Methyl esters of total fatty acids were obtained by a reaction on a Techne DB-3D heating block (Barloworld Scientific US Ltd., Burlington, NJ, USA) using BF3 as a catalyst. A 20 mg aliquot of the oil sample was boiled with 2 mL methanolic sodium hydroxide (0.5 M) at 100℃ for 5 min on the heating block. The BF3 reagent (2 mL) was added and boiled for an additional 5 min. Hexane (1 mL) and a saturated sodium chloride solution (2 mL) was added and vortexed for 1 min. The hexane layer was transferred to a vial for subsequent gas chromatography analysis. Fatty acid methyl esters were identified by gas chromatography (Varian, CP-3800 GC, Australia) equipped with a flame ionization detector (FID) and an HP-FFAP capillary column (30 m × 0.32 mm I.D. × 0.25 µm film thickness; Agilent Technologies, Santa Clara, CA, USA). The injector temperature was 230℃ with a split ratio of 10:1; the FID temperature was 250℃. The oven temperature ran a program of 100℃ for 1 min, followed by an incremental temperature increase from 100℃ to 230℃ at a rate of 3℃ per minute, and finally a 230℃ step for 10 min. Helium was used as the carrier gas with a constant flow rate of 1.0 mL/min and injection volume was 1 µL. The hydrogen flow rate to the detector was 40 mL/min, the air flow rate was 300 mL/min, and the helium make-up gas flow rate was 20 mL/min.
RNA isolation and real-time reverse transcription polymerase chain reaction (RT-PCR)
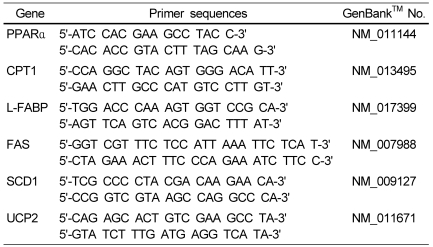
Total RNA was isolated from mouse liver tissues using Trizol reagent (Invitrogen, Carlsbad, CA, USA) following the manufacturer's recommendations. Real-time quantitative PCR was performed with a SYBR Green kit (Quantitect™ SYBR Green PCR, Qiagen, Valencia, CA, USA). The cycling conditions were 15 min at 95℃, followed by 40 cycles of 15 s at 94℃, 30 s at 45℃, and 30 s at 72℃. Melting curves were analyzed for each reaction, and each primer set was determined to produce a single PCR product. Relative quantification was calculated using the delta-delta Ct (cycle threshold) method [10]. The sequences of the primers for the genes examined are shown in Table 2.
Results
1% PME-supplemented diet suppressed weight gain and WAT accumulation in obese ob/ob mice
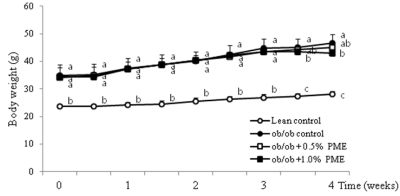
Based on our previous study showing that PME inhibited fatty acid synthesis in vitro, we hypothesized that PME in the diet might inhibit weight gain in vivo. To determine whether a PME-supplemented diet could reduce weight gain in obese ob/ob mice, we fed these animals a diet supplemented with 1% PME and monitored weight gain as well as epididymal and peripheral WAT accumulation. At the onset of the study, the ob/ob mice weighed 48.39% more than their counterpart lean mice (Fig. 1, P < 0.05). Starting at week 4, the average body weight gain of mice fed the 1% PME diet was lower than the weight gain noted in the control ob/ob mice, however, no significant difference was observed in the 0.5% PME diet group (Fig. 1, P < 0.05). The liver and WAT weights of mice fed the 1% PME diet were significantly lower by 24.52% and 22.28%, respectively, compared to those in obese ob/ob control mice (Table 3, P < 0.05). This result indicated that PME was able to inhibit weight gain and WAT accumulation experienced by obese ob/ob mice on a normal diet.
Obesity-induced hyperglycemia and hyperinsulinemia decreased in ob/ob mice fed a 1% PME-supplemented diet
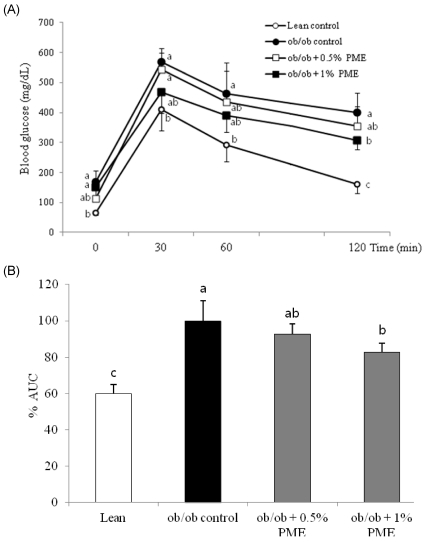
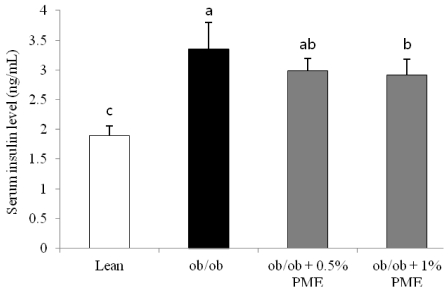
Because we observed that PME inhibited weight gain, we next determined whether PME could also inhibit the hyperglycemia and high insulin levels associated with obesity in obese ob/ob mice. Therefore, we conducted an IGTT assessment after 4 weeks of PME treatment. The basal fasting blood glucose level in the control lean mice was 65.1 ± 3.5 mg/dL compared to 168.17 ± 30.36 mg/dL in the control ob/ob mice on the normal diet, indicating severe hyperglycemia in the ob/ob mice. We found that PME treatment significantly lowered mean plasma glucose concentrations at 120 min after glucose administration (2 g/kg BW) compared with those in the ob/ob control mice on a normal diet (Fig. 2A, P < 0.05). The AUC for glucose in mice fed the 1% PME diet also showed a decrease of 18.19% compared to that in the ob/ob control mice (Fig. 2B, P < 0.05). These data indicate improved glucose tolerance in the obese mice fed the 1% PME diet. Serum insulin concentrations in mice decreased by 13.13% compared to those in ob/ob control mice (Fig. 3, P < 0.05). Taken together, these data indicate that feeding ob/ob mice the 1% PME diet improved glucose tolerance and hyperinsulinemia compared to those in mice fed the normal diet.
PME diet decreased obesity-associated blood lipid levels
To determine whether the PME-supplemented diet could regulate lipid levels in the blood, we measured TG, T-CHO, and HDL in ob/ob mice fed PME as compared to the normal diet. As compared to lean C57BL/6J mice, the obese ob/ob control mice exhibited higher concentrations of both TG and T-CHO but lower concentrations of HDL (Table 3, P < 0.05), as expected from previous studies. However, treatment with the 1% PME diet reduced the levels of serum TG and T-CHO by 19.50% and 16.22%, respectively, compared to those in the obese ob/ob control mice (Table 3, P < 0.05). The 1% PME diet was also able to increase HDL concentration by 25.92% compared to that in the ob/ob control mice (Table 3, P < 0.05). These results indicate that PME reduced the levels of obesity-associated lipids released into the blood.
PME-supplemented diet reduces tissue lipid accumulation in liver and WAT
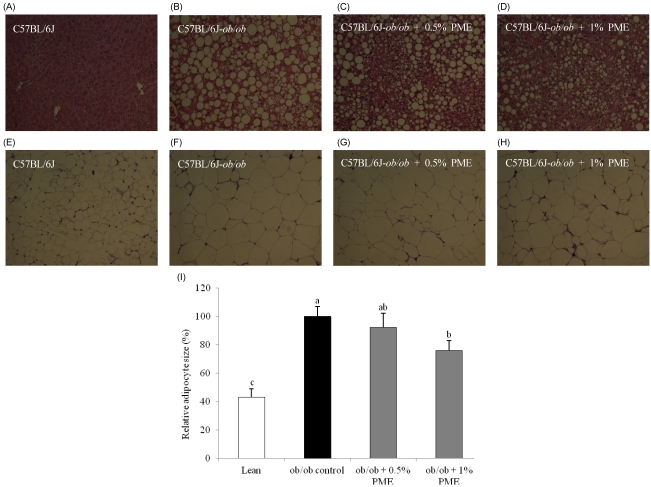
Because we observed lower levels of obesity-associated lipids in the bloodstream of ob/ob mice treated with 1% PME-supplemented diet, we wondered whether that would translate into decreased lipid accumulation in the liver and WAT. Thus, the lipid accumulation in the liver and WAT of mice was observed by optical microscopy (Fig. 4). The livers of the C57BL/6J-ob/ob mice on a normal diet had numerous lipid droplets as compared to those in the lean mice (C57BL/6J) controls. In contrast, smaller and fewer lipid droplets were present in the liver sections from PME-fed ob/ob mice (Fig. 4A-D) than those in the control mice. Moreover, the size of the adipocytes in the WAT of mice fed the 1% PME diet was smaller than that in the ob/ob control group (Fig. 4E-I). These results indicate that hypertrophy of adipocytes decreased in the PME groups, and that the PME-induced reduction in fat mass was partly due to a decrease in adipocyte size.
PME-supplemented diet inhibited the synthesis of obesity-related monounsaturated fatty acids in WAT
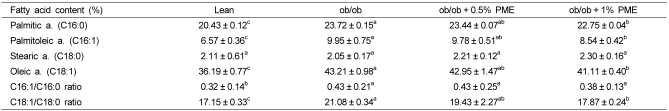
The fatty acid desaturation index (C16:1/C16:0 and C18:1/C18:0) increases in adipose tissue of obese rat models [11]. We determined whether the PME diet could decrease the relative amount of saturated fatty acids that accumulate in WAT, which are associated with obesity. We found that the 1% PME diet significantly decreased the levels of palmitoleic acid (C16:1) and oleic acid (C18:1). This was then reflected in a decrease in the desaturation index (Table 4). The 18:1/18:0 ratio was reduced by 15.23% in the 1% PME diet group mice compared to that in the ob/ob control mice (Table 4, P < 0.05). Palmitic acid (C16:0) is produced during monounsaturated fatty acids synthesis; both stearic acid (C18:0) and oleic acid (C18:1) are potential end products of palmitic acid (C16:0) synthesis [9]. Our data also showed that both palmitic acid (C16:0) and oleic acid (C18:1) contents decreased effectively by the 1% PME diet compared to those in the ob/ob control mice (Table 4, P < 0.05). These data indicate that the PME diet effectively downregulated monounsaturated fatty acid synthesis, thereby inhibiting a major step in the lipogenesis process.
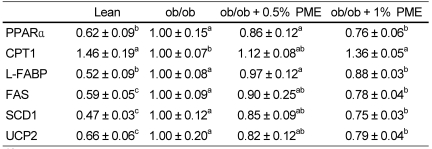
Lipogenic and lipolytic genes in the liver were altered by the PME-supplemented diet
We determined the hepatic expression of genes involved in lipogenesis and lipolysis to determine whether the expression of lipogenic and lipolytic genes involved in fatty acid synthesis were altered in the livers of mice treated with PME. We found that the lipogenic genes, peroxisome proliferator-activated receptor α (PPARα), liver-fatty acid binding protein (L-FABP), SCD1, and fatty acid synthase (FAS), decreased significantly in mice fed the 1% PME diet compared to those in the obese ob/ob control mice (Table 5, P < 0.05). Collectively, these genes promote de novo monounsaturated fatty acid synthesis. Therefore, these data indicate that PME is involved in regulating genes that dampen the synthesis of fatty acids by inhibiting these lipogenic genes. In contrast, the lipolytic gene carnitine palmitoyltransferase 1 (CPT1), a key enzyme in the mitochondrial beta-oxidation of fatty acids, increased significantly by 36.24% in the mice fed the 1% PME diet compared to that in the ob/ob control mice, indicating that PME promotes genes involved in fatty acid metabolism (Table 5, P < 0.05). Furthermore, we found that the mRNA expression of uncoupling protein 2 (UCP2), which is involved in the mitochondrial energy balance and whose hepatic expression is increased in ob/ob mice [12], was effectively downregulated by the 1% PME diet compared to that in the ob/ob control mice (Table 5, P < 0.05). Taken together, these data show that consuming a diet supplemented with PME could inhibit fatty acid synthesis but enhance fatty acid oxidation in the liver tissue of ob/ob mice.
PME diet inhibited the production of obesity-associated proinflammatory cytokines and chemokines in serum
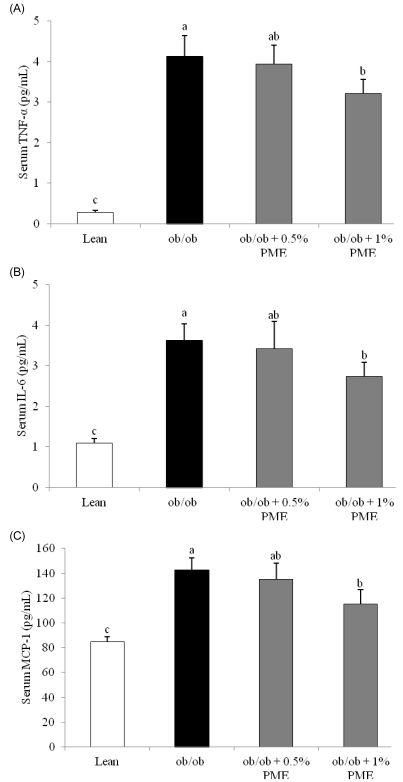
We measured serum MCP-1, TNF-α, and IL-6 levels to investigate whether supplementing the diet with 1% PME can modulate obesity-related inflammation. MCP-1 is an important chemokine for macrophage infiltration into adipose tissue, and tumor TNF-α and IL-6 are representative cytokines involved with obesity-related inflammation. As shown in Fig. 4, mice fed the 1% PME diet had significantly decreased serum levels of MCP-1, TNF-α, and IL-6, by 19.50%, 24.46%, and 24.52%, respectively, compared to those in ob/ob control mice (Fig. 5, P < 0.05). This result indicated that PME functions to inhibit the release of obesity-related pro-inflammatory cytokines.
Discussion
In this study, we investigated whether supplementing the diet with PME could control and reduce the weight gain observed in obese C57BL/6J-ob/ob mice. C57BL/6J-ob/ob mice have a point mutation in the leptin gene, which is a key weight control hormone. These leptin-deficient mice become grossly overweight at a young age and develop obesity-related disorders including hyperglycemia, hyperlipidemia, and hepatic lipid accumulation [13]. In this study, we demonstrated that the 1% PME-supplemented diet effectively inhibited lipid accumulation in the liver and ameliorated hyperlipidemia in C57BL/6J-ob/ob mice. This was the lowest effective dose, as no significant weight difference was observed in the lower dose 0.5% PME diet group.
We examined the mRNA expression of lipogenesis and lipolytic genes in the liver to elucidate the mechanism behind the 1% PME suppression of weight gain. We showed that the 1% PME diet decreased mRNA expression levels of L-FABP, PPARα, SCD1, and FAS lipogenic genes in the liver. L-FABP facilitates hepatic fatty acid uptake by incorporating long chain fatty acids into triacylglycerols during anabolic metabolism [14]. The transcription factor PPARα induces the expression of both fatty acid elongases (Elov-5 and Elov-6) and desaturases and facilitates monounsaturated fatty acid (C18:1) synthesis in C57BL/6J ob/ob mice [15]. SCD1, the rate-limiting enzyme in monounsaturated fatty acid biosynthesis, promotes the conversion of stearic acid (C18:0) to oleic acid (C18:1) during de novo lipogenesis [16]. Therefore, the elevated ratio of oleic (C18:1) to stearic acid (C18:0) observed in obese animals indicated that SCD activity must be high in these animals, and that 1% PME was able to inhibit this activity. Finally, FAS, a typical lipogenic enzyme, is upregulated in ob/ob mice [17,18], but its expression was inhibited by 1% PME. Interestingly, the levels of the fatty acids palmitic acid (C16:0), an end-product of monounsaturated fatty acid synthesis, and oleic acid (C18:1), a potential end-product of palmitic acid (C16:0), were also reduced in the 1% PME supplemented group compared to those in the obese ob/ob control group. This result correlated well with the down-regulation of hepatic L-FABP and PPARα mRNA expression. These data indicate that the PME diet decreased monounsaturated fatty acid synthesis by inhibiting fatty acid uptake and elongation-related gene expression. Moreover, both oleic acid (C18:1) content and the C18:1/C18:0 ratio in adipose tissue decreased significantly, and hepatic SCD1 and FAS mRNA expression were down-regulated in the 1% PME diet group compared those in the ob/ob control group. These results collectively suggest that the inhibitory effect of PME diet on hepatic lipogenic gene expression is one mechanism that PME uses to suppress lipid accumulation in the liver.
We demonstrated that the 1% PME diet inhibited the expression of lipogenic genes in the liver and also revealed that this diet promoted the expression of lipolytic genes involved in metabolizing fatty acids. We showed that the liver CPT1 mRNA expression level was elevated in the 1% PME-treated ob/ob mice. CPT1 is a mitochondrial transmembrane enzyme and is a rate-limiting enzyme for long-chain fatty acid entry into the mitochondria for β-oxidation [19-21]. This observation is consistent with the role of PME suppressing weight gain and suggests that PME could effectively regulate fatty acid metabolism in the liver by promoting fatty acid β-oxidation. Additionally, these effects may have been associated with reduced serum TG and cholesterol levels as well as adipose tissue weight gain and hepatic lipid accumulation in ob/ob mice.
An energy imbalance leads to obesity [22], and the liver plays a key role in the regulation of energy homeostasis [23]. UCP2 is a key regulator of energy balance and is highly expressed in fatty and steatotic livers. Indeed, UCP2 mRNA overexpression in liver tissue contributes to the obesity-related vulnerability to endotoxin liver damage [24]. In this study, we found that the 1% PME diet significantly inhibited the elevated hepatic UCP2 mRNA expression level observed in ob/ob obese mice on a normal diet. This result indicates that the PME diet contributed to restoring the energy homeostatic balance in ob/ob mice.
The mechanism underlying lipid accumulation in the body is partly associated with chronic low level inflammation, and elevated inflammation is a consistent feature of obese mice [25]. Chronic low level inflammation is characterized by activation of the nuclear factor-κB pathway and abnormal release of inflammatory factors including MCP-1, TNF-α, and IL-6. MCP-1 is a key chemokine that induces macrophage infiltration into adipose tissue; these recruited macrophages then release proinflammatory cytokines including TNF-α and IL-6. Both TNF-α and IL-6 stimulate an increase in the concentration of blood free fatty acids, which eventually leads to an increase in hepatic lipogenesis and contributes to hepatic lipid accumulation and hyperlipidemia [26]. In this study, we showed that while serum MCP-1, TNF-α, and IL-6 levels were dramatically elevated in ob/ob mice on a normal diet compared to those in lean mice controls, the ob/ob mice on the 1% PME diet demonstrated significantly decreased serum levels of these inflammatory cytokines compared to those in obese ob/ob mice on a normal diet. We speculate that this might be a direct effect of PME on macrophages, because we showed in our previous study that PME effectively inhibits gene expression and release of proinflammatory mediators from lipopolysaccharide-induced macrophages, including MCP-1, TNF-α, and IL-6, by downregulating IL-1 receptor associated kinase-4 (IRAK-4) signaling [27]. Interestingly, Rekhter et al. [28] reported that IRAK4 deficiency is associated with an inhibition of macrophage infiltration and lipid accumulation in vascular lesions. Thus, our data support that PME modulates cytokine release; therefore, this effect of PME could be a mechanism to explain how PME inhibited hyperlipidemia and hepatic lipid accumulation.
In summary, 1% PME-supplemented diet, but not 0.5%, ameliorated hyperlipidemia, hepatic lipid accumulation, and weight change in leptin-deficient C57BL/6J-ob/ob mice. Although the mediators actively responsible for the anti-obesity activity of PME were not identified in this study, our study showed that the beneficial effects of PME are related to the regulation of hepatic lipogenesis and lipolytic gene expression as well as an inhibition of cytokines and chemokine release. Overall, our study indicates that supplementing the diet with hog millet could be useful for treating obesity or obesity-related diseases and suggests a possible mechanism underlying how whole grains help to reduce obesity.

 XML Download