Journal List > Immune Netw > v.16(6) > 1033529

Sorrenti, Marenda, Fortinguerra, Cecchetto, Quartesan, Zorzi, Zusso, Giusti, and Buriani: Reference Values for a Panel of Cytokinergic and Regulatory Lymphocyte Subpopulations

Abstract

Lymphocyte subpopulations producing cytokines and exerting regulatory functions represent key immune elements. Given their reciprocal interdependency lymphocyte subpopulations are usually assayed as diagnostic panels, rather than single biomarkers for specialist clinical use. This retrospective analysis on lymphocyte subpopulations, analyzed over the last few years in an outpatient laboratory in Northeast Italy, contributes to the establishment of reference values for several regulatory lymphocytes currently lacking such reference ranges for the general population. Mean values and ranges in a sample of Caucasian patients (mean age 42±8,5 years), were provided for Th1, Th2, Th17, Th-reg, Tc-reg, Tc-CD57+ and B1 lymphocytes. The results are consistent with what is found in literature for the single subtypes and are: Th1 157.8±60.3/µl (7.3%±2.9); Th2 118.2±52.2/µl (5.4%±2.5); Th17 221.6±90.2/µl (10.5%±4.4); Th-reg 15.1±10.2/µl (0.7%±0.4); Tc-reg 5.8±4.7/µl (0.3%±0.2); Tc-CD57+ 103.7±114.1/µl (4.6%±4.7); B1 33.7±22.8/µl (1.5%±0.9); (Values are mean±SD). The results show that despite their variability, mean values are rather consistent in all age or sex groups and can be used as laboratory internal reference for this regulatory panel. Adding regulatory cells to lymphocyte subpopulations panels allows a more complete view of the state of the subject's immune network balance, thus improving the personalization and the “actionability” of diagnostic data in a systems medicine perspective.

Abbreviations

CBC

complete blood cell counts

Tc

T cytotoxic

NEU

neutrophils

LYMPH

lymphocytes

MONO

monocytes

EOS

eosinophils

BASO

basophils

INTRODUCTION

Lymphocyte subpopulations can be altered in most immune related diseases, and the investigation of such changes can offer an effective means to clearly assess the patient's health status, to monitor the course of a disease, or to evaluate the outcome of treatments (12). In clinical ambulatory practice, lymphocyte subpopulations are analyzed mainly in pathologies directly affecting the immune system, i.e. to monitor immunodeficiencies or lymphoproliferative diseases (3). However, there is growing interest in lymphocyte subpopulations analysis also in pathologies where the immune system is not the main system affected, but its activation or dysregulation can contribute to the onset or progression of a disease, like in many chronic and degenerative conditions (autoimmune diseases, CNS and peripheral neurodegenerative diseases, etc.) (4567891011).
Flow cytometric analysis of lymphocyte phenotypes is normally performed on major lymphocyte groups (12) and a further sub-characterization is usually not considered in the standard lymphocyte phenotyping routine despite known associations between other lymphocyte subsets and certain disease states (13141516). Addition of specific phenotypes can thus be performed if a particular immunologic condition is suspected. For example, T helper cells of Th1, Th2, Th17 and Treg phenotypes are known key players in the immune-inflammatory chain of molecular events leading to amplification or suppression of specific immune elements, orienting the immune response towards effective resolution or disease chronicization (1718), according to an equilibrium in which these same cells, through the production of specific cytokines, restrict each other's own activity (1920).
The recent personalized medicine approach, with its network view of biological systems, aims to more precisely define the individual characteristics, thus strengthening the “actionability” of diagnostic data and allowing better and more informed therapeutic choices (21222324). This approach has given momentum to the use of diagnostic homogeneous sets of biological information, highlighting the importance of using and extending diagnostic panels, where, like in the case of lymphocyte subpopulations, many pieces of a given biological function can be put together for a global view. Nevertheless, despite continuously growing knowledge about the specific role of lymphocyte cytokinergic and regulatory subpopulations, few specialized centers actually provide these analyses as panels on a routine base, a limitation possibly linked to some technical and analytical issues, especially when manipulation is needed for analyzing expression of intracellular cytokines. This issue today can be overcome by exploiting selective expression of chemokine receptors and other surface molecules on the outer lymphocyte membrane of Th1, Th2 and Th17 cells that allow a more rapid and less variable analysis. In particular, CD195 (CCR5) has been shown to be expressed by Th1 lymphocytes, while CD194 (CCR4) and CD161 are expressed by Th2 and Th17 lymphocytes respectively (25262728). However reference values for these and other regulatory subpopulations are still lacking, a further limiting factor itself for their widespread diagnostic application. The aim of this retrospective study is to contribute to the development of reference ranges for a panel of lymphocyte subpopulations used for clinical specialist applications (Th1, Th2, Th17, Th-reg, Tc-reg, Tc-CD57+ and B1 lymphocytes), and known to play a role in specific conditions, such as autoimmune and degenerative diseases, including those typical of the nervous systems (1011).

MATERIALS AND METHODS

Subjects and sample collection

Diagnostic data were retrospectively collected, pooled and analyzed from cytofluorimetric analysis of lymphocyte subpopulations of outpatient subjects referring to a community based laboratory facility in the Veneto Region in Northeast Italy, Data Medica Padova, from January 2015 to June 2016. Inclusion/exclusion criteria were applied as follows: registered cases of lymphocyte associated diseases (immunodeficiencies and lymphoproliferative disorders) were excluded from the study, as well as samples with values of total erythrocytes, total leukocytes, total lymphocytes, and major lymphocyte populations (T cells, Th, Tc and B lymphocytes) outside the normal range according to guidelines adopted by the laboratory (2930).
The facility is part of a group of private healthcare providers operating under agreement with the public healthcare system to deliver healthcare to the public. The center is also ISO9001 certified and accredited for excellence in healthcare by Accreditation Canada International. The retrospective observational study was carried out according to good practice in clinical research guidelines and, following national Italian legislation, registered and notified to the local reference Ethics Committee (ULSS16) with the code DM 2015/01.
Typically, peripheral blood samples were collected by venipuncture in the morning hours from subjects who had been fasting from the night before. Peripheral whole blood specimens were collected in EDTA tubes from all subjects which comprised outpatient from the general community. All blood specimens were subjected to complete blood cell counts (CBC) on the day of the collection for differential count determinations on an ADVIA 2120i Hematology System analyzer with its own reference ranges and reagents were all provided by Siemens as proprietary kits for the instrument (3132). Internal quality control checks which included runs of internal controls were performed daily, while calibration of the instrument was done at regular intervals.

Immunophenotyping of lymphocyte subsets with flow cytometry

Data from flow immunofluoricytometric analysis of lymphocyte subpopulations, acquired using a four fluorescence CyFlow Cube 8 flow cytomer (Sysmex-Partec®), were collected and analyzed. Routine analytical procedures were followed for immunofluorescent labeling before flow cytometry and phenotypes were identified according to manufacturer's instructions, using the following fluorescent antibodies: T3 lymphocytes: anti-CD3 PerCP (clone UCHT1); Th lymphocytes: anti-CD3 PerCP (clone UCHT1), anti-CD4 FITC (clone MT310); Th1 lymphocytes (Th CD195+) (2526): anti-CD3 APC (clone UCHT1), anti-CD4 FITC (clone MT310), anti-CD195 PE (clone R22/7); Th2 lymphocytes (Th CD194+) (2526): anti-CD3 APC (clone UCHT1), anti-CD4 FITC (clone MT310), anti-CD194 PerCP–eFluor710 (clone D8SEE ); Th17 lymphocytes (Th CD161+) (272833): anti-CD3 PerCP (clone UCHT1), anti-CD4 FITC (clone MT310), anti-CD161 PE (clone DX12 ); Th-reg lymphocytes (3435): anti-CD4 FITC (clone RPA-T4), anti-CD25 PE (clone BC96), anti-FOXP3 PerCP (clone PCH101); Th cells expressing CD25: anti-CD4 FITC (clone RPA-T4), anti-CD25 PE (clone BC96); Tc lymphocytes: anti-CD3 PerCP (clone UCHT1), anti-CD8 APC (clone DK25); Tc cells expressing CD25: anti-CD8 APC (clone DK25), anti-CD25 PE (clone BC96); Tc-reg lymphocytes (36): anti-CD8 APC (clone DK25), anti-CD25 PE (clone BC96), anti-FOXP3 PerCP (clone PCH101); Tc-CD57+ (neuroantigen specific terminally differentiated CD8+Tregs lymphocytes): anti-CD3 PerCP (clone UCHT1), anti-CD8 APC (clone DK25), anti CD57 FITC (clone TB01); NK cells: anti-CD3 PerCP (clone UCHT1); anti-CD8 APC (clone DK25), anti-CD56 PE (clone MOC-1); B lymphocytes: anti-CD20 PECy5 (clone B-Ly1); B1 lymphocytes: anti-CD20 PECy5 (clone B-Ly1); anti-CD27 PE (clone M-T2071), anti-CD43 FITC (clone DF-T1). Reference values, where available, were used for major populations of leukocytes (29303738). All reagents were purchased from Sysmex Partec Italia, anti-CD161 PE was from Becton Dickinson Italia SpA. Treg were immunostained using Affymetrix eBioscience human regulatory T cell staining kit (PCH101, RPA-T4-BC96) (Thermo Fischer group, Santa Clara, CA 95081), while all the other fluorescent antibodies were from DAKO Italia srl.

Statistical analysis

Analyses were performed using GraphPad Prism (v 5.01; Graph-Pad Inc., La Jolla, CA, USA) and SigmaPlot (v 13.0; Systat Software Inc., San Jose, CA, USA). Frequency distributions were computed for each parameter and fitted with a Gaussian curve (least squares fit) to test for normality of values using a D'Agostino&Pearson omnibus K2 test (null hypothesis: non-Gaussian distribution). If parameters followed a Gaussian distribution, means, standard deviation and 95% confidence intervals (reference range) were calculated. If the result of D'Agostino&Pearson test were significant, the data were considered to have a non-Gaussian distribution, but given that the data have a sample size greater than 50 and their distribution is similar to a normal, or a Poisson, or a gamma distribution (according to the central limit theorem and the law of large numbers (3940)), then confidence intervals were calculated with an alpha of 0.05 that is, with a probability of 95%. Statistical comparisons for lymphocyte subsets for gender and age groups were computed using one-way analysis of variance (ANOVA) followed by post-hoc tests for selected comparisons or two-tailed Student's t test. Significance level was set at p<0.05. Additional details are provided in the figure captions, where appropriate.

RESULTS

Sample description

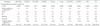
Peripheral blood leucocytes data from an outpatient population in Northeast Italy were collected for a retrospective observational study of lymphocyte subsets identified with flow immunocytofluorimetry. Data were collected in a timeframe from January 2015 to June 2016 and inclusion/exclusion criteria were applied as described in the methods section. The initial sample consisted of 365 Caucasian adults (age mean 41.3 years; age range: 19~58 years), 111 males and 254 females. Samples with out-of-range cell counts of erythrocytes, leukocytes and major lymphocyte populations were excluded from the analysis. Following the application of exclusion criteria the sample was reduced to a total of 78 (age mean 42 years), 24 males and 54 females (see Table I).

Immune cell counts and major lymphocyte subpopulations

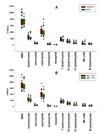
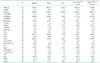
Mean values of white blood cells (WBC), neutrophils, lymphocytes, monocytes, eosinophils and basophils, both absolute numbers and percentage of WBC, were obtained from the hemochrome (CBC) of the subjects and were used to calculate the absolute values of lymphocyte subpopulations from the percentages obtained with cytofluorimetric analysis (see Table II). The graphical distribution of values from the hemochrome and the cytofluorimetric analysis of standard lymphocyte subpopulations: T3, Th, Tc, B, NK, (see Fig. 1A and 1B, respectively) is represented using the nonparametric distribution of sigma plot box, showing median with 25th and 75th percentile borders, error bars represent 10th and 90th percentile and outlier distribution with single dots. Values of IL-2 receptor expressing, activated T lymphocytes (Th-CD25+, Tc-CD25+) were also considered in this analysis, to evaluate the level of immune activation of the samples. Collectively, the values of standard immune cells indicate a high level of uniformity of the samples. Together with the low degree of IL-2 receptor expression (CD25+), this suggests that the subjects were likely not to have ongoing major immune alterations or dysfunctions. There were no significant differences between sexes and between the two age ranges considered (above or below 40yrs) (see Fig. 1A and B).

Cytofluorimetric immunophenotyping of cytokinergic and regulatory lymphocyte subpopulations

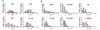
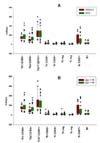
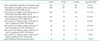
The lymphocyte subpopulations object of the study were analyzed with the immunocytofluorymetric procedures described in the methods. Mean values, standard deviation, standard error and confidence interval of percentage and absolute counts of the different lymphocyte subsets were calculated and nonparametric, as well as Gaussian distributions of data points analyzed. Although non parametric analysis is the normal choice for studying the distribution of data points from data affected by large numbers of variables, as in the case of circulating blood cells, a Gaussian analysis was also performed for each subset of cells to distribute and characterize lymphocyte subpopulations according to their level of intrinsic variability/instability. In particular Gaussian distribution of data was assessed (see Table IIIA, B and Fig. 2). Values for %Th1, Th1/µl, %Th2, Th2/µl, %Th17, Th17/µl, %Th-reg, Th-reg/µl display a Gaussian distribution, while the others do not, suggesting that the latter might be more sensitive to subtle stimuli or display a more dynamic behavior by nature. The confidence intervals were calculated with an alpha of 0.05 that is, with a probability of 95%. The distribution of lymphocyte subpopulations between sexes and between the two age ranges considered (above or below 40 yrs) did not show any significant statistical difference (Fig. 3A and 3B).

DISCUSSION

This retrospective study was designed to establish reference range values of a panel of lymphocyte subpopulations known for their functional and regulatory role in many facets of immune dysregulations, but that have not yet been consistently included in routine assays for immune function characterization. Variations in population and environmental factors need to be addressed individually by region, as these may play a major role in defining the so-called normal reference ranges and overall immune status (3738). The present study focused on determining reference ranges for lymphocyte subsets in a cohort of outpatients representative of male and female adult Caucasians in Northeast Italy. In particular, we verified our established reference ranges, widely used for the routine lymphocyte panel (29303738) and extended the analysis to additional lymphocyte subpopulations which, although regularly performed in our laboratory, still lack precise reference values.
Stringent exclusion/inclusion criteria were applied, in order to limit as much as possible pathological abnormalities due to major immune and blood dysfunctions. Application of these criteria reduced the sample to 21% of the initial population. Analysis of extended panels of lymphocytes is usually requested as a second line diagnostic for suspected dysfunctions. It is thus not surprising that most patients, although not ill enough to be hospitalized, suffered from alterations in blood cell counts. Although the numerosity was reduced to 78, this value was sufficient to ensure statistical power for analysis and, despite the large reduction, the characteristics of the population were not significantly affected, both in terms of mean age and gender.
Mean values of “standard” leukocytes and lymphocytes from the selected population were in accordance with published values (293031323738), regardless of age and sex: total leukocytes, neutrophils, eosinophils, basophils, total lymphocytes, T lymphocytes, Th, Tc, B lymphocytes and Natural Killer cells (Table II and Fig. 2), thus validating the reference values used in the laboratory.
Besides the main standard lymphocyte subpopulations, the major group of phenotypes analyzed was characterized by immune regulatory functions exerted either by specific cytokine-producing lymphocytes (Th1, Th2 and Th17) (1011), by lymphocytes with direct suppressive functions (Th and Tc regulatory cells, Tc-CD57+) (34353641424344), or by lymphocytes with mixed mechanisms (B1 lymphocytes) (4546). All these sub-classes are believed to play an important role in chronic immune dysregulations and are included in diagnostic cytofluorimetric lymphocyte panels used for such conditions (4748), including neuro-immune dysregulations (495051).
Cytokine producing T helper lymphocytes are involved in the early steps of the immune cascade. By activating specific pathways and inhibiting others, these lymphocytes are key players in the immune response and variations in their subsets can be suggestive of specific pathological conditions (52). Based on cytokine profiles produced upon activation, T helper lymphocytes can be sub-classified into Th1, Th2, Th17 and a growing number of other minor sets, known to characterize immune responses in several diseases (102053545556). Immune fluorescent staining of specific surface molecules was used to identify Th subsets (25262728). Th1 mean value, as expected, was higher than Th2 mean value, while the value of Th17 lymphocytes was consistently higher than the other two cytokinergic lymphocyte subgroups. Accordingly, all ratios normally used to evaluate Th cytokinergic and regulatory patterns (Th1/Th2, Th-reg/Th17) are within published ranges (5758596061). Nevertheless the use of a simplified test for lymphocyte subpopulations, where phenotypes are based upon surface antigen expression rather than actual intracellular cytokine expression, should always be acknowledged in order to account for potential risks associated with this assumption.
Th-reg and Tc-reg lymphocytes are implicated in negative feedback to immune activation and are suggested to play a central role in the immune modulation associated with specific pathologic conditions (343536). In this study their values are the lowest, which is not surprising, given their fine tuning role in immune functions.
Tc-CD57+ (also known as T-reg neuroantigen specific) lymphocytes have been identified as cytotoxic effector memory T cells capable of immediate functional activity, with high susceptibility to activation-induced cell death and immunosuppressive capacity (4344). Increased numbers of Tc-CD57+ cells are associated with a wide range of chronic diseases and some viral infections (44), while their neurotropic nature also suggests a role in neuro-immune dysregulations (6263). Their values are rather variable in this study, perhaps related to the unpredictability of an individuals' immune history.
B1 cells are the final regulatory lymphocyte subpopulation included in the panel. These lymphocytes are identified as CD20+CD27+CD43+ B cells and have been suggested to constitute a distinct B cell lineage with a unique set of characteristics that includes constitutive production of auto-reactive antibodies, regulatory cytokines like IL-10 and a strong ability to activate other regulatory lymphocytes (474864).
Taken together these results contribute to establishing reference ranges for each type of lymphocyte subpopulation examined. In particular, the results indicate that values from most subpopulations (Th1, Th2, Th17, Th-reg) display a Gaussian distribution, which characterizes a homogeneous population. Values for the remaining subpopulations (Tc-reg, Tc-CD57+, B1), although not displaying a Gaussian distribution, can still be statistically considered as normally distributed. Such distribution allows for their use as reference range and favors their diagnostic application. Further, statistical significance of the distributions, despite the relatively low number of subjects used in the study, considered together with values of standard deviation, supports the view that most lymphocyte subpopulations analyzed, in normal conditions represent rather stable proportions of lymphocytes. Tc-CD57+ cells represent a predictable exception, given their intrinsic variability (43446263). The mean, median and standard deviation values, as well as reference ranges, or confidence intervals did not differ significantly between sexes or the two age groups considered (19~40 and 41~58), suggesting their applicability for adults of either sex.
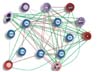
Immune cells are functionally related and changes in a regulatory cell type often lead to a network phenomenon, their numbers should thus be considered as a whole rather than single biomarkers. Positive and negative relationships between lymphocytes should thus be taken into account when presenting the results of a diagnostic lymphocyte panel. Some of the changes might also be different from what is expected from known relationships and these might be associated to specific pathologic conditions.
The standardization process thus includes not only the definition of reference ranges, but also a clear definition of the known functional relationships among lymphocytes, especially if paneling regulatory and cytokinergic cells (see Fig. 4), as a guideline to follow for the interpretation of results. Progressing from the idea of diagnostic biomarkers to a vision of biomarker networks enhances the “actionability” of diagnostic data (2465) and is a key passage in the application of a systems biology view for the interpretation of collective diagnostic data, an approach strategically functional in the path to personalized medicine (212223666768).
Further studies are required with larger samples to consolidate the reference range values identified and a constant update of the immune cell network will be necessary for the correct use of the panel. Validation of these values in other populations will also be needed and is part of our future research plan. The present reference range values can in fact only be applied to the selected age group (adults). Specific studies are required to verify them across age groups (i.e. children, the elderly), as well as in non-Caucasian populations.

Figures and Tables

Figure 1

Distribution of major peripheral blood leukocytes an lymphocyte subpopulations between sexes (A) and the two age ranges considered (above or below 40 yrs) (B). Box plots represent median with 25th and 75th percentile borders, error bars represent 10th and 90th percentile and outlier distribution with single dots. No significant differences between sexes and age were found.

in-16-344-g001
Figure 2

Distribution of lymphocyte subpopulations for Gaussian analysis. Gaussian distribution of lymphocyte subpopulations: Th1, Th2, Th17 and Th-reg (A). Non-Gaussian distribution of lymphocytes subpopulations: Tc-CD57+, B1 cells, Tc-reg, Th-CD25+ and Tc-CD25+ (B).

in-16-344-g002
Figure 3

Distribution of lymphocyte subpopulations between sexes (A) and the two age ranges considered (above or below 40 yrs) (B). Box plots represent median with 25th and 75th percentile borders. Error bars represent 10th and 90th percentile and outlier distribution with single dots. No differences between sexes and age were found.

in-16-344-g003
Figure 4

A systems medicine view of the regulatory lymphocyte subpopulations panel. Activatory (A, green arrows) and Inhibitory (I, red lines) relationships between circulating cells were identified according to cellular or cytokinergic interactions previously described. In some cases different states of the same cell type produce conflicting stimuli and the relative relationship was thus not assigned in the figure. Th1 lymphocytes - A: Tc, Tc-CD57+, NK, MONO, NEUT; I: Th2, Th17, EOS (6970717273747576777879808182). Th2 lymphocytes – A: B lymphocytes, B1 lymphocytes, EOS, BASO, MONO; I: Th1, Th17 (77,7879838485868788). Th17 lymphocytes - A: Tc, B lymphocytes, NK, MONO, NEUT, EOS; I: Th1, Th-reg (738990919293949596109). Th-reg lymphocytes - I: Th1, Th2, Th17, Tc, NK, MONO, NEUT (56838892979899100101102). B lymphocytes - A: Th2, Th17; I: Th1, Th-reg, NK (103104105106). B1 lymphocytes - A: Th1, Th17 (107108). Tc-reg lymphocytes - I: Th1(42). NK cells - A: Tc, B cells, NEUT; I: Th2, Th-reg, EOS (767886899395110). MONO - A: Th2, B cells, BASO, NEUT, EOS (77106111112). NEUT - A: Th2, Th17, B cells, MONO, EOS, BASO; I:Th-reg (77789394113). Artwork was created with Microsoft Office PowerPoint 2007, standard blood cell cartoon symbolic representation was used.

in-16-344-g004
Table I

Description of the subjects used for the analysis before and after application of exclusion criteria

in-16-344-i001
N total N male N female Age (mean±SD)
Initial sample before application of exclusion criteria 365 111 254 41.3±9.1
After exclusion of samples outside normal range of Red blood cells (4200~5400 cells/µl) 298 101 197 41.9±8.8
After exclusion of samples outside normal range of White blood cells (4800~10800 cells/µl) 189 73 116 41.7±8.9
After exclusion of samples outside normal range of Total Lymphocytes (1500~4000 cells/µl) 104 36 68 41.9±8.1
After exclusion of samples outside normal range of Total T Lymphocytes (1000~3200 cells/µl) 100 34 66 42.0±8.7
After exclusion of samples outside normal range of Total Th Lymphocytes (500~2200 cells/µl) 98 33 65 41.9±8.2
After exclusion of samples outside normal range of Total Tc Lymphocytes (300~1520 cells/µl) 84 28 56 41.7±8.4
After exclusion of samples outside normal range of Total B Lymphocytes (105~560 cells/µl) 78 24 54 42±8.5
Sample following inclusion/exclusion criteria 78 24 54 42±8.5

Normal ranges are as previously defined (2930).

Table II

Major peripheral blood leukocytes and lymphocyte subpopulations from CBC and cytofluorimetric analysis, respectively, in the selected sample of 78 adults

in-16-344-i002
N Median Mean SD Lower 95% CI of mean Upper 95% CI of mean
WBC/µl 78 6745.0 6925.9 1255.5 6643.0 7209.0
% NEU 78 55.1 55.2 8.2 53.3 57.0
NEU/µl 78 3690.0 3854.7 1076.4 3612.0 4097.0
% LYMPH 78 33.8 33.6 7.1 32.0 35.2
LYMPH/µl 78 2205.0 2298.8 550.9 2175.0 2423.0
%MONO 78 5.9 6.0 1.6 5.7 6.4
MONO/µl 78 395.0 411.0 113.9 385.3 436.7
% EOS 78 2.3 2.7 1.9 2.2 3.1
EOS/µl 78 155.0 177.3 117.1 150.9 203.7
%BASO 78 0.5 0.6 0.2 0.5 0.6
BASO/µl 78 35.0 37.6 17.1 33.7 41.4
%T3 78 70.5 70.3 8.5 68.4 72.3
T3/µl 78 1607.0 1604.8 375.0 1520.0 1689.0
%Th 78 44.0 43.8 7.5 42.1 45.5
Th/µl 78 1005.0 997.0 258.1 938.8 1055.0
%Th-CD25+ 78 1.0 1.1 0.8 0.9 1.3
Th-CD25+/µl 78 20.5 24.2 18.3 20.1 28.3
%Tc 78 22.0 23.4 7.1 21.8 25.0
Tc/µl 78 474.5 536.2 214.2 487.9 584.5
%Tc-CD25+ 78 0.6 0.6 0.3 0.6 0.7
Tc-CD25+/µl 78 13.0 14.0 8.3 12.2 15.9
%B 78 9.0 10.5 3.8 9.6 11.3
B/µl 78 207.0 241.3 111.5 216.7 266.7
%NK 78 15.0 16.9 8.3 15.0 18.8
NK/µl 78 373.5 373.3 198.3 343.0 452.4

Values are mean, median, standard deviation and 95% confidence interval. Values are expressed as circulating cells per ml of peripheral venous blood and as percentage of total white blood cells for leukocyte, or total lymphocytes for lymphocyte subpopulations, respectively. WBC, White Blood Cells; NEU, neutrophils; LYMPH, lymphocytes; MONO, monocytes; EOS, eosinophils; BASO, basophils.

Table IIIA

Mean, standard deviation, minimum/maximum and 95% confidence interval with D'Agostino&Pearson test of peripheral blood lymphocytes subsets from cytofluorimetric analysis in the selected 78 sample

in-16-344-i003
Parameters %Th1 Th1 %Th2 Th2 %Th17 Th17 %Th-reg Th-reg Th1/Th2 Th-reg/Th17
D'Agostino&Pearson omnibus normality test
 p value 0.093 0.156 0.067 0.121 0.295 0.073 0.127 0.076 - -
 Passed normality test (alpha=0.05)? Yes Yes Yes Yes Yes Yes Yes Yes - -
 Mean 7.3 0157.8 5.4 118.2 10.5 221.6 0.7 15.1 1.4 0.1
 SD 3.0 60.3 2.5 52.2 4.4 90.2 0.4 10.2 0.5 0.1
 Minimum 2.3 55.0 1.5 32.0 1.3 32.0 0.0 0.0 0.5 0.0
 Maximum 15.8 317.0 12.2 261.0 21.6 489.0 1.9 45.0 2.7 0.3
 Confidence Interval (alpha=0.05) 0.67 13.60 0.56 11.75 0.98 40.70 0.10 2.31 0.11 0.02
 Reference range 6.66~8.01 144.20~171.40 4.86~5.98 106.40~129.90 9.50~11.47 201.30~242.00 0.59~0.79 12.79~17.41 1.33~1.54 0.06~0.11

Values are expressed as circulating cells per µl of peripheral blood and as percentage of lymphocytes for lymphocyte subpopulations. In the upper part the results of the D'Agostino & Pearson omnibus normality test for the Gaussian distribution are shown. p>0.05 stands for a Gaussian or normal distribution.

Table IIIB

Mean, standard deviation, minimum/maximum and 95% confidence interval with D'Agostino&Pearson test of peripheral blood lymphocytes subsets from cytofluorimetric analysis in the selected 78 sample

in-16-344-i004
Parameters %Th CD25+ Th CD25+ %Tc CD25+ Tc CD25+ %Tc-reg Tc-reg %Tc CD57+ Tc CD57+ %B1 B1
D'Agostino&Pearson omnibus normality test
 p value <0.0001 <0.0001 0.032 0.0004 <0.0001 <0.0001 <0.0001 <0.0001 <0.0001 <0.0001
 Passed normality test (alpha=0.05)? No No No No No No No No No No
 Mean 1.1 24.2 0.6 14.0 0.3 5.8 4.6 103.7 1.5 33.7
 SD 0.7 18.3 0.3 8.2 0.2 4.6 4.7 114.1 0.8 22.8
 Minimum 0.2 5.0 0.1 3.0 0.0 0.6 0.3 7.0 0.5 8.0
 Maximum 5.0 118.0 1.8 43.0 1.2 23.0 30.0 757.0 5.0 98.0
 Confidence Interval (alpha=0.05) 0.17 4.06 0.07 1.83 0.04 1.03 1.05 25.32 0.19 5.07
 Reference range 0.92~1.25 20.13~28.26 0.57~0.72 12.21~15.87 0.23~0.32 4.73~6.80 3.53~5.65 78.40~129.03 1.27~1.66 28.62~38.76

Values are expressed as circulating cells per µl of peripheral blood and as percentage of lymphocytes for lymphocyte subpopulations. In the upper part the results of the D'Agostino & Pearson omnibus normality test for the Gaussian distribution are shown. p>0.05 stands for a Gaussian or normal distribution.

Abbreviations

CBC

complete blood cell counts

Tc

T cytotoxic

NEU

neutrophils

LYMPH

lymphocytes

MONO

monocytes

EOS

eosinophils

BASO

basophils

AKNOWLEDGEMENTS

The authors thank Dr Sebastian Desando for kindly assisting with the revision of the manuscript, and Dr Ezio Tirloni from Sysmex-Partec for assistance in preparing figures illustrating immune-cytofluorimetric plots.

Notes

CONFLICTS OF INTEREST The authors don't have financial conflict of interest.

References

1. Tosato F, Bernardi D, Sanzari MC, Pantano G, Plebani M. Biological variability of lymphocyte subsets of human adults' blood. Clin Chim Acta. 2013; 424:159–163.
crossref
2. Choi J, Lee SJ, Lee YA, Maeng HG, Lee JK, Kang YW. Reference values for peripheral blood lymphocyte subsets in a healthy korean population. Immune Netw. 2014; 14:289–295.
crossref
3. McCoy JP Jr, Keren DF. Current practices in clinical flow cytometry. A practice survey by the American Society of Clinical Pathologists. Am J Clin Pathol. 1999; 111:161–168.
crossref
4. Yanaba K, Bouaziz JD, Matsushita T, Magro CM, Clair EW St, Tedder TF. B-lymphocyte contributions to human autoimmune disease. Immunol Rev. 2008; 223:284–299.
crossref
5. Doreau A, Belot A, Bastid J, Riche B, Trescol-Biemont MC, Ranchin B, Fabien N, Cochat P, Pouteil-Noble C, Trolliet P, Durieu I, Tebib J, Kassai B, Ansieau S, Puisieux A, Eliaou JF, Bonnefoy-Berard N. Interleukin 17 acts in synergy with B cell-activating factor to influence B cell biology and the pathophysiology of systemic lupus erythematosus. Nat Immunol. 2009; 10:778–785.
crossref
6. Victorino RM, Hodgson HJ. Alteration in T lymphocyte subpopulations in inflammatory bowel disease. Clin Exp Immunol. 1980; 41:156–165.
7. Blanco P, Viallard JF, Pellegrin JL, Moreau JF. Cytotoxic T lymphocytes and autoimmunity. Curr Opin Rheumatol. 2005; 17:731–734.
crossref
8. Niwa F, Kuriyama N, Nakagawa M, Imanishi J. Effects of peripheral lymphocyte subpopulations and the clinical correlation with Parkinson's disease. Geriatr Gerontol Int. 2012; 12:102–107.
crossref
9. Kieseier BC, Hartung HP, Wiendl H. Immune circuitry in the peripheral nervous system. Curr Opin Neurol. 2006; 19:437–445.
crossref
10. Stinissen P, Raus J, Zhang J. Autoimmune pathogenesis of multiple sclerosis: role of autoreactive T lymphocytes and new immunotherapeutic strategies. Crit Rev Immunol. 1997; 17:33–75.
crossref
11. Prat A, Biernacki K, Lavoie JF, Poirier J, Duquette P, Antel JP. Migration of multiple sclerosis lymphocytes through brain endothelium. Arch Neurol. 2002; 59:391–397.
crossref
12. Luckheeram RV, Zhou R, Verma AD, Xia B. CD4(+)T cells: differentiation and functions. Clin Dev Immunol. 2012; 2012:925135.
13. Libby P, Hansson GK. Inflammation and immunity in diseases of the arterial tree: players and layers. Circ Res. 2015; 116:307–311.
crossref
14. Kim JD, Lee SH, Seo EH, Woo SY, Kim SH, Chung SM, Kim HJ. Role of Th1 and Th17 cells in the development and complexity of coronary artery disease: comparison analysis by the methods of flow cytometry and SYNTAX score. Coron Artery Dis. 2015; 26:604–611.
crossref
15. Robertson MJ, Schacterle RS, Mackin GA, Wilson SN, Bloomingdale KL, Ritz J, Komaroff AL. Lymphocyte subset differences in patients with chronic fatigue syndrome, multiple sclerosis and major depression. Clin Exp Immunol. 2005; 141:326–332.
crossref
16. Fehervari Z. Lymphocytes in Alzheimer's disease. Nat Immunol. 2016; 17:355.
crossref
17. Asano M, Toda M, Sakaguchi N, Sakaguchi S. Autoimmune disease as a consequence of developmental abnormality of a T cell subpopulation. J Exp Med. 1996; 184:387–396.
crossref
18. McNally A, Hill GR, Sparwasser T, Thomas R, Steptoe RJ. CD4+CD25+ regulatory T cells control CD8+ T-cell effector differentiation by modulating IL-2 homeostasis. Proc Natl Acad Sci U S A. 2011; 108:7529–7534.
crossref
19. Van Parijs L, Abbas AK. Homeostasis and self-tolerance in the immune system: turning lymphocytes off. Science. 1998; 280:243–248.
crossref
20. Stumhofer JS, Laurence A, Wilson EH, Huang E, Tato CM, Johnson LM, Villarino AV, Huang Q, Yoshimura A, Sehy D, Saris CJ, O'Shea JJ, Hennighausen L, Ernst M, Hunter CA. Interleukin 27 negatively regulates the development of interleukin 17-producing T helper cells during chronic inflammation of the central nervous system. Nat Immunol. 2006; 7:937–945.
crossref
21. Hood L, Tian Q. Systems approaches to biology and disease enable translational systems medicine. Genomics Proteomics Bioinformatics. 2012; 10:181–185.
crossref
22. Lemberger T. Systems biology in human health and disease. Mol Syst Biol. 2007; 3:136.
crossref
23. Lindquist JA, Schraven B. Systems biology of T cell activation. Ernst Schering Found Symp Proc. 2007; 43–61.
crossref
24. Hood L, Lovejoy JC, Price ND. Integrating big data and actionable health coaching to optimize wellness. BMC Med. 2015; 13:4.
crossref
25. Kutukculer N, Azarsiz E, Aksu G, Karaca NE. CD4+CD25+Foxp3+ T regulatory cells, Th1 (CCR5, IL-2, IFN-gamma) and Th2 (CCR4, IL-4, Il-13) type chemokine receptors and intracellular cytokines in children with common variable immunodeficiency. Int J Immunopathol Pharmacol. 2016; 29:241–251.
crossref
26. Yamamoto J, Adachi Y, Onoue Y, Adachi YS, Okabe Y, Itazawa T, Toyoda M, Seki T, Morohashi M, Matsushima K, Miyawaki T. Differential expression of the chemokine receptors by the Th1- and Th2-type effector populations within circulating CD4+ T cells. J Leukoc Biol. 2000; 68:568–574.
27. Maggi L, Santarlasci V, Capone M, Peired A, Frosali F, Crome SQ, Querci V, Fambrini M, Liotta F, Levings MK, Maggi E, Cosmi L, Romagnani S, Annunziato F. CD161 is a marker of all human IL-17-producing T-cell subsets and is induced by RORC. Eur J Immunol. 2010; 40:2174–2181.
crossref
28. Gonzalez Y, Herrera MT, Juarez E, Salazar-Lezama MA, Bobadilla K, Torres M. CD161 expression defines a Th1/Th17 polyfunctional subset of resident memory T lymphocytes in bronchoalveolar cells. PLoS One. 2015; 10:e0123591.
crossref
29. Hannet I, Erkeller-Yuksel F, Lydyard P, Deneys V, DeBruyere M. Developmental and maturational changes in human blood lymphocyte subpopulations. Immunol Today. 1992; 13:215. 218.
crossref
30. Shearer WT, Rosenblatt HM, Gelman RS, Oyomopito R, Plaeger S, Stiehm ER, Wara DW, Douglas SD, Luzuriaga K, McFarland EJ, Yogev R, Rathore MH, Levy W, Graham BL, Spector SA. Lymphocyte subsets in healthy children from birth through 18 years of age: the pediatric AIDS clinical trials group P1009 study. J Allergy Clin Immunol. 2003; 112:973–980.
crossref
31. Nebe T, Bentzien F, Bruegel M, Fiedler GM, Gutensohn K, Heimpel H, Krebs N, Ossendorf M, Schuff-Werner P, Stamminger G, Baum H. Multi-centric determination of reference ranges for automated blood counts. Laboratoriums Medizin. 2011; 35.
32. Herklotz R, Luthi U, Ottiger C, Huber AR. Metaanalysis of reference values in hematology. Ther Umsch. 2006; 63:5–24.
33. Rout N. Enhanced Th1/Th17 functions of CD161+ CD8+ T cells in mucosal tissues of rhesus macaques. PLoS One. 2016; 11:e0157407.
34. Ohkura N, Hamaguchi M, Sakaguchi S. FOXP3+ regulatory T cells: control of FOXP3 expression by pharmacological agents. Trends Pharmacol Sci. 2011; 32:158–166.
crossref
35. Rudensky AY. Regulatory T cells and Foxp3. Immunol Rev. 2011; 241:260–268.
crossref
36. Beres AJ, Haribhai D, Chadwick AC, Gonyo PJ, Williams CB, Drobyski WR. CD8+ Foxp3+ regulatory T cells are induced during graft-versus-host disease and mitigate disease severity. J Immunol. 2012; 189:464–474.
crossref
37. Santagostino A, Garbaccio G, Pistorio A, Bolis V, Camisasca G, Pagliaro P, Girotto M. An Italian national multicenter study for the definition of reference ranges for normal values of peripheral blood lymphocyte subsets in healthy adults. Haematologica. 1999; 84:499–504.
38. Maini MK, Gilson RJ, Chavda N, Gill S, Fakoya A, Ross EJ, Phillips AN, Weller IV. Reference ranges and sources of variability of CD4 counts in HIV-seronegative women and men. Genitourin Med. 1996; 72:27–31.
crossref
39. Buchwald J, Berggren JL, Lützen J, Renn J, Fraser C, Sauer T, Shapiro A, Fischer , Hans . A history of the central limit theorem: from classical to modern probability theory. sources and studies in the history of mathematics and physical sciences. New York: springer;2011. p. 17–30. Chapter 2.
40. Kim S, Zhao Z, Shao X. Nonparametric functional central limit theorem for time series regression with application to self-normalized confidence interval. J Multivar Anal. 2015; 133:277–290.
crossref
41. Shevach EM. CD4+ CD25+ suppressor T cells: more questions than answers. Nat Rev Immunol. 2002; 2:389–400.
crossref
42. Churlaud G, Pitoiset F, Jebbawi F, Lorenzon R, Bellier B, Rosenzwajg M, Klatzmann D. Human and mouse CD8(+)CD25(+)FOXP3(+) regulatory T cells at steady state and during interleukin-2 therapy. Front Immunol. 2015; 6:171.
crossref
43. Kared H, Martelli S, Ng TP, Pender SL, Larbi A. CD57 in human natural killer cells and T-lymphocytes. Cancer Immunol Immunother. 2016; 65:441–452.
crossref
44. Focosi D, Bestagno M, Burrone O, Petrini M. CD57+ T lymphocytes and functional immune deficiency. J Leukoc Biol. 2010; 87:107–116.
45. Perez-Andres M, Grosserichter-Wagener C, Teodosio C, van Dongen JJ, Orfao A, van Zelm MC. The nature of circulating CD27+CD43+ B cells. J Exp Med. 2011; 208:2565–2566.
46. Griffin DO, Holodick NE, Rothstein TL. Human B1 cells are CD3-: A reply to “A human equivalent of mouse B-1 cells?” and “The nature of circulating CD27+CD43+ B cells”. J Exp Med. 2011; 208:2566–2569.
crossref
47. Talaat RM, Elmaghraby AM, Barakat SS, El-Shahat M. Alterations in immune cell subsets and their cytokine secretion profile in childhood idiopathic thrombocytopenic purpura (ITP). Clin Exp Immunol. 2014; 176:291–300.
crossref
48. Wood KL, Twigg HL III, Doseff AI. Dysregulation of CD8+ lymphocyte apoptosis, chronic disease, and immune regulation. Front Biosci (Landmark Ed.). 2009; 14:3771–3781.
49. Saunders JA, Estes KA, Kosloski LM, Allen HE, Dempsey KM, Torres-Russotto DR, Meza JL, Santamaria PM, Bertoni JM, Murman DL, Ali HH, Standaert DG, Mosley RL, Gendelman HE. CD4+ regulatory and effector/memory T cell subsets profile motor dysfunction in Parkinson's disease. J Neuroimmune Pharmacol. 2012; 7:927–938.
crossref
50. Salonen R, Ilonen J, Jagerroos H, Syrjala H, Nurmi T, Reunanen M. Lymphocyte subsets in the cerebrospinal fluid in active multiple sclerosis. Ann Neurol. 1989; 25:500–502.
crossref
51. Vojdani A, Lambert J. The Role of Th17 in Neuroimmune Disorders: Target for CAM Therapy. Part I. Evid Based Complement Alternat Med. 2011; 2011:927294.
crossref
52. Belardelli F. Role of interferons and other cytokines in the regulation of the immune response. APMIS. 1995; 103:161–179.
crossref
53. Sugita S, Kawazoe Y, Imai A, Yamada Y, Horie S, Mochizuki M. Inhibition of Th17 differentiation by anti-TNF-alpha therapy in uveitis patients with Behcet's disease. Arthritis Res Ther. 2012; 14:R99.
54. Fletcher JM, Lalor SJ, Sweeney CM, Tubridy N, Mills KH. T cells in multiple sclerosis and experimental autoimmune encephalomyelitis. Clin Exp Immunol. 2010; 162:1–11.
crossref
55. Korn T, Bettelli E, Oukka M, Kuchroo VK. IL-17 and Th17 Cells. Annu Rev Immunol. 2009; 27:485–517.
crossref
56. Eisenstein EM, Williams CB. The T(reg)/Th17 cell balance: a new paradigm for autoimmunity. Pediatr Res. 2009; 65:26R–31R.
crossref
57. Kuo ML, Huang JL, Yeh KW, Li PS, Hsieh KH. Evaluation of Th1/Th2 ratio and cytokine production profile during acute exacerbation and convalescence in asthmatic children. Ann Allergy Asthma Immunol. 2001; 86:272–276.
crossref
58. Nanba T, Watanabe M, Inoue N, Iwatani Y. Increases of the Th1/Th2 cell ratio in severe Hashimoto's disease and in the proportion of Th17 cells in intractable Graves' disease. Thyroid. 2009; 19:495–501.
crossref
59. Falivene J, Ghiglione Y, Laufer N, Socias ME, Holgado MP, Ruiz MJ, Maeto C, Figueroa MI, Giavedoni LD, Cahn P, Salomon H, Sued O, Turk G, Gherardi MM. Th17 and Th17/Treg ratio at early HIV infection associate with protective HIV-specific CD8(+) T-cell responses and disease progression. Sci Rep. 2015; 5:11511.
crossref
60. Yu ZX, Ji MS, Yan J, Cai Y, Liu J, Yang HF, Li Y, Jin ZC, Zheng JX. The ratio of Th17/Treg cells as a risk indicator in early acute respiratory distress syndrome. Crit Care. 2015; 19:82.
crossref
61. Ji L, Zhan Y, Hua F, Li F, Zou S, Wang W, Song D, Min Z, Chen H, Cheng Y. The ratio of Treg/Th17 cells correlates with the disease activity of primary immune thrombocytopenia. PLoS One. 2012; 7:e50909.
crossref
62. Cunnusamy K, Baughman EJ, Franco J, Ortega SB, Sinha S, Chaudhary P, Greenberg BM, Frohman EM, Karandikar NJ. Disease exacerbation of multiple sclerosis is characterized by loss of terminally differentiated autoregulatory CD8+ T cells. Clin Immunol. 2014; 152:115–126.
crossref
63. Baughman EJ, Mendoza JP, Ortega SB, Ayers CL, Greenberg BM, Frohman EM, Karandikar NJ. Neuroantigen-specific CD8+ regulatory T-cell function is deficient during acute exacerbation of multiple sclerosis. J Autoimmun. 2011; 36:115–124.
crossref
64. Baumgarth N. The double life of a B-1 cell: self-reactivity selects for protective effector functions. Nat Rev Immunol. 2011; 11:34–46.
crossref
65. Villoslada P, Baranzini S. Data integration and systems biology approaches for biomarker discovery: challenges and opportunities for multiple sclerosis. J Neuroimmunol. 2012; 248:58–65.
crossref
66. Buriani A, Fortinguerra S, Carrara M. Clinical perspectives in diagnostic-omics and personalised medicine approach to monitor effectiveness and toxicity of phytocomplexes. In : Pelkonen O, Duez P, Vuorela PM, Vuorela H, editors. Toxicology of herbal products. Springer: 2017. Chapter 16. DOI: 10.1007/978-3-319-43806-1_16.
67. Buriani A, Pelkonen O, Fortinguerra S, Carrara M. Systems network pharmaco-toxicology in the study of herbal medicines. In : Pelkonen O, Duez P, Vuorela PM, Vuorela H, editors. Toxicology of herbal products. Springer;2017. Chapter 7. DOI: 10.1007/978-3-319-43806-1_7.
68. Buriani A, Fortinguerra S. The systems biology oriented. Holistic vision of personalized medicine and the emerging concept of proactive herbal medicine. J J Intern Medicine. 2015; 1:007.
69. Oriss TB, McCarthy SA, Morel BF, Campana MA, Morel PA. Crossregulation between T helper cell (Th)1 and Th2: inhibition of Th2 proliferation by IFN-gamma involves interference with IL-1. J Immunol. 1997; 158:3666–3672.
70. Damsker JM, Hansen AM, Caspi RR. Th1 and Th17 cells: adversaries and collaborators. Ann N Y Acad Sci. 2010; 1183:211–221.
71. Song K, Coleman RA, Alber C, Ballas ZK, Waldschmidt TJ, Mortari F, LaBrecque DR, Cook RT. TH1 cytokine response of CD57+ T-cell subsets in healthy controls and patients with alcoholic liver disease. Alcohol. 2001; 24:155–167.
crossref
72. Ekkens MJ, Shedlock DJ, Jung E, Troy A, Pearce EL, Shen H, Pearce EJ. Th1 and Th2 cells help CD8 T-cell responses. Infect Immun. 2007; 75:2291–2296.
crossref
73. Geering B, Stoeckle C, Conus S, Simon HU. Living and dying for inflammation: neutrophils, eosinophils, basophils. Trends Immunol. 2013; 34:398–409.
crossref
74. de Visser KE, Eichten A, Coussens LM. Paradoxical roles of the immune system during cancer development. Nat Rev Cancer. 2006; 6:24–37.
crossref
75. Brombacher F, Kastelein RA, Alber G. Novel IL-12 family members shed light on the orchestration of Th1 responses. Trends Immunol. 2003; 24:207–212.
crossref
76. Chong WP, van PN, Chen J, Silver PB, Jittayasothorn Y, Mattapallil MJ, Germain RN, Caspi RR. NK-DC crosstalk controls the autopathogenic Th17 response through an innate IFN-gamma-IL-27 axis. J Exp Med. 2015; 212:1739–1752.
crossref
77. Garlanda C, Dinarello CA, Mantovani A. The interleukin-1 family: back to the future. Immunity. 2013; 39:1003–1018.
crossref
78. Korn T, Oukka M, Kuchroo V, Bettelli E. Th17 cells: effector T cells with inflammatory properties. Semin Immunol. 2007; 19:362–371.
crossref
79. Romagnani S. The Th1/Th2 paradigm. Immunol Today. 1997; 18:263–266.
crossref
80. Janeway JCA, Travers P, Walport M, Shlomchik MJ. Macrophage activation by armed CD4 TH1 cells. In : Charles J, Janeway A, Travers P, Walport M, Shlomchik MJ, editors. Immunobiology, The immune system in health and disease. 5th Edition. New York: Garland science;2001. p. 333–337. Part IV, Chapter 8.
81. Basu R, Hatton RD, Weaver CT. The Th17 family: flexibility follows function. Immunol Rev. 2013; 252:89–103.
crossref
82. de Blic J, Tillie-Leblond I, Tonnel AB, Jaubert F, Scheinmann P, Gosset P. Difficult asthma in children: an analysis of airway inflammation. J Allergy Clin Immunol. 2004; 113:94–100.
83. Meyer-Hoffert U, Lezcano-Meza D, Bartels J, Montes-Vizuet AR, Schroder JM, Teran LM. Th2- and to a lesser extent Th1-type cytokines upregulate the production of both CXC (IL-8 and gro-alpha) and CC (RANTES, eotaxin, eotaxin-2, MCP-3 and MCP-4) chemokines in human airway epithelial cells. Int Arch Allergy Immunol. 2003; 131:264–271.
crossref
84. Min B. Basophils induce Th2 immunity: is this final answer? Virulence. 2010; 1:399–401.
85. Knoops L, Louahed J, Renauld JC. IL-9-induced expansion of B-1b cells restores numbers but not function of B-1 lymphocytes in xid mice. J Immunol. 2004; 172:6101–6106.
crossref
86. Zhu J. T helper 2 (Th2) cell differentiation, type 2 innate lymphoid cell (ILC2) development and regulation of interleukin-4 (IL-4) and IL-13 production. Cytokine. 2015; 75:14–24.
crossref
87. Wang C, Liu Q, Chen F, Xu W, Zhang C, Xiao W. IL-25 promotes Th2 Immunity responses in asthmatic mice via nuocytes activation. PLoS One. 2016; 11:e0162393.
crossref
88. Su J, Chen T, Ji XY, Liu C, Yadav PK, Wu R, Yang P, Liu Z. IL-25 downregulates Th1/Th17 immune response in an IL-10-dependent manner in inflammatory bowel disease. Inflamm Bowel Dis. 2013; 19:720–728.
crossref
89. Tian Y, Zajac AJ. IL-21 and T Cell Differentiation: Consider the Context. Trends Immunol. 2016; 37:557–568.
crossref
90. Leonard WJ, Wan CK. IL-21 Signaling in Immunity. F1000Res. 2016; 5.
crossref
91. Tosolini M, Kirilovsky A, Mlecnik B, Fredriksen T, Mauger S, Bindea G, Berger A, Bruneval P, Fridman WH, Pages F, Galon J. Clinical impact of different classes of infiltrating T cytotoxic and helper cells (Th1, th2, treg, th17) in patients with colorectal cancer. Cancer Res. 2011; 71:1263–1271.
crossref
92. Saito S, Nakashima A, Shima T, Ito M. Th1/Th2/Th17 and regulatory T-cell paradigm in pregnancy. Am J Reprod Immunol. 2010; 63:601–610.
crossref
93. van den Berg WB, McInnes IB. Th17 cells and IL-17 a--focus on immunopathogenesis and immunotherapeutics. Semin Arthritis Rheum. 2013; 43:158–170.
crossref
94. Busman-Sahay KO, Walrath T, Huber S, O'Connor W Jr. Cytokine crowdsourcing: multicellular production of TH17-associated cytokines. J Leukoc Biol. 2015; 97:499–510.
crossref
95. Gharibi T, Majidi J, Kazemi T, Dehghanzadeh R, Motallebnezhad M, Babaloo Z. Biological effects of IL-21 on different immune cells and its role in autoimmune diseases. Immunobiology. 2016; 221:357–367.
crossref
96. Ju B, Li D, Ji X, Liu J, Peng H, Wang S, Liu Y, Hao Y, Yee C, Liang H, Shao Y. Interleukin-21 administration leads to enhanced antigen-specific T cell responses and natural killer cells in HIV-1 vaccinated mice. Cell Immunol. 2016; 303:55–65.
crossref
97. Cope A, Le FG, Cardone J, Kemper C. The Th1 life cycle: molecular control of IFN-gamma to IL-10 switching. Trends Immunol. 2011; 32:278–286.
98. Pedroza-Pacheco I, Madrigal A, Saudemont A. Interaction between natural killer cells and regulatory T cells: perspectives for immunotherapy. Cell Mol Immunol. 2013; 10:222–229.
crossref
99. Taams LS, van Amelsfort JM, Tiemessen MM, Jacobs KM, de Jong EC, Akbar AN, Bijlsma JW, Lafeber FP. Modulation of monocyte/macrophage function by human CD4+CD25+ regulatory T cells. Hum Immunol. 2005; 66:222–230.
crossref
100. Lewkowicz N, Klink M, Mycko MP, Lewkowicz P. Neutrophil--CD4+CD25+ T regulatory cell interactions: a possible new mechanism of infectious tolerance. Immunobiology. 2013; 218:455–464.
crossref
101. McNally A, Hill GR, Sparwasser T, Thomas R, Steptoe RJ. CD4+CD25+ regulatory T cells control CD8+ T-cell effector differentiation by modulating IL-2 homeostasis. Proc Natl Acad Sci U S A. 2011; 108:7529–7534.
crossref
102. Rother N, van der Vlag J. Disturbed T cell signaling and altered Th17 and Regulatory T cell subsets in the pathogenesis of systemic lupus erythematosus. Front Immunol. 2015; 6:610.
crossref
103. Diehl S, Rincon M. The two faces of IL-6 on Th1/Th2 differentiation. Mol Immunol. 2002; 39:531–536.
crossref
104. Newcomb DC, Boswell MG, Zhou W, Huckabee MM, Goleniewska K, Sevin CM, Hershey GK, Kolls JK, Peebles RS Jr. Human TH17 cells express a functional IL-13 receptor and IL-13 attenuates IL-17A production. J Allergy Clin Immunol. 2011; 127:1006–1013.e1-4.
crossref
105. Kimura A, Kishimoto T. IL-6: regulator of Treg/Th17 balance. Eur J Immunol. 2010; 40:1830–1835.
crossref
106. Patera AC, Pesnicak L, Bertin J, Cohen JI. Interleukin 17 modulates the immune response to vaccinia virus infection. Virology. 2002; 299:56–63.
crossref
107. Zhong X, Gao W, Degauque N, Bai C, Lu Y, Kenny J, Oukka M, Strom TB, Rothstein TL. Reciprocal generation of Th1/Th17 and T(reg) cells by B1 and B2 B cells. Eur J Immunol. 2007; 37:2400–2404.
crossref
108. Wang Y, Rothstein TL. Induction of Th17 cell differentiation by B-1 cells. Front Immunol. 2012; 3:281.
crossref
109. Kotake S, Nanke Y, Yago T, Kawamoto M, Kobashigawa T, Yamanaka H. Elevated ratio of Th17 cell-derived Th1 cells (CD161(+)Th1 cells) to CD161(+)Th17 cells in peripheral blood of early-onset rheumatoid arthritis patients. Biomed Res Int. 2016; 2016:4186027.
110. Li J, Dong X, Zhao L, Wang X, Wang Y, Yang X, Wang H, Zhao W. Natural killer cells regulate Th1/Treg and Th17/Treg balance in chlamydial lung infection. J Cell Mol Med. 2016; 20:1339–1351.
crossref
111. Hsing CH, Hsu CC, Chen WY, Chang LY, Hwang JC, Chang MS. Expression of IL-19 correlates with Th2 cytokines in uraemic patients. Nephrol Dial Transplant. 2007; 22:2230–2238.
crossref
112. Liao SC, Cheng YC, Wang YC, Wang CW, Yang SM, Yu CK, Shieh CC, Ceng KC, Lee MF, Chiang SR, Shieh JM, Chang MS. IL-19 induced Th2 cytokines and was up-regulated in asthma patients. J Immunol. 2004; 173:6712–6718.
crossref
113. Allen JE, Sutherland TE, Ruckerl D. IL-17 and neutrophils: unexpected players in the type 2 immune response. Curr Opin Immunol. 2015; 34:99–106.
crossref
TOOLS
Similar articles