

 PDF
PDF ePub
ePub Citation
 Print
Print


INTRODUCTION
Dyslipidemia means abnormal amount of lipids in the blood and its clinically important types include elevated total cholesterol, elevated triglycerides, elevated low density lipoprotein cholesterol (LDL-C), and decreased high density lipoprotein cholesterol (HDL-C) levels. Many previous studies have reported that dyslipidemia increases the risk of cardiovascular diseases [1-3]. Due to its asymptomatic nature and slow progression, it is difficult for individuals to notice or manage it. According to the 30-year follow-up study, a 10 mg/dL increase in total cholesterol was associated with 5% increase of total mortality and 9% increase of cardiovascular mortality [4]. Coronary heart disease and cerebrovascular disease caused twelve million deaths per year worldwide [5]. In South Korea, cerebrovascular disease, cardiovascular disease, and other circulatory diseases account for 20% of the total deaths and great disease burden as well [6,7]. However, there has not yet been a representative study that shows the prevalence of dyslipidemia in Korea. Thus we estimated the prevalence of dyslipidemia and its components among Korean adults based on the 1998, 2001, and 2005 Korean National Health and Nutrition Examination Survey (KNHANES) datasets. This study also investigated the rates of awareness, treatment, and control of dyslipidemia among Korean adults.
METHODS
This study is based on the data obtained from the KNHANES, which is a nationwide survey examining the general health and nutrition status of the Korean people [8]. It consisted of four distinct surveys: the health interview survey, the health behavior survey, the health examination survey, and the nutrition survey. The KNHANES was conducted in 1998 (KNHANES I), 2001 (KNHANES II), and 2005 (KNHANES III). A stratified, multistage probability sampling design was used in KNHANES, and 42,780 individuals from 600 districts were chosen in consideration of location and residence-type in order to establish full representativeness of the whole nation. All 600 sampling districts were subject to the health interview and behavior surveys, and 200 districts of them (one third random sample) were subject to the health examination and nutrition surveys.
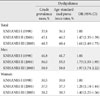
The diagnosis of dyslipidemia was based on the presence of one or more of the following criteria, according to the criteria of the National Cholesterol Education Program Adult Treatment Panel III [9]. In the KNHANES I (year 1998) and II (year 2001), individuals were not asked about their blood lipid levels and management in the health interview survey because dyslipidemia was assumed to be very low in Korea. Thus dyslipidemia was defined solely based on the blood test results in the health examination in 1998 and 2001. But in 2005, dyslipidemia was determined with fasting blood tests as well as health interview survey data. Blood samples were collected in the morning after fasting for at least 8 hours and analyzed in the certified central laboratory on the same day. Serum total cholesterol, triglycerides, and HDL-C were measured by automated enzymatic techniques. LDL-C was calculated using the Friedewald's formula [10] in individuals with triglycerides <400 mg/dL. Therefore the definitions of dyslipidemia are as follows: In 1998 and 2001, total cholesterol levels over 240 mg/dL in the blood test results were defined as hypercholesterolemia, HDL-C levels under 40 mg/dL were defined as hypo-HDL-cholesterolemia, and triglyceride levels over 200 mg/dL were defined as hypertriglycemia. LDL-C levels over 160 mg/dL were defined as hyper-LDL-cholesterolemia. In 2005, hypo-HDL-cholesterolemia and hypertriglycemia were defined in the same way as they were in 1998 and 2001. Hypercholesterolemia was defined as the following three cases: 1) a total cholesterol level over 240 mg/dL from a blood test taken after fasting, or 2) the use of lipid-lowering drugs, or 3) when the subject has been diagnosed with dyslipidemia by a physician. Hyper-LDL-cholesterolemia was defined as: 1) an LDL-C level over 160 mg/dL, or 2) the use of lipid-lowering drugs, or 3) when the subject has been diagnosed with dyslipidemia by a physician (Table 1). The reason being, that despite the discrepancies in the definition of dyslipidemia by year, it is optimal for the definition to be accurate for each year. In the case of this study, the analysis was done excluding any measurements that were missing total cholesterol, HDL-C, or triglycerides. We analyzed subjects over 20 years old who participated in the health examination survey.
The awareness rate of dyslipidemia, physician diagnosis rate, treatment rate, and control rate were defined using the health interview survey and the health examination survey results from KNHANES III (2005) only. The awareness rate is defined as the number of individuals whose response to the health interview survey indicated that they have had dyslipidemia in the past divided by the number of people with dyslipidemia, and the physician diagnosis rate is defined as the number of cases where individuals replied that they had been diagnosed by a physician out of those who are dyslipidemic. The treatment rate is defined based on individuals who had been diagnosed with dyslipidemia and had been taking lipid-lowering drugs, and the control rate is defined as individuals who had been diagnosed with dyslipidemia and had LDL-C levels under 160 mg/dL, HDL-C levels over 40 mg/dL, and triglyceride levels under 150 mg/dL.
Statistical analysis
For prevalence calculations, we used the stratification variables and sampling weights designated by the Korean Centers for Disease Control and Prevention, which were based on the sample design of each survey year. Prevalence of dyslipidemia was estimated in subjects over 20 and 30, and ages were classified into 10-year increments. The standardized prevalence and the numbers of cases of dyslipidemia were calculated by sex- and age-specific 2005 Korean population. In the table, the coefficients of variation over 30% were expressed as separate notations, and caution is required when interpreting corresponding values. For the purpose of comparison, the prevalence, diagnosis, and treatment rates in 1998 and 2001 were also adjusted to the age structure of the 2005 Korean population. Statistical analyses were performed using SAS version 9.2 (SAS Institute, Cary, NC, USA) and a P value of less than 0.05 was considered to be statistically significant. All statistical values generated in this research used the stratification variables used for sampling as well as weights, using the SAS survey procedure.
RESULTS
The total numbers of subjects in this study were as follows: 6,923 in KNHANES I (1998), 4,882 in KNHANES II (2001), and 5,323 in KNHANES III (2005). The mean ages of the participants were 43.2, 45.8, and 43.4 years per survey year, respectively. The mean ages of male participants were 42.6, 46.0, and 42.6 years, respectively, and the mean ages of female participants were 43.7, 45.6, and 44.3 years.
Lipoprotein distribution
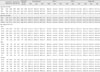
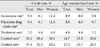
The mean values of total cholesterol, HDL-C, LDL-C, and triglycerides were presented for each survey year by gender according to age groups of 20+, 30+, and so on in 10-year increments (Table 2).
Total cholesterol shows an increasing trend with age. Prior to age 50, the mean total cholesterol value in males is greater than in females. HDL-C decreases as age increases, but when examined by gender, is higher in females prior to age 50, although it is similar in males and females older than 50. LDL-C in males did not deviate far from the gender mean value, whereas as females age increases, the mean values showed an increasing trend. The mean triglyceride level in males was the highest between the ages of 40 to 59, and highest in females between the ages of 50 to 69. When considering only KNHANES III (2005), the average total cholesterol and LDL-C levels were 2 to 3 mg/dL lower in females than in males, and triglyceride levels were approximately 50 mg/dL lower in females. HDL-C was approximately 5 mg/dL higher in females than in males.
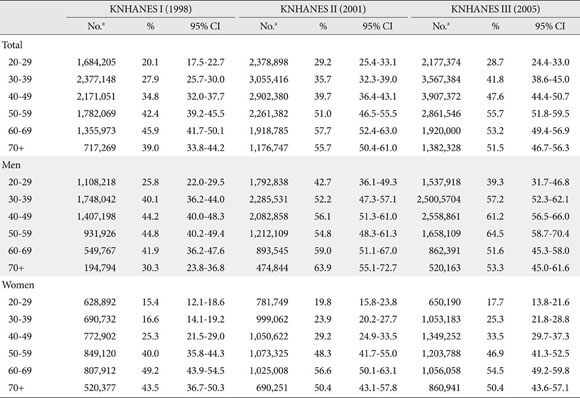
Prevalence of dyslipidemia
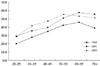
The prevalence of dyslipidemia in adults over age 20 was 32.4% in 1998 (males, 38.4%; females, 27.1%), and increased greatly to 42.6% in 2011 (males, 53.9%; females, 34.8%). The prevalence was 44.1% in 2005 (males, 54.5%; females, 34.0%), which was a slight increase over the 2001 survey. The age-standardized prevalence in individuals older than 30 in 1998 was 35.8%, and 45.1% in 2001, which was a 9.3% increase within three years. In 2005, the age-standardized prevalence was 48.3%, which was 3.2% higher than in 2001. The prevalence of dyslipidemia was higher in males than in females (Table 3). A rapid increase in the prevalence of dyslipidemia in adults was observed in all age (Fig. 1).
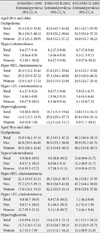
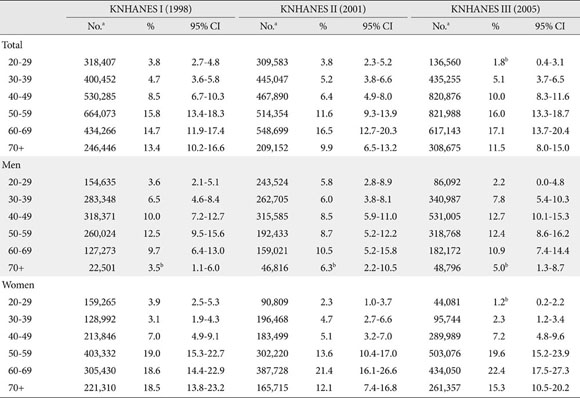
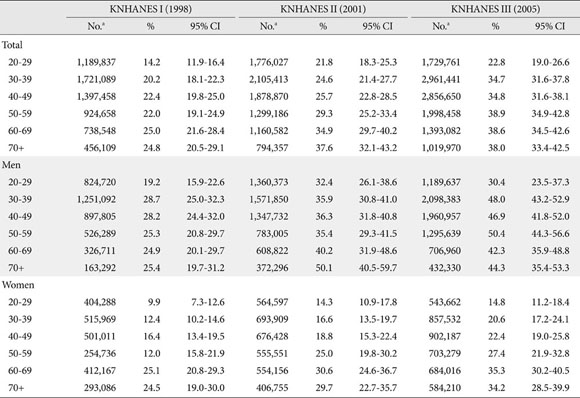
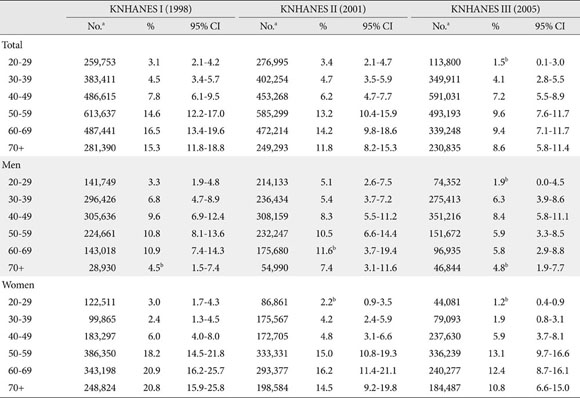
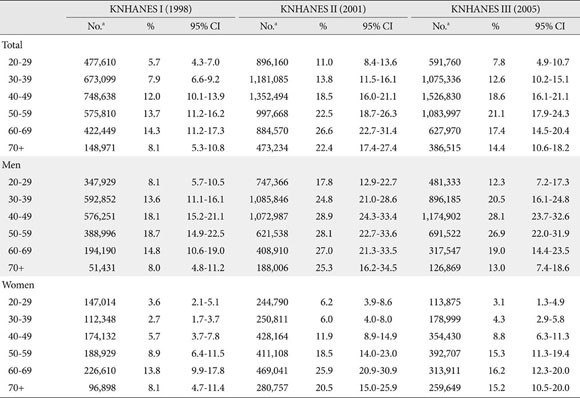
The prevalence of hypercholesterolemia in adults over 20 years of age was 8.6%, 8.2%, and 8.7%, respectively, by survey year. The prevalence slightly decreased from 1998 to 2001 and then increased again. The prevalence of hypo-HDL-cholesterolemia gradually increased (20.4% in 1998, 27.6% in 2001, and 33.4% in 2005), but the prevalence in males was higher than in females in all surveys. The prevalence of hyper-LDL-cholesterolemia was 8.4% in 1998, 8.0% in 2001, and 5.9% in 2005. The prevalence of hyper-LDL-cholesterolemia was decreased from 1998 to 2005. This pattern was similar for both males and females. The prevalence of hypertriglycemia was 9.8%, 18.3%, and 14.8%, respectively; the prevalence increased from 1998 to 2001 and then began to decrease. In males, the prevalence of hypertriglycemia was 14.1%, 25.6%, and 20.8%, respectively, while those in females were 6.0%, 13.2%, and 8.9%. The results show that the prevalence was higher in males than in females (Table 3).
The prevalence of dyslipidemia and the number of cases estimated by 2005 population are presented in the Appendix 1 to 5. When the results from the 2005 survey were examined, the prevalence of dyslipidemia in participants in their 20s was 28.7% and surged to 41.8% in participants in their 30s. Between the ages of 50 and 70+, more than half of those surveyed were reported to have dyslipidemia. As age increased for both males and females, an increasing trend in dyslipidemia was seen. The prevalence of dyslipidemia in males between the ages of 20 and 50 was nearly double the prevalence in females, although the prevalence was higher in females in the 60 to 70 age groups. In the age 70+ group, the prevalence in the male group was slightly higher than in female. The prevalence of hypercholesterolemia and hyper-LDL-cholesterolemia was higher in males until age 40 and higher in females after age 50. However, hypo-HDL-cholesterolemia and hypertriglycemia prevalence peaked in the 40 to 50 age range, after which a slight decreasing trend could be seen. In nearly all age groups, the prevalence of hypo-HDL cholesterolemia and hypertriglycemia was slightly higher in males (except females in their 60s). Among the components of dyslipidemia, the prevalence of hypo-HDL cholesterolemia was the highest, followed by hypertriglycemia, and the prevalence of hyper-LDL cholesterolemia was the lowest, around 7 percent.
Age-standardized prevalence was 36.1% in 1998, 46.2% in 2001, and 48.4% in 2005. Compared with the prevalence from 1998, the prevalence in 2001 had increased by 1.47-fold (95% confidence interval [CI], 1.35 to 1.59), and in 2005 it had increased by 1.61-fold (95% CI, 1.49 to 1.75). Overtime, the prevalence of dyslipidemia tended to increase in both males and females, but the prevalence rate in males increased more quickly (Table 4).
In the 2005 survey, awareness, physician diagnosis, treatment rate, and control rate in individuals over age 30 diagnosed with dyslipidemia were examined. The awareness rate, physician diagnosis rate, and treatment rate were slightly higher in females (Table 5). The control rate of dyslipidemia, when examined according to the presence of accompanying risk factors, was 56.3% in the 0 to 1 risk factors group, and 13.1% in the group with two or more risk factors (data not shown).
DISCUSSION
In this study, the lipoprotein distribution and prevalence of dyslipidemia were estimated based on data from KNHANES conducted in 1998, 2001, and 2005. The yearly changes in the trends of prevalence were also analyzed. The prevalence of dyslipidemia in participants over age 20 was 32.4% in 1998, 42.6% in 2001, and 44.1% in 2005. The results also showed that the prevalence was higher in males than in females. The prevalence of dyslipidemia in males was 38.4%, 53.9%, and 54.5%, respectively, and 27.1%, 34.8%, and 34.0% in females, respectively.
Dyslipidemia is the most manageable risk factor of atherosclerotic cardiovascular disease. The relationship between increased cholesterol and mortality rate due to coronary heart disease has been reported in numerous epidemiological studies [11,12]. A previous study reported that both total cholesterol and LDL-C increase total mortality rates [13]. According to a meta-analysis of several epidemiological studies, when HDL-C increased by 1.0 mg/dL, the occurrence of coronary heart disease decreased by 2% to 3% [14].
In the KNHANES data analysis, hypo-HDL-cholesterolemia had the highest prevalence rate, followed by hypertriglycemia. The high HDL-C and triglyceride levels are thought to be caused by Korea's carbohydrate-centered diet [15] and are also correlated with a recent rapidly increased prevalence of obesity and type 2 diabetes. In particular, high triglyceride levels in diabetic patients are very common. In populations with high triglyceride levels, the incidence of cardiovascular disease is over two times higher compared to that in populations with normal levels [16]. In the KNHANES, the prevalence of hypertriglycemia in the normal glucose group was 6.7% and the prevalence of hypo-HDL-cholesterolemia was 30.7%, whereas in the impaired fasting glucose group, they were 14.9% and 42.4%, respectively, and in the diabetes group, they were 20.1% and 46.8% (P<0.0001).
Based on the type of dyslipidemia, the risk of coronary artery disease differs between genders. LDL-C is the most indicative predicting factor in males, while HDL-C is the most indicative factor in females, while triglycerides are the second most indicative in both sexes [17,18]. The mean cholesterol concentration in females was lower than that in males in our analysis. However, there were more females with hypercholesterolemia with cholesterol concentrations over 240 mg/dL. One possible reason is that pre-menopausal females have lower lipid levels than males due to hormonal effects, but after menopause lipid levels rapidly increase and become similar or higher than that of males [19,20]. In the KNHANES III survey (2005), the prevalence of dyslipidemia increased with age. After the prevalence of dyslipidemia in males peaks in their 50s and in women in their 60s, it decreases slightly, and we observed that the onset of dyslipidemia occurs 10 years later in women than in men. Our analysis showed that more than half of the individuals aged 50+ had dyslipidemia. Yet, the awareness rate of dyslipidemia and the treatment rates are still low, and treatment is limited to hyper-LDL-cholesterolemia [21,22]. In this study, the prevalence of dyslipidemia continuously increases, especially first appearing in younger males in 20s and 30s. In order to prevent cardiovascular disease, it is necessary to educate, screen, and aggressively treat dyslipidemia in younger age subjects.
The mortality rate of cardiovascular disease in Korea is still lower than that in the USA. When the actual distribution of lipoproteins by age and gender were compared with the United States, the mean total cholesterol levels of Korean above age 20 were lower. The LDL-C levels of Korean were also lower. However, triglyceride levels in Korean participants were higher than that of participants from the United States. HDL-C levels were lower in Koreans than in Americans. Especially, HDL-C and triglyceride levels in Korean females were much worse than in females from the United States [23]. In the USA, between 1960 and 2002, total cholesterol and LDL-C levels had continuously decreased due to ongoing efforts, and cardiovascular disease had decreased. However, triglyceride levels increased as a result of continuously increase in prevalence of diabetes and obesity [24]. Since Koreans have significantly higher triglyceride levels than Americans, proper management is urgent. In the USA, the prevalence of hypercholesterolemia (≥260 mg/dL) was 34.2% in males and 41.6% in females [23]. In recent years, total cholesterol decreased in the USA but still higher than in Koreans.
In Japan, total cholesterol levels have increased by 5 mg/dL in the last 10 years. The total cholesterol levels in Japanese were 10 to 20 mg/dL higher than in Koreans in all age groups. However, LDL-C levels were similar, HDL-C was 14 mg/dL higher and triglyceride levels were 20 mg/dL lower in Japanese than in Koreans [25]. Since the definitions of hypercholesterolemia, hypertriglycemia, and dyslipidemia are not identical, care is needed when interpreting these results.
Although it is based on a national representative survey, this study also has several limitations. First, this is a cross-sectional analysis and cannot investigate the factors affecting prevalence and management of dyslipidemia. Second, dyslipidemia was defined based on blood tests in 1998 and 2001, but was defined through an integration of blood tests, physician diagnosis and treatment in 2005. Differences in the definitions of dyslipidemia might affect the prevalence estimation and make direct comparisons difficult. Third, the health interview and the health behavior surveys were not consistent over time, and the treatment and control rates were estimated only in the 2005 survey.
In conclusion, by analyzing datasets from the KNHANES conducted in 1998, 2001, and 2005, we observed an increase in the prevalence of dyslipidemia in Korea. In 2005, the prevalence approached nearly 50% of the adult population over age 30. The primary forms of dyslipidemia were hypo-HDL-cholesterolemia and hypertriglycemia. These findings suggest that more intense efforts are required to prevent from and control dyslipidemia in Korean adults.
 XML Download