

 PDF
PDF ePub
ePub Citation
 Print
Print


INTRODUCTION
Monolithic zirconia restorations have been widely used because of their excellent mechanical strength and biocompatibility.123 Clinical adjustment of zirconia restorations is necessary when a restoration exhibits premature occlusal contacts or inadequate contours on delivery.456 The grinding process during adjustment removes the polished layer and results in rough surfaces,7 which may cause clinical complications such as wear of the antagonistic dentition,8 accumulation of dental plaque,9 and color staining.10 Therefore, further surface smoothing is necessary before the restoration is placed in the mouth.
Glazing and polishing are two options for surface smoothing of zirconia restorations.1112 Although glazing is a popular method for restoring the high-gloss surface of the restoration, glazed layers can reportedly become worn within 6 months of the restoration.12 The polishing procedure, on the other hand, does not add any layer to the surface of the monolithic zirconia restoration. The polishing alone removes the material by abrasion in which polishing abrasives transmit the mechanical energy to the material, resulting in changing of the surface roughness.6 Moreover, this method can produce surface roughness of 0.2 µm, which less than or equal to that achieved with glazing.713 Surface roughness ≤ 0.2 µm provides minimal plaque accumulation and comfortable tactile sensation.914 Therefore, zirconia polishing may be an effective and time-saving alternative to glazing.1516
Surface smoothing can be subdivided into three major stages: coarse finishing, intermediate polishing, and final polishing.17 Coarse finishing uses coarse-grit grinding instruments to obtain the desired contours of the restoration by removing excess restorative materials. Intermediate polishing uses medium-grit instruments to level the grooves and scratches created by the coarse-finishing process. Final polishing aims to produce a very smooth, light-reflective, enamel-like surface on the restoration through use of fine-grit instruments. To achieve the desired smoothness, it is recommended that instruments be employed sequentially from coarse to fine with different revolutions per minute (RPM) for each step.1819
Zirconium-dioxide exists in three crystalline phases, depending on the temperature.2 At room temperature, zirconia usually exists in a monoclinic phase, which has a lower density than the other phases. By heating zirconia to 1170℃, the monoclinic phase transforms into the tetragonal phase, which provides better mechanical properties. The tetragonal phase transforms into the cubic phase at 2370℃. The cubic phase has moderate mechanical properties and is stable up to 2680℃. The crystal phase transformation depends on temperature and is reversible.2 In order to maintain the tetragonal phase at room temperature after heating and fusion, stabilizing oxides (CaO, MgO, CeO2, Y2O3) are added to zirconia crystals.20 However, because the tetragonal phase is only partially stabilized,21 unfavorable phase transformation from the tetragonal phase to the monoclinic phase may occur when external energy is provided. This change leads to crystal volume expansion of 3 – 4% at the involved area, which could be advantageous in resisting harmful crack propagation, but could cause unstable residual stress.2223 Shape adjustments and finishing of zirconia in the clinic provides external energy to the zirconia crystal through local generation of heat and frictional force, which causes m phase transformation.23
Although finishing and polishing procedures are important for clinical success,1518 the effects of surface treatment protocols in combination with popular polishing systems have not been fully investigated. The purpose of this study was to evaluate the influence of surface treatment protocols and systems for finishing and polishing on the surface topography, bacterial adhesion, and phase transformation of monolithic zirconia. The first null hypothesis was that the surface treatment protocol would not have an influence on roughness of zirconia, regardless of the polishing systems used. The second null hypothesis was that use of different polishing systems on monolithic zirconia would not result in any significant differences in crystal structure or bacterial adhesion.
MATERIALS AND METHODS
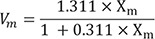
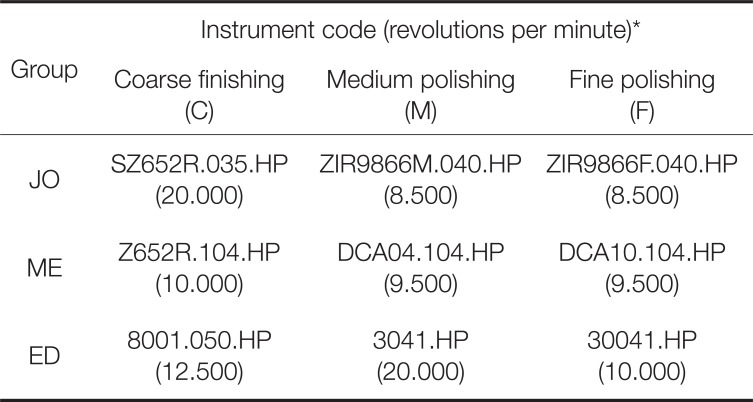
Three hundred square-shaped (20.0 mm × 20.0 mm × 2.8 mm) monolithic zirconia specimens were designed using computer software (CATIA V5R19, Dassault Systemes, Velizy-Villacoublay, France) and were manufactured with a 5-axis milling machine (Ceramill Motion 2, Amann Girrbach, Koblach, Austria) using zirconia blocks (Prettau, Zirkonzhan, Au, Switzerland). The specimens were randomly assigned to three groups (100 specimens per group) according to the polishing system used: Jota (Jota kit 1434, Jota, Rüthi, Switzerland) (JO group), Meisinger (LUS85, Meisinger, Centennial, CO, USA) (ME group), and Edenta (Magic KIT Zir; Edenta GmbH, Lustenau, Austria) (ED group). The specimens for each system were further subdivided into four groups based on the surface treatment protocol used (25 specimens per protocol) (Fig. 1): coarse finishing alone (C protocol); coarse finishing and medium polishing (CM protocol); coarse finishing and fine polishing (CF protocol); coarse finishing, medium polishing and fine polishing (CMF protocol). All specimens were polished according to the protocols using an electronic low-speed handpiece (KaVo EXPERTmatic E10 C, KaVo, Biberach, Germany) with backward movement at 20 seconds per step. The instruments and rpm used for the surface treatments are presented in Table 1.
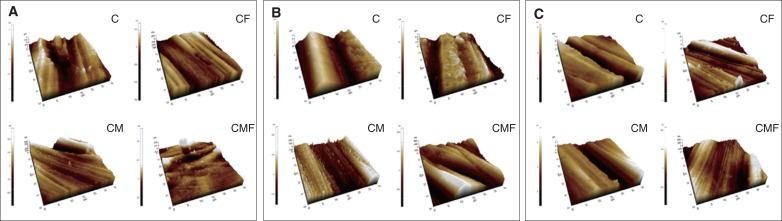
The surface roughness (Ra) values for zirconia specimens were determined using atomic force microscopy (AFM) (NX20, Park Systems, Suwon, Korea) and measurement software (Smartscan, Park Systems) using the noncontact mode at a scan rate of 1 Hz and 256 × 250 pixel resolution. The Ra for each specimen was calculated by averaging three measurements. The three-dimensional surface topography was visualized using the analysis software (XEI, Park Systems).
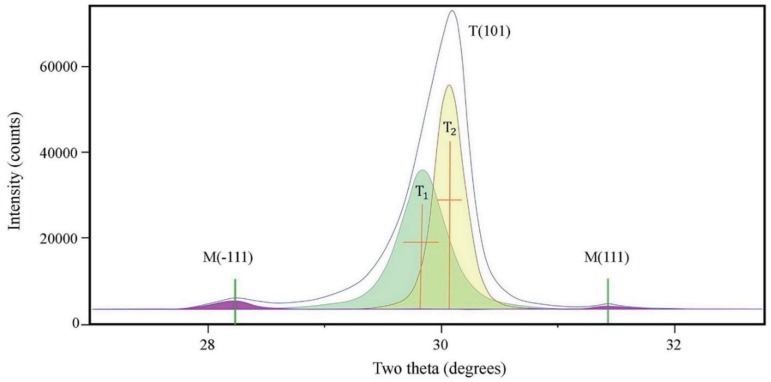
Structural studies of crystal phase transformation were performed for the three polishing systems using an X-ray diffractometer (XRD) (X'Pert PRO MPD, PANalytical, Almelo, The Netherlands). Diffraction patterns were obtained using Cu-Kα radiation (λ = 1.5406 Å) in the range of 20 – 40° of 2θ with a step size of 0.016° and step duration of 50.165 s. The peaks were refined using pattern-decomposition and profile fitting functions of the software (HighScore Plus; PANalytical), which provided an asymmetric Pearson type VII function to distinguish among different phases.24 When the tetragonal T(101) peak at 2θ = 29.807° was asymmetric, the intensity of the peak resolved into individual peaks: T1 (refined T[101]) and T2 (partially transformed T[101]) (Fig. 2). The monoclinic peak intensity ratio (Xm) and the monoclinic volume (Vm) were calculated as percentages with formulas (1) and (2) below:2425
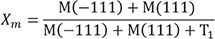
Where M(−111) and M(111) are the monoclinic peak intensities at 2θ = 28.175° and 31.468°, respectively; T1 is the refined T(101) peak intensity.
The partially transformed tetragonal peak intensity ratio (T0) was calculated with formula (3):
Streptococcus mutans (ATCC 25175) was used to assess biofilm formation. S. mutans was maintained on brain heart infusion (BHI) medium and grown under aerobic conditions. An in vitro biofilm formation assay was performed according to published protocol.26 Briefly, S. mutans colonies were inoculated into BHI-1% sucrose broth and incubated overnight. The culture broth was inoculated into 3 mL of the same liquid medium to reach 1% (v/v) in the 6-well polystyrene plate containing each specimen. After incubation for 16 hours, streptococcal broth was removed, and the specimens were washed three times with sterile phosphate-buffered saline solution to remove loosely attached biomass. For biofilm quantification, 200 µL of crystal violet solution (0.2 % w/v in 10% ethanol) was added to the specimens, followed by incubation for 1 hour. After washing with phosphate-buffered saline solution three times, the specimens were air-dried. Crystal violet retained by the streptococcal biofilm was redissolved in 200 µL acidic solvent (10% acetic acid in distilled water); absorbance was determined with a microplate reader (Molecular Devices; San Jose, CA, USA) at 595 nm.
All statistical analyses were conducted using a statistical software package (IBM SPSS Statistics v22.0 for Windows; IBM Corp., Armonk, NY, USA). After determining normal distribution (Shapiro-Wilk test) and equal variances (Levene test), the results of surface roughness and bacterial adhesion were compared using one-way analysis of variance (ANOVA) and Tukey's test. Interactions between surface treatment protocols and polishing systems on the final roughness were statistically investigated with two-way ANOVA. Statistical significance was set at P < .05.
RESULTS
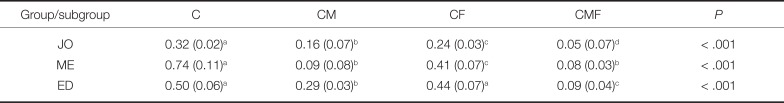
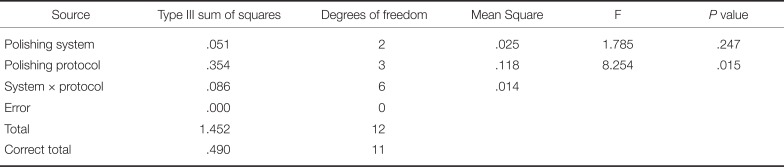
The surface roughness values of specimens treated by different surface treatment protocols and polishing systems are presented in Table 2 and Fig. 3. The CMF protocol resulted in significantly lower Ra values than did the other protocols for JO and ED groups (P < .001). ME group also showed lower Ra values in CMF protocol than in CM protocol, but the difference was not statistically different. The CM protocol resulted in lower Ra values than did the CF protocol (P < .001). In comparing finishing and polishing systems, the JO group generally exhibited the lowest roughness values, followed by the ME and ED groups. Two-way ANOVA showed significant interaction between the surface treatment protocol and the polishing system on the resulting roughness (P < .001) (Table 3).
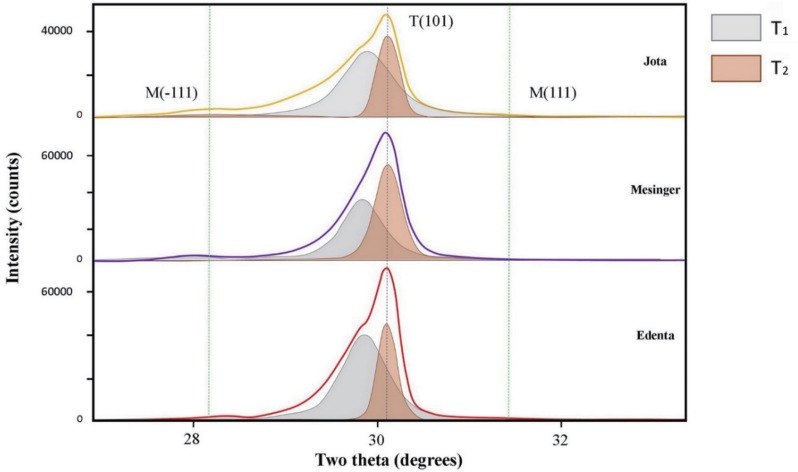
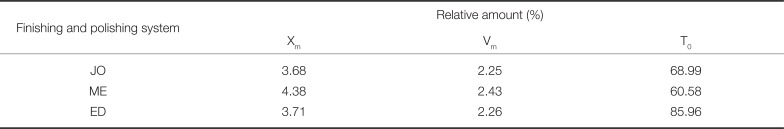
The XRD patterns for each system after use of the CMF protocol are presented in Figure 4. The major peaks of the tetragonal phase were located at 30.1° (2θ), corresponding to the orientation T(101). For the monoclinic phase, two peaks were observed at 28.2° and 31.2° (2θ), corresponding to orientation M(111) and M(−111). Xm, Vm, and T0 values for specimens are presented in Table 4. The JO group exhibited the smallest Xm and Vm, followed by the ED and ME. The T0 ranged from 60.58% to 85.96%. The smallest T0 was found on the specimens in the ME group, while the highest ratio was found on specimens in the ED group.
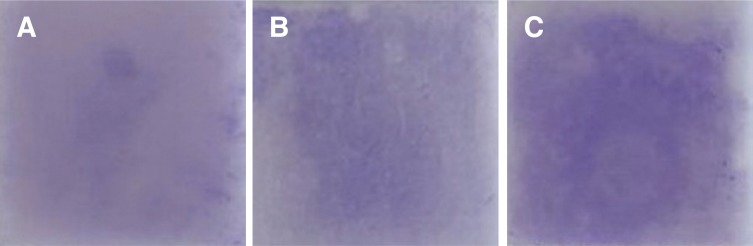
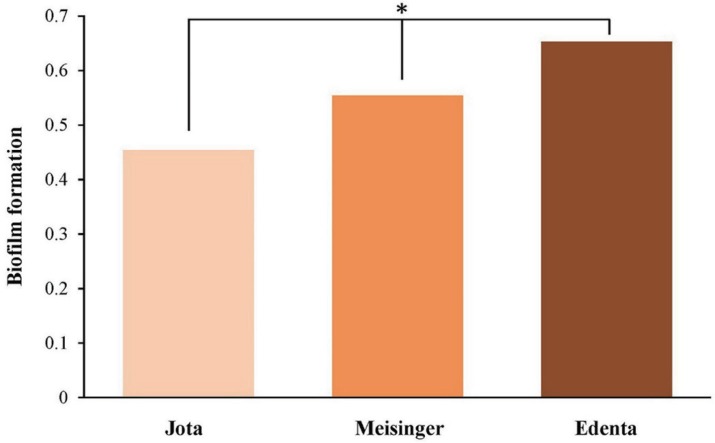
In vitro streptococcal biofilm formation on specimen surfaces after use of the CMF protocol were compared among systems (streptococcal biofilm with crystal violet staining) (Fig. 5). S. mutans biofilm formation increased significantly in ED group specimens, followed by ME and JO group (P < .001) (Fig. 6).
DISCUSSION
This study investigated the surface topography, crystal structure change, and biofilm formation of monolithic zirconia treated by various finishing and polishing protocols and systems. Our results showed that differences in instrumentation protocols and systems led to different roughness, crystal phase transformation, and bacterial adhesion characteristics. Thus, the first and second null hypotheses were rejected.
Determining a proper surface treatment protocol to produce smooth surfaces with a limited time, instruments, and application steps has become a crucial point of interest.272829 Preis et al. conducted research on 14 different commercial zirconia polishing kits and found that the unequal effectiveness of different polishing systems may not be affected by the number of polishing steps but may depend on the sequence of those steps.15 In this study, omission of a polishing step significantly influenced the surface roughness. Clearly, a complete polishing protocol without omission of any of the polishing steps produced the best surface smoothness for zirconia. Coarse-grit finishing and medium-grit polishing burs were essential for smoothing deep grooves and scratches. When the medium-grit polishing bur was omitted, use of the fine-grit polishing bur alone did not effectively reduce roughness. Sequential application of polishing steps, with focus on coarse-grit finishing and medium-grit polishing burs, was a key to achieving a smooth surface.
The overlapping peaks observed on XRD demonstrate an intrinsic problem in analyzing the crystal structure of a material. Zirconia exhibits a phase transformation between monoclinic, tetragonal, and cubic phases. Taking into account coexistence between monoclinic and tetragonal phases in the XRD pattern of zirconia after surface treatment, elucidating contributions of each of these different phases is essential to accurate analysis of a complex XRD profile.30 The phase transformation of zirconia after surface treatment has been evaluated in numerous studies.13181931 In general, the m → t peak was endothermically symmetrical, but the t → m peak was asymmetrical with an abrupt side.30 Based on results of classical and simple XRD analysis methods, the phase quantification underestimated the monoclinic phase by overestimating the tetragonal proportion. Through use of profile fitting and decomposition methods, all peaks are properly included, and the contributions of the overlapping peaks were accurately separated. Therefore, this study described not only the transformation trend, but also provided more precise peak analyses regarding the position, intensity and shape of each individual peak in diffraction patterns.
Oral bacterial biofilm formation on the surfaces of restorations lead to surface biodegradation, secondary caries, gingivitis, and mouth odor.32 Surface roughness has been identified as the most important factor in biofilm formation.9 Based on the results of this study, the rougher surfaces exhibited higher initial bacteria formation. Correlation of surface roughness and bacterial adhesion could be explained by the theory of bacterial adhesion and retention.33 There are four phases of bacterial adhesion, including transportation of the bacterium toward the surface, initial bacterial adhesion, attachment by specific interactions, and colonization of the surface.33 Physically, the initial bacterial adhesion requires interaction between bacteria and the surface from a distance of approximately 50 nm through a combination of electrostatic attractive and repulsive forces. Rough surfaces exhibit irregular geometry in which bacteria are strongly protected against shear forces and provide favorable circumstances for bridging distances.9 Thus, attachment is more strongly established on a rough surface.
The final characteristic of the zirconia surface is influenced by extrinsic and intrinsic factors. This article included surface treatment protocols and commercial finishing and polishing systems as experimental factors, which are clinically important extrinsic interventions. The grinding modes and types of the rotary handpiece are other extrinsic factors that affect the results of finishing and polishing. The zirconia block itself is a fundamental intrinsic factor that should be considered when evaluating a surface finishing and polishing method.34 Thus, these factors should be included in the study design of future investigations. Moreover, largesize clinical prospective trials will be needed to confirm the results of the current in vitro study.
CONCLUSION
This study demonstrated that differences in surface treatment protocols and polishing systems led to different roughness, crystal phase transformation, and bacterial adhesion characteristics. Sequential application of polishing steps, focusing on use of both coarse-grit finishing and medium-grit polishing burs, was a key to achieving a smooth surface. Moreover, special consideration should be given to selecting a commercial polishing system.
 XML Download