

 PDF
PDF ePub
ePub Citation
 Print
Print


INTRODUCTION
Alzheimer's disease (AD) is the main cause of dementia. This disease typically presents with episodic memory impairment, which reflects previous degradation of the medial temporal lobe. The hippocampus is one of the earliest affected brain regions in AD,1 and its degradation has been found to be a hallmark of AD in many structural and functional imaging studies. Hippocampal volume loss and atrophy rates were found to differ significantly between AD patients and controls, and are probably good candidates for predicting the progression to AD.23 The loss of synapses in the hippocampus in AD has been consistently found in histological studies4 and diffusion-tensor imaging studies.56 Functional connectivity as revealed using resting-state fMRI has received particular attention in brain imaging research, and has also been researched in AD. Alterations in functional connectivity between AD and control groups have been reported,78 with decreased hippocampal connectivity found in patients with AD.9
Attention has recently been paid to two specific classifications of AD based on the age at the appearance of disease symptoms: early-onset Alzheimer's disease (EOAD) and late-onset Alzheimer's disease (LOAD). Previous studies have shown that EOAD and LOAD patients exhibit differences in both clinical characteristics and neuroimaging findings. EOAD shows more diverse cognitive impairments than LOAD, such as reduced attention, decreases in lingual, visuospatial, and frontal-executive function, impaired memory, and apraxia. This functional degradation in EOAD progresses more rapidly than that in LOAD.1011 Structural imaging studies of the cortical thickness1112 and shape1314 and using [18F]fluorodeoxyglucose positron-emission tomography1516 and [11C]Pittsburgh compound-B positron-emission tomography17 have also demonstrated significant differences between EOAD and LOAD.
A particularly interesting finding was that the hippocampal sparing occurred at a younger age in AD groups in both pathological18 and structural imaging19 studies. We therefore hypothesized that different functional mechanisms underlie EOAD and LOAD, and that the functional connectivity between the hippocampus and other brain regions can be differentiated according to the age at the onset of AD. In this study, we investigated changes in functional connectivity in the bilateral hippocampus between patients with EOAD and LOAD using resting-state fMRI.
METHODS
Participants
Patients
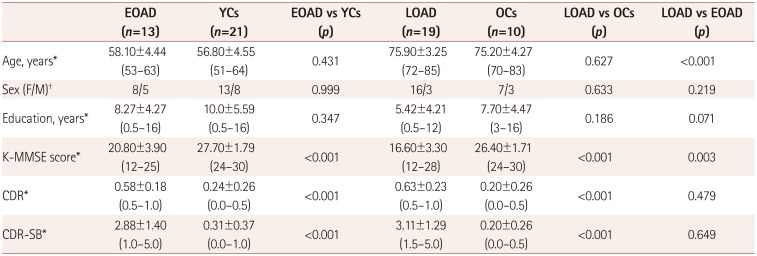
According to the age at the disease onset, we prospectively recruited 13 patients with EOAD (onset at younger than 65 years) and 19 patients with LOAD (onset at 65 years of age or older) from the Memory Disorder Clinic at Gachon University Gil Medical Center. The patients met the criteria for probable AD as proposed by the National Institute of Neurological and Communicative Disorders and Stroke, and the Alzheimer's Disease and Related Disorders Association.20 None of the patients had a family history suggestive of an autosomal dominant disease. We excluded patients with other structural lesions found in brain MRI, such as a brain tumor, hydrocephalus, territorial infarction, intracranial hemorrhage, or severe white-matter hyperintensities (defined as a cap or band with a maximum diameter measured perpendicular to the ventricle of ≤10 mm, or a deep white-matter lesion with a maximum diameter of ≤25 mm, as modified from the Fazekas ischemia criteria).21 To ensure a clear distinction between EOAD and LOAD, patients between 65 and 70 years old were excluded. The demographic characteristics of the participating subjects are summarized in Table 1.
Controls
We recruited 31 healthy volunteers to serve as normal controls (NCs). These subjects had no history of neurological or psychiatric illnesses and no abnormalities in a neurological examination. The NC group exhibited normal cognition in the Mini Mental State Examination and detailed neuropsychological tests. To compare AD groups with their age-matched control groups, the NC group was divided into two subgroups, young controls (YCs) and old controls (OCs), based on whether the subjects were younger or older than 65 years, respectively. Among 31 NCs, 21 were designated as YCs10 were designated as OCs.
This study was approved by the Institutional Review Board of Gachon University Gil Medical Center (approval no. GIRB D0003-2012). We obtained informed consent from all of the patients and control subjects.
Neuropsychological tests
The patients and NCs underwent a standardized neuropsychological battery of tests called the Seoul Neuropsychological Screening Battery (SNSB).22 This battery contains tests for attention, language, praxis, four elements of Gerstmann syndrome, visuoconstructive function, verbal and visual memory, and frontal/executive function. Among these subtests, the tests with quantitative scores used in the current study included digit span (forward and backward), the Korean version of the Boston Naming Test, the Rey-Osterrieth Complex Figure Test (copying, immediate and 20-minute delayed recall, and recognition), the Seoul Verbal Learning Test (SVLT; 3 learning free-recall trials of 12 words, a 20-minute delayed-recall trial for those 12 items, and a recognition test), the phonemic and semantic Controlled Oral Word Association Test, and the Stroop Test (word and color reading of 112 items during a 2-minute period). The resultant SNSB scores for each subject were converted into standard scores (z-scores) derived using adjusted norms for age and education level.
We also performed evaluations using the Korean version of the Mini Mental State Examination (K-MMSE), Clinical Dementia Rating (CDR), Clinical Dementia Rating Sum of Boxes, and the Geriatric Depression Scale.
Scan protocol
T1-weighted structural MRI and fMRI data were acquired using 3-T MRI (Verio, Siemens, Germany). A T1-weighted scan with an MPRAGE3D pulse sequence was performed using the following parameters: repetition time (TR)=1,900 ms, echo time (TE)=3.3 ms, flip angle=9°, and voxel size=1.0×1.0×1.0 mm3. For functional connectivity, patients were scanned for 9 minutes using gradient-echo echo planar imaging (EPI) with the following parameters: TR=3,000 ms, TE=30 ms, and voxel size=3.5×3.5×3.5 mm3. The participants were instructed to open their eyes and to not move their head during fMRI data acquisition.
Image analysis
The Resting-State fMRI Data Analysis Toolkit (Beijing Normal University, Beijing, China) was used to assess functional connectivity. T1-weighted MPRAGE3D images were coregistered to the EPI images and segmented using Diffeomorphic Anatomical Registration Through Exponentiated Lie algebra (DARTEL) algorithm implemented. The EPI data were realigned to remove head motion that had occurred during data acquisition. Structural and functional images were normalized to the Montreal Neurological Institute template based on the segmented T1-weighted structural MRI images. Detrend and bandpass filters (0.01–0.08 Hz) were applied to remove linear drift and physiological noise, respectively. An isotropic three-dimensional Gaussian smoothing filter with a 6-mm full width at half maximum was applied to suppress spatial noise. Based on a region defined in the automated anatomical labeling, the left and right hippocampi were selected as the seed regions; Pearson's product-moment correlation coefficients were calculated for the correlations of the averaged signals within the selected region of interest with the other signals in the other voxels. The correlation-coefficient maps were converted into z-maps using Fisher's r-to-z transform in order to improve consistency with normality.
Statistical analysis
Commercial statistics software (SPSS Statistics version 18, SPSS Inc., Chicago, IL, USA) was used to assess group differences in demographic variables and cognitive test results between patients with EOAD or LOAD and each age-matched NC group. Student's t-test was used when analyzing continuous variables, while the chi-square test was used when analyzing categorical variables.
SPM8 (Wellcome Trust Centre for Neuroimaging, University College London, London, UK) was used to statistically analyze the correlation-coefficient map of the resting fMRI data. A two-by-two factorial design was adopted for the secondary analysis of the correlation map in order to identify group differences in hippocampal connectivity. The two factors were onset age and presence of the disease, while the number of years of education, sex, and age of subjects were adjusted as the covariates. Each AD group was compared with the corresponding control group using the (EOAD-YCs) and (LOAD-OCs) contrast. The interaction effect between the onset age and presence of the disease was analyzed using the (LOAD-OCs)-( EOAD-YCs) contrast. The significance cutoff was set to p<0.005 in this analysis.
RESULTS
Neuropsychological tests
As indicated in Table 1, age differed significantly between the EOAD and LOAD groups (p<0.001). As expected, the K-MMSE score and CDR differed significantly between controls and patients, both in the EOAD and LOAD groups (p<0.001), with the mean K-MMSE score being significantly higher in the EOAD group than the LOAD group (p=0.003).
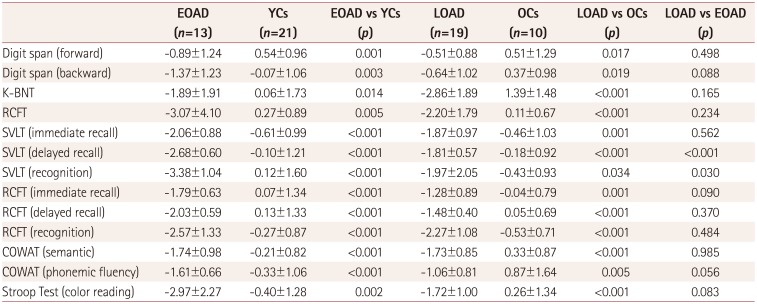
The SNSB was applied to evaluate the impacts of AD on various cognitive functions. As expected, the scores were significantly lower in patient groups than the corresponding control groups in each SNSB test. SVLT delayed recall and SVLT recognition were worse for EOAD than for LOAD (Table 2).
Voxel-wised hippocampal connectivity between EOAD and LOAD
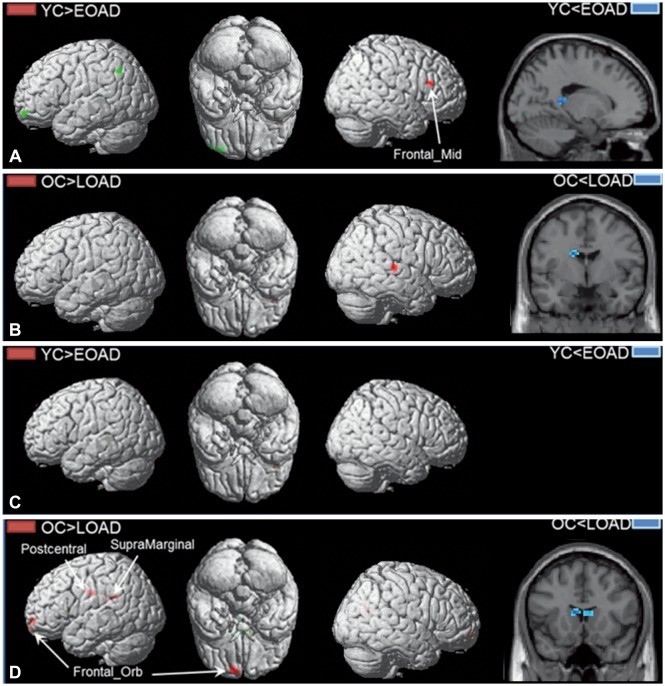
Hippocampal connectivity in the EOAD and LOAD groups was compared to that in the corresponding age-matched control groups, as shown in Fig. 1. Left hippocampal connectivity to the right middle frontal cortex was decreased in the EOAD group compared to the YCs. No significant difference was observed in right hippocampal connectivity in the EOAD group. In the LOAD group, the left hippocampal connectivity to the left middle temporal cortex was decreased while that to the left caudate nucleus was increased. The right hippocampal connectivity to the left orbitofrontal cortex, left postcentral cortex, left supramarginal cortex, and right rolandic operculum was decreased in the LOAD group compared to the OCs, while that to the bilateral caudate nucleus was increased.
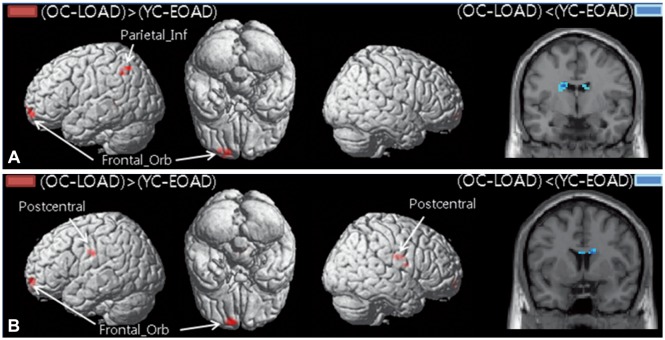
In order to detect the interaction effect between the disease presence and onset age, hippocampal connectivity changes were calculated using the (OCs-LOAD)-(YCs-EOAD) contrast, as shown in Fig. 2. The difference in left hippocampal connectivity in the left inferior parietal cortex and the left orbitofrontal cortex was greater in the LOAD group than the EOAD group, relative to the corresponding control groups, while the EOAD group showed a greater difference than the LOAD group in the left caudate nucleus, relative to the corresponding NC. The LOAD group showed a greater difference in right hippocampal connectivity in the bilateral postcentral cortex and the left orbitofrontal cortex than the EOAD group, relative to the corresponding control groups, while the EOAD group showed a greater difference than the LOAD group in the right caudate nucleus, relative to the corresponding control groups. The difference in the right caudate nucleus seems to be caused by the hippocampal connectivity being increased in the LOAD group compared to the OC group.
DISCUSSION
This study found that the hippocampal connectivity differed between EOAD and LOAD patients. Patients with LOAD showed decreased hippocampal connectivity with broad cortical areas compared to the corresponding control group, such as from the left hippocampus to the middle temporal cortex, and from the right hippocampus to the left orbitofrontal cortex, left postcentral cortex, supramarginal cortex, and right rolandic operculum. Conversely, functional connectivity in the bilateral hippocampus of patients with EOAD was relatively preserved, with only a decrease in the left hippocampal connectivity to the right middle frontal cortex.
The present LOAD results are consistent with the findings of previous studies involving patients with AD.923 Wang et al.9 reported that patients with mild AD showed decreased functional connectivity between the hippocampus and the medial prefrontal cortex, ventral anterior cingulate cortex, inferior temporal cortex, middle temporal cortex, and posterior cingulate cortex. Direct correlation analysis of the hippocampus showed a significant decrease in its functional connectivity with the posterior cingulate cortex and lateral parietal areas.23 In patients with LOAD, the functional hippocampal changes in the early stages of the disease may correspond to structural hippocampal changes. Previous studies have found that patients with LOAD show greater atrophy in the hippocampus2425 and rapid cortical thinning in the left parahippocampal gyrus.11 We therefore postulate that hippocampal atrophy in LOAD is closely related to the degradation of functional connectivity between the hippocampus and other cortical regions.
Patients with EOAD showed decreased left hippocampal connectivity only to the right middle frontal cortex, while the right hippocampus did not show any significant change in cortical area connectivity. This might be explained by previous findings of EOAD patients having more cortical atrophy and neurofibrillary tangles in the parietal cortex, lateral cortex, and frontal cortex than in the medial temporal area.1826 Furthermore, Cho et al.11 reported results for regions other than the hippocampus, with EOAD patients showing more rapid cortical thinning in various association cortices, and more gray-matter loss in the occipital and parietal lobes.2425 Although the medial temporal area is relatively spared in EOAD, these patients still report memory decline. Instead of hippocampal dysfunction, they may have dorsolateral prefrontal and parietal dysfunction, with deficits in attention and working memory. Conversely, their episodic memory impairments may result from precuneus damage or its extension to the retrosplenial region.21 Our data demonstrate that the functional connectivity of the hippocampus to most cortical regions in EOAD was not significantly decreased compared to that in the corresponding control group. The decreased connectivity between the left hippocampus and right middle frontal cortex may be associated with deficits in attention and working memory in patients with EOAD.
Instead of performing direct comparisons between EOAD and LOAD, we compared the differences of EOAD and LOAD with each corresponding control group classified according to age. However, this approach means that caution is required when interpreting the results shown in Fig. 2. The decreased hippocampal connectivity of the LOAD group compared to the OC group is more prominent than that of the EOAD group compared to the YC group in several cortical areas, including the left frontal orbital cortex and left inferior parietal cortex. This implies increased hippocampal impairment in the LOAD group relative to the EOAD group, as discussed above. However, the blue blobs at the caudate nucleus in Fig. 2 do not represent decreased hippocampal connectivity of the EOAD group compared to the YC group, but rather the increased hippocampal connectivity of the LOAD group compared to the OC group, according to Fig. 1B and D. These increased changes in the LOAD group may be explained by compensational recruitment in the subcortico-hippocampal connectivity of Papez's circuit due to the decreased corticohippocampal function.
Furthermore, this study involved a relatively small number of subjects. However, the obtained data are consistent with the findings of several other studies. This study is noteworthy because we observed differences in the functional connectivity of the hippocampus between the EOAD and LOAD groups. Nonetheless, future studies with large numbers of subjects are needed to bolster our results. This study involved patients with early-stage AD in both the EOAD and LOAD groups. Patients in the late stages of both EOAD and LOAD generally show impaired function and structural lesions, which suggests that EOAD and LOAD have different progressions in hippocampal dysfunction. It can be concluded that the differences in hippocampal connectivity between EOAD and LOAD may explain the differences in clinical presentations observed during the early stages of the disease course.
 XML Download