

 PDF
PDF ePub
ePub Citation
 Print
Print


INTRODUCTION
Gastric cancer (GC) is the fourth most common cancer and the second leading cause of cancer-related deaths worldwide.1 Although the survival rates of GC still remain poor,2 the overall 5-year relative survival rate has increased, especially in Northeast Asia.3 Such high survival rates may be due to the effectiveness of mass screening programs for early detection of GC using endoscopic examination and GC-specific biomarkers in this area.4 Therefore, early diagnosis of localized GC using screening programs is clinically important. Endoscopic examination is an ideal, highly reliable technique for early detection of GC, but its usefulness for GC screening is somewhat limited compared to serological biomarkers due to its high cost and the risks associated with the invasive procedure. Serological tumor biomarkers should have significant advantages as they are easily accessible molecular markers with cost benefits. However, some limitations exist for clinical application of blood biomarkers since very few blood biomarkers are available, such as carcinoembryonic antigen (CEA), cancer antigen (CA) 19-9, and CA 72-4, and the sensitivity of these serological biomarkers is low (20–30%) for diagnosis of GC.567 Therefore, research is still underway to identify effective serological biomarkers for GC.
A recent report suggested that a disintegrin and metalloproteinases (ADAMs) participate in tumor cell proliferation, adhesion and migration, and proteolysis, and there is growing evidence that specific ADAMs could play an important role as prognosis or predictive biomarker in human solid cancers.8910 These ADAMs regulate the activation of growth factors (e.g., EGF, TGF-a), cytokines (TNF-a), and integrins, which in turn promote tumor growth and metastasis.11 Moreover, targeting specific ADAMs by selective ADAM inhibitors is considered a promising therapeutic strategy.12 In a previous study, high expression of a disintegrin and metalloproteinase 8 (ADAM 8) in tumor tissue was significantly associated with advanced tumor stages; especially, invasion of lymph nodes and distant metastasis were significantly associated with poorer overall survival in GC. Other previous study reported that serum levels of ADAM 8 in GC patients were significantly higher than those in non-cancer group.1314 Although emerging evidence suggests that ADAM 8 is a potential biomarker for predicting GC development or progression, very few studies have evaluated correlations between blood ADAM 8 levels along GC carcinogenesis sequence and GC clinicopathological parameters, or their potential as a desirable blood biomarker for predicting GC development or progression.
In this study, we evaluated the blood ADAM 8 levels along “gastritis-dysplasia-carcinoma” sequence of gastric carcinogenesis,15 and analyzed the correlations between blood ADAM 8 levels and GC clinicopathological features. Furthermore, we validated blood ADAM 8 as a potential biomarker candidate for GC and compared it to serum CEA, a pre-existing biomarker for gastrointestinal tumors, using human blood samples.
MATERIALS AND METHODS
Study groups
Study groups were classified into five groups according to “gastritis-dysplasia-carcinoma” sequence of gastric carcinogenesis.15 Normal control group included subjects with normal gastric mucosa or simple gastritis, high-risk group included patients with low-grade or high grade dysplasia, early GC (EGC) group included subjects with GC confined within submucosal layer without metastasis, AGC without metastasis group included subjects with GC beyond proper muscle layer without metastasis, and AGC with metastasis group included subjects with GC beyond proper muscle layer with metastasis.
For the initial training dataset, a total of 80 subjects were enrolled. The following numbers of subjects were enrolled in each group: 20 in normal control group, 10 in dysplasia group, 20 in EGC group, 20 in AGC without metastasis group, and 10 in AGC with metastasis group.
For independent validation dataset, a total of 241 subjects were enrolled. The following number of subjects were enrolled in each group: 70 in normal control group, 24 in dysplasia group, 70 in EGC group, 50 in AGC without metastasis group, and 27 in AGC with metastasis group.
All subjects underwent upper gastrointestinal endoscopy (Types XQ-260, Olympus, Tokyo, Japan) in gastroenterology out-patient clinics or health check-up center of Gangnam Severance Hospital, Yonsei University College of Medicine, due to gastric symptom or routine check-up. Diagnosis was made based on histological findings via biopsy or surgical specimens. All patients were diagnosed for the first time during the enrollment period, and their blood samples were collected before they received any treatments. All patients in the cancer groups received imagining studies such as chest X-ray, abdominal-pelvic helical computed tomography, and whole-body positron emission tomography (PET) scan for TNM stage. TNM stage of GC was evaluated according to the 7th International Union Against Cancer-TNM stage for GC via radiological studies or surgical findings.16 Histopathologic differentiation was diagnosed using Lauren classification. Subjects who suffered from chronic diseases such as liver cirrhosis, chronic renal disease, and diabetes mellitus were excluded. Subjects with other cancers and gastric neoplasm such as gastrointestinal stromal tumor, mucosa-associated lymphoid tissue lymphoma, and neuroendocrine tumors were also excluded. Additionally, patients with a history of any previous treatment for GC or its premalignant lesions were also excluded.
Ethics statement
The current study was approved by the institutional review board of Yonsei University Health System (3-2019-0044), and all procedures were conducted according to the principles expressed in the Declaration of Helsinki. We enrolled subjects based on clinicopathological information such as age, gender, and disease contents using chart review blind to any personal information. Therefore, this study presented minimum risk to subjects and did not violate the right and welfare of subjects. We did our best to protect subjects' privacy and anonymity.
Measurement of blood levels of ADAM 8, CEA, IL-23; SDF-1α/CXCL12; IL-8 and sCD40L
Blood ADAM 8 levels were measured using a commercially available ELISA kit (SEA620Hu, CLOUD-CLONE, Katy, TX, USA). Briefly, all reagents, blood samples, and standards were prepared. In addition,100 µL standards or blood samples were added to each well in the pre-coated 96-well plate and reacted at 37℃ for 1 hour. After aspiration, the cells were washed three times, and then 100 µL of the prepared Reagent B was added, followed by reaction at 37℃ for 30 minutes. After five times of aspiration and washing, 90 µL of the substrate solution was added and reacted at 37℃ for 10–20 minutes. Finally, blood ADAM 8 levels were measured at 450 nm using VERSA max microplate reader (Molecular Devices Co., Sunnyvale, CA, USA). Blood CEA levels were measured using Beckman Access CEA assay (Beckman Coulter Inc., Chaska, CA, USA). Blood levels of interleukin-23 (IL-23), stromal cell-derived factor 1α (SDF-1α), interleukin-8 (IL-8), and soluble CD40 ligand (sCD40L) were measured by a commercially available MILLIPLEX MAP Human Cytokine/Chemokine Kit (Millipore, Billerica, MA, USA) using a chemiluminescent immunoassay according to the manufacturer's instructions. Briefly, filter plate was pre-wetted with 200 microliters (µL) assay buffer for 10 min at room temperature (RT), followed by vacuum removal of assay buffer. Twenty-five µL of standard or control was added to the appropriate well, and 25 µL assay buffer was added to the sample wells, but not the background well. Next, 25 µL of the appropriate matrix solution was added to the background, standard, and control wells, followed by addition of 25 µL sample to appropriate wells. After mixing, 25 µL beads were added, and the plate was incubated overnight at 4℃ with shaking. After incubation, the fluid was removed and the plate was washed twice. Detection antibodies (25 µL) were added, and the plate was incubated for 1 h at RT with shaking. Streptavidin-phycoerythrin (25 µL) was added to each well containing 25 µL detection antibodies and was incubated for 1 h at RT with shaking. Fluid was then removed, the plate was washed, and 150 µL sheath fluid was added. After re-suspension for 5 min, the median fluorescent intensity was read on Luminex 100™ IS (Luminex, Austin, TX, USA) and analyzed using logistic curve-fitting method to determine chemokine concentrations.
Statistical analysis
All assays were blinded and performed on the same day. Each value is expressed as mean with 25–75% standard deviation. Mean of each group was compared by ANOVA test with multiple comparisons using post-hoc Bonferroni method. An independent sample t-test was used to compare the means between cancer and non-cancer conditions. To evaluate the correlations between serum levels of tested values and clinicopathological parameters, Pearson's correlation (coefficient, γp) and Spearman's correlation (coefficient, γs) were performed, respectively. Primary GC size was classified into three groups of <3 cm, 3–5 cm, and >5 cm, in order to analyze the relationship between primary GC size and blood ADAM 8 levels. Receiver operating characteristic (ROC) curves were generated, and area under curve (AUC) was calculated to compare the diagnostic accuracy of each value to predict the presence of GC. Logistic regression analysis was performed to obtain the best sensitivity/specificity to predict the presence of GC as a single-marker or as a multiple-markers panel. Each marker was included as a linear term.
RESULTS
Blood levels of ADAM 8 compared to CEA in five groups (initial training dataset)
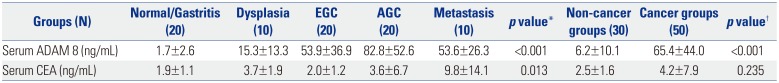
A total of 80 subjects were enrolled in initial training dataset. Blood ADAM 8 and CEA were measured according to GC carcinogenesis (five disease groups), and then compared among groups. Table 1 shows that the mean of blood ADAM 8 was significant different among groups (ANOVA, p<0.001, Table 1, upper panel), and it increased along the carcinogenic sequences; mean of blood ADAM 8 were 1.7±2.6 ng/mL in normal/gastritis group, 15.3±13.3 ng/mL in dysplasia group, 53.9±36.9 ng/mL in EGC group, 82.8±52.6 ng/mL in AGC without distant metastasis, and 53.6±26.3 ng/mL in AGC with distant metastasis, respectively. Interestingly, blood mean levels of ADAM 8 were remarkably increased from the early stage of GC. Table 1 shows that blood mean levels of ADAM 8 were significantly higher in EGC group compared to dysplasia group (high-risk, post-hoc Bonferroni, p<0.001) and normal control group (control, post-hoc Bonferroni, p<0.001). However, blood ADAM 8 levels were not significantly different among cancer groups, despite a tendency that these levels were maximized at locally advanced AGC without metastasis (post-hoc Bonferroni between EGC and AGC, p=0.086) and then slightly decreased after distant metastasis without statistical significance.
When the mean blood ADAM 8 levels were compared between cancer and non-cancer groups, levels in cancer groups (65.4±44.0 ng/mL) were significantly higher than those in noncancer groups (6.2±10.1 ng/mL, t-test, p<0.001, Table 1, lower panel).
Blood mean of CEA levels were not significantly different among groups, except in metastatic cases of AGC groups (Table 1, upper panel). This value was significantly elevated only in AGC with metastasis groups (ANOVA, p=0.013). When blood mean of CEA levels was compared between cancer and noncancer groups, no significant difference was found between cancer and non-cancer (p=0.235, t-test, Table 1, lower panel) groups.
Blood levels of ADAM 8 compared to CEA according to GC carcinogenic sequences in the following independent validation dataset
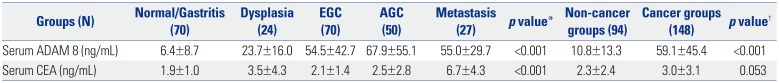
To test the reproducibility of results from the initial training dataset, we used an independent validation dataset. A total of 241 subjects were enrolled in validation dataset. Similar to the results of training dataset, mean of blood ADAM 8 were increased along carcinogenic sequences; mean of blood ADAM 8 were 6.4±8.7 ng/mL in normal/gastritis group, 23.7±16.0 ng/mL in dysplasia group, 54.5±42.7 ng/mL in EGC group, 67.9±55.1 ng/mL in AGC without metastasis, and 55.0±29.7 ng/mL in AGC with metastasis, respectively (ANOVA, p<0.001, Table 2, upper panel). This value was also remarkably increased from the early stage of GC, and it was not significantly different among cancer groups despite a tendency for it to be maximized at locally advanced AGC without metastasis (Table 2, upper panel).
When mean of blood ADAM 8 levels were compared between cancer and non-cancer groups, those of cancer groups (59.1±45.4 ng/mL) were significantly higher than those of non-cancer groups (10.8±13.3 ng/mL, t-test, p<0.001, Table 2, lower panel), similar to the training dataset.
Similar to the results of training dataset, blood mean of CEA levels was significantly elevated only in cases of AGC with metastatic groups compared to other groups, with no significant difference found between cancer and non-cancer groups in validation dataset (Table 2, lower panel).
Relationships between blood levels of ADAM 8 and clinicopathological characteristics of GC in validation dataset
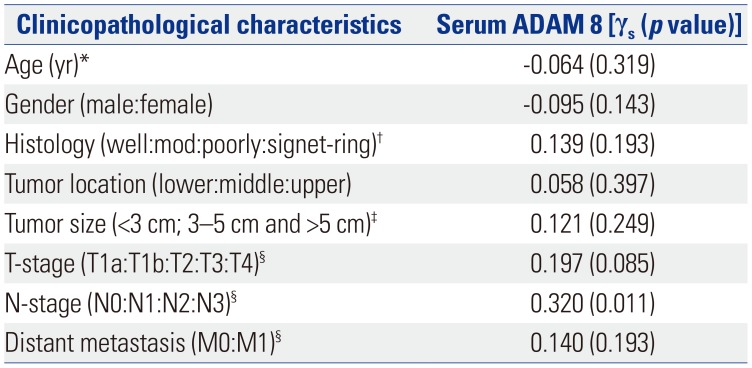
Table 3 showed that blood ADAM 8 levels were not affected by age (Pearson's correlation; γp=−0.064, p=0.319) and gender (Spearman's correlation; γs=−0.095, p=0.143). Histopathologically, serum ADAM 8 levels were not significantly correlated with the histological differentiation of GC (γs=0.139, p=0.193), primary GC location (γs=0.058, p=0.397), and primary GC size (γs=0.121, p=0.249). This value was also not correlated with depth of invasion (T-stage, γs=0.197, p=0.085) and distant metastasis (M-stage, γs=0.140, p=0.193) while it was closely correlated with N-stage (γs=0.320, p=0.011).
Diagnostic performance of blood ADAM 8, CEA, and their combination for prediction of GC presence in validation dataset
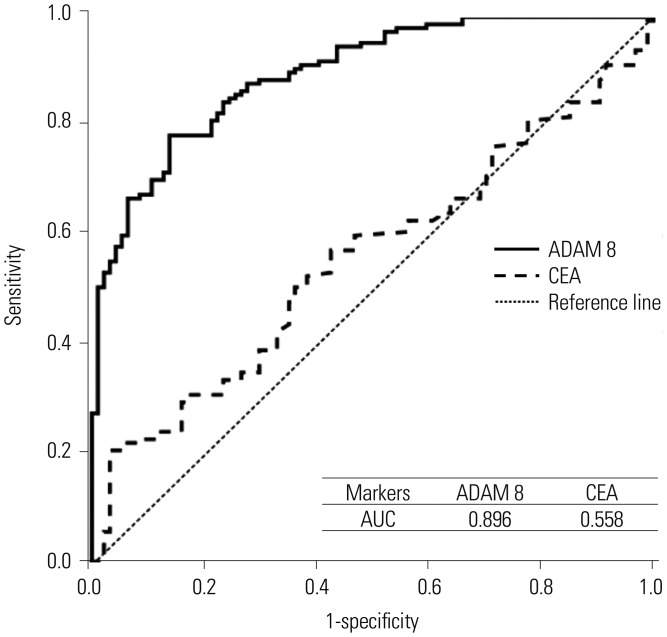
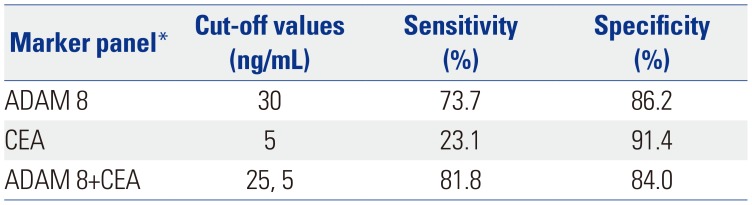
In validation dataset, ROC curve and calculated AUC of each value suggested that blood ADAM 8 has remarkable diagnostic potential for prediction of GC presence, superior to blood CEA (Fig. 1); AUC was 0.90 (95% CI, 0.86–0.33) in blood ADAM 8 and 0.56 (95% CI, 0.49–0.63) in blood CEA, respectively. Sensitivity and specificity of blood ADAM 8 to predict the presence of GC were 73.7% and 86.2% (cut-off value, 30 ng/mL) as a single-marker by logistic regression analysis (Table 4), which were superior to those of blood CEA (23.1% and 91.4%; cut-off value, 4 ng/mL), respectively.
Since the elevated pattern of blood ADAM 8 and CEA were significantly different from each other according to GC stage, combination of these serum markers as a multiple-markers panel was expected to be synergistic. As a multiple-markers panel, combination of serum ADAM 8 (cut-off value, 25 ng/mL) and CEA (cut-off value, 5 ng/mL) exhibited increased diagnostic accuracy compared to a single marker, remarkably (sensitivity, 81.8%; specificity, 84.0%; Table 4).
Correlations between blood levels of ADAM 8 and cancer-associated cytokines in validation dataset
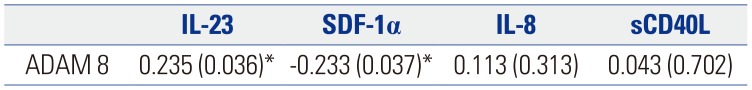
To investigate the role of blood ADAM 8 in carcinogenesis and progression of GC, the correlations between blood ADAM 8 levels and several GC-associated pre-inflammatory or proangiogenic cytokines levels were evaluated using validation dataset. Table 5 shows that blood ADAM 8 levels were closely correlated with blood IL-23 (γp=0.235, p=0.036) and blood SDF-α/CXC chemokine ligand 12 (CXCL12) (γp=−0.233, p=0.037), while blood ADAM 8 levels were not closely correlated with blood IL-8 (γp=0.113, p=0.313) and blood sCD40L (γp=0.043, p=0.702). That is, blood ADAM 8 was closely correlated preinflammatory cytokines (IL-23, SDF-1α/CXCL12), while it was not correlated with pro-angiogenic cytokines (IL-8, sCD40L).
DISCUSSION
ADAM 8 is a transmembrane protein that belongs to the ADAM family of proteins that mediate cell adhesion and cell migration through the cleavage of membrane-bound cytokines, growth factors, and receptors.17 A previous report has suggested that ADAM 8 ectodomain is cleaved by ADAM 8 itself.18 ADAM 8 was known to play potential roles in inflammatory and allergic processes,19 and further studies have shown that its overexpression is associated with progression and poor survival in various solid tumors.202122 A previous study reported that ADAM 8 in tumor tissue was an independent indicator of lymph node metastasis in human GC; however, its precise effects on GC progression and prognosis remain unclear. In this study, we investigated the clinical usefulness of blood ADAM 8 as a blood biomarker for early detection of GC. We evaluated the clinical implications of blood ADAM 8 as a biomarker for early diagnosis of GC as a single-marker or a part of combination panels, compared to blood CEA, a pre-existing gastrointestinal tumor marker, according to the guideline of Standards for Reporting of Diagnostic Accuracy statement.23 We found that blood levels of ADAM 8 were significantly different among groups (ANOVA, all p<0.001), and were increased significantly along the GC carcinogenesis in both initial training and following independent validation datasets (Tables 1 and 2, upper panel). These levels were significantly different between cancer and non-cancer groups (t-test, all of p<0.001; Tables 1 and 2, lower panel). Interestingly, this value was elevated from the EGC, different from many pre-existing serum biomarkers such as CEA. This means that the use of blood ADAM 8 may be very meaningful in predicting the presence of GC in replacement of endoscopy as a screening tool. However, blood ADAM 8 levels were not significantly different among cancer groups, although there was a tendency that these levels were maximized at locally advanced AGC without metastasis (post-hoc Bonferroni between EGC and AGC, p=0.086), and then slightly deceased after distant metastasis. According to Spearman's correlation analysis (Table 3), no association was found between serum ADAM 8 and either tumor size, depth of invasion (T-stage), and distant metastasis of GC. However, significantly close association was found between serum ADAM 8 and lymph node involvement (N-stage) (Table 3). A previous study reported that ADAM 8 protein expression in GC tissues was significantly correlated with invasion depth (T-stage), lymph node involvement (N-stage), and vessel invasion.13 The cause of difference between our results and those of previous studies may have originated from the difference in sample types (tissue vs. blood) or relatively small sample size of our study, especially in distant metastatic cases. Therefore, a large-scale study should be performed in the future to confirm these results.
Blood ADAM 8 showed higher diagnostic sensitivity than blood CEA (Fig. 1 and Table 4). Blood ADAM 8 alone showed 73.7% sensitivity and 86.2% specificity for diagnosis of GC. When blood ADAM 8 and blood CEA were combined, this panel showed higher sensitivity for diagnosis of GC (sensitivity; 81.8%, specificity; 84.0%). We also evaluated the diagnostic performance of ADAM 8 for GC using ROC curve and calculated AUC in validation dataset (Fig. 1), and found that AUC (0.90, 95% CI, 0.86–0.33) was remarkable for diagnostic performance for GC. The sensitivity, specificity, and AUC of blood ADAM 8 in our study were comparable or superior to those of a previous study that evaluated panel of five blood biomarkers, including ADAM 8.14 Overall, the sensitivity and specificity were improved when ADAM 8 and serum CEA were combined (81.8% and 84.0% at cut-off point, 25 ng/mL, 5 ng/mL, respectively).
In order to know more detailed role of blood ADAM 8 in carcinogenesis and progression process of GC, we evaluated the correlations between blood levels of ADAM 8 and pre-inflammatory cytokines (IL-23, SDF-1), and between blood levels of ADAM 8 and pro-angiogenic cytokines (IL-8, sCD40L) using validation dataset. In this study, blood ADAM 8 levels were closely correlated with blood IL-23 and serum SDF-1, while blood ADAM 8 levels were not closely correlated with blood IL-8 and serum sCD40L (Table 5). These results imply that blood ADAM 8 may be closely correlated in cancer-associated inflammation for cancer initiation or local invasion from the early stage of GC. However, blood ADAM 8 may be not be correlated in angiogenesis for distant metastasis.
One of the limitations of this study was that we did not evaluate the prognosis of GC patients according to serum levels of ADAM 8 directly through overall survival analysis, as observation period inthis study was too short to evaluate the overall survival of patients with GC. In a previous study, survival analysis demonstrated that patients with positive ADAM 8 expression in GC tissue had shorter survival times compared to those with negative expression. Further large-scale studies with long-term follow-up period should be performed in the future to confirm our current results.
In conclusion, we demonstrated that blood levels of ADAM 8 were closely associated with the development and progression of GC. However, high-levels of these values could not reflect the high probability of the presence of distant metastasis of GC. Additionally, blood levels of ADAM 8 demonstrated remarkable sensitivity and performance to predict the presence of GC, compared to blood CEA. To our knowledge, this is the first report to measure the serum levels of ADAM 8 along GC carcinogenic sequences, and the first to evaluate the clinical significance of high-levels of serum ADAM 8 in GC. Additionally, this study is the first to report that combined blood ADAM 8 and CEA are promising biomarkers for GC as part of multiple-marker panels.
 XML Download