

 PDF
PDF ePub
ePub Citation
 Print
Print


INTRODUCTION
The World Health Organization defines health as "a state of complete physical, mental, and social well-being," and not merely as the absence of illness or dysfunction.1 However, much of the psychiatric theory and research to date has not focused on the full range of the human experience from negative to positive. During the last few years the desire to "make life better" has also become a more common theme in the world. Subjective well-being or life satisfaction is one of these themes.
Subjective well-being or life satisfaction includes a cognitive appraisal of one's general state, and there are two approaches. One is built on the idea that there are basic and universal human needs and that people will be happy if one's circumstances allow a person to fulfill these needs. However, all the demographic factors such as income and education levels taken together account for only 10-15 percent of the life satisfaction variance.2-4 There has been similar research conducted in the East,5 but there were no findings about the detailed ratio between life satisfaction and well-being like there have been in Western studies. The other approach to subjective well-being assumes that life satisfaction is seen as the product of internal traits. Temperament and personality dimensions have been considered as powerful determinants of life satisfaction.6,7 In Korea, the effects of a particular personality variable such as extraversion on life satisfaction were focused, and the results were similar to those of international studies.8
Recently, several studies9,10 have proposed interpretative tendencies or "thinking styles" to be alternatives of personality traits. A particular thinking style may explain how individuals select and process information while interpreting life events, which may account for individual differences.11 Within these cognitive features, optimism has been a main focus of research.12,13 However some studies suggest that dispositional optimism, as defined by a generalized tendency to expect positive outcomes,14 pervades people's thinking about the future.15,16 Optimistic people seem to be saying that "The future will be great, especially for me," and this extreme optimism appears to be illusory. There is a fundamental limit in optimism in that it provides no substantial process that examines how people cope with adversity in their daily lives.7
In contrast, "positive thinking" is characterized by perceiving obstacles as challenges that can be overcome, and it prompts individuals to become more engaged in their environments.16 Some studies evaluating depressive moods have suggested that the degree of positive, automatic thoughts rather than of negative, automatic thoughts is the most important determinant of adaptive and maladaptive functioning.17 Also, in Korea, a group which met the criteria diagnostic of a major depressive episode reported less-positive, automatic thoughts.18 In relation to life satisfaction, however, "positive thinking" is not the absence of negative cognition that is related to a depressive mood. In other words, "positive thinking" alters the meaning of a negative event more positively and then actively produces personal growth.
Despite numerous research conducted on positive-thinking or life satisfaction,10,15 the previous results do not show empirical evidence that positive-thinking is significantly related to life satisfaction. Similarly, there was not a tool for Koreans to report and evaluate their positive-thinking before we developed a positive thinking scale.19
The primary goal of this study was to survey the positive thinking and life satisfaction among the average Korean population according to certain demographic conditions. Our second goal was to evaluate the effect of positive thinking on life satisfaction after controlling for demographic factors. In the present study, we hypothesized that positive thinking exerts its effect on life satisfaction when demographic information is controlled.
MATERIALS AND METHODS
The procedure of data collection
We used a cluster and quota sampling method which was stratified by the proportion of the population and their ages according to the 2004 Korean census.20 To cluster at multiple stages we classified our administrative divisions into three groups based on the number of the population from the ages of 20 to 59 who were living in each city or town. We then considered categories for the administrative districts: more than 600,000 people were designated as the "large" city group, a population from 100,000 people to 600,000 people was considered the "medium-sized" city group and a number of fewer than 100,000 people were called the "small" city group. A representative sample was obtained using a random dialing method, which allows for the random selection of a community sample.
When there was no answer in a household, the same phone number was dialed again up to three times at different times of the day and on different days of the week before being replaced by another number. Individuals who declined to participate in the survey upon first contact were called a second time before being eliminated from the study. Exclusion criteria included being less than 20 years of age or not speaking Korean well enough to complete the interview. The response rate was 25%, and 409 people completed interviews.
Telephone interviews were conducted by a research firm that specializes in telephone surveys. Approximately 12 trained interviewers who were all female administered the interview from a call center equipped with computerized telephone records. Each interviewer received a pilot test that was conducted with the help of three participants to improve the item wording and to provide appropriate feedback on the flow of the interview. The 409 total interviews were completed over a period of two weeks, and the average interview time was 20 min. After a description of the aims of the study only those who verbally consented to proceed with the interview participated.
Sample
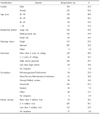
The general characteristics of the respondents are described in Table 1. The total sample size was 409, and 215 of these were women (52.6%), and 194 were men (47.4%) with an age range of 20-59 years. In addition, we designed other demographic variables so that they would have approximately equal proportions among the three groups.
Questionnaires
Life satisfaction was measured by simple questions which have been used in several previous studies 21,22 ("Taking all factors into consideration, how satisfied are you currently with your life?"). The response scale ranged from 1 (extremely dissatisfied) to 10 (completely satisfied). Following administration of this question, participants were asked to complete 18 items on the positive thinking questionnaire which we developed.19 The response scale ranged from 1 (strongly disagree) to 5 (strongly agree). This was composed using two factors: one is "personal satisfaction" (13 items) and the other is "goal pursuit" (five items). The result of internal consistency (∝ = 0.88) and test-retest reliability (r = 0.74, p < 0.01) showed that this scale was reliable and a valid measure of what was being tested. Furthermore the "positive thinking" scores were positively correlated with positive affect and life satisfaction, and they were negatively correlated with negative affect, depression and hopelessness. From these results we could conclude that the positive thinking scale was an assessment tool with convergent and discriminate validity.
Data analysis
Using SPSS 11.0, we conducted one-way analyses of variance (ANOVA) which consisted of the demographic characteristics of the sample on positive thinking and life satisfaction. A hierarchical linear regression further examined the relationship between positive thinking and life satisfaction after controlling for the demographic characteristics.
RESULTS
Positive thinking according to demographic variables
Demographics and personal information included gender, age, marital status, family income, education, occupation, and residential districts. Among these variables, respondents showed significant differences only in age, family income level, education, and occupation variables on positive thinking. The range of the scores was from 0-100.+
The sample was made up of approximately equal numbers of men (47.4%) and women (52.6%), and the overall mean score of positive thinking was 50.44 (SD = 28.09). The difference in mean levels of males (M = 48.24, SD = 28.98) and females (M = 52.43, SD = 27.18) was not significant. In addition, there were no significant differences between married participants (M = 51.28, SD = 27.49) and single participants (M = 50.21, SD = 29.03). Participants who lived in cities of different sizes also produced no significant differences regardless of whether they lived in a large city (M = 51.78, SD = 28.14), a medium-sized city (M = 48.33, SD = 27.64) or a small city (M = 50.60, SD = 29.32).
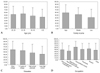
In contrast, there were significant differences in four demographic factors: age, family income, education, and occupation. As demonstrated in Fig. 1, along with a bonferroni post-hoc analysis of a one-way ANOVA, participants in their 30s (M = 54.99, SD = 25.95) had higher scores than those in their 50s (M = 43.02, SD = 28.25, F(3,405) = 3.34, p < 0.05). People with high-level incomes (M = 58.98, SD = 28.52) and those with middle-level incomes (M = 52.43, SD = 25.74) also had higher positive thinking scores more frequently than people with low-level incomes (M = 41.75, SD = 29.84, F(2,405) = 5.86, p < 0.01). In addition, 118 participants were holders of a university degree (M = 58.70, SD = 27.96), and they reported the highest scores (F(3,404) = 7.14, p < 0.001). Clerical/skilled workers (M = 60.74, SD = 28.72) showed higher scores than self-management/professionals (M = 48.37, SD = 27.19) and sales/service/manufacturers/craftsmen (M = 42.34, SD = 25.08, F(5,401) = 3.34, p < 0.01).
Life satisfaction according to demographic characteristics
On life satisfaction, the results showed similar tendencies. Among demographic variables, respondents showed significant differences only in age, family income level, education, and occupation variables on life satisfaction. The range of the scores is from 0-100, and the overall mean of 409 respondents was 48.63 (SD = 26.80).
The overall difference in mean levels of males (M = 45.82, SD = 26.91) and females (M = 51.17, SD = 26.51) was not significant. In addition, married (M = 48.36, SD = 26.15) and single participants (M = 52.09, SD = 27.18) showed no significant differences. Participants who lived in the different sizes of cities also produced no significant differences: in a large city (M = 51.96, SD = 26.86), in a medium-sized city (M = 43.95, SD = 26.19) and in a small city (M = 47.51, SD = 27.11).
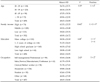
Table 2 indicates the significant differences in four demographic factors: age, family income, education, and occupation. Along with the bonferroni post-hoc analysis, respondents in their 20s had higher scores than those in their 50s, and respondents in their 30s also showed scores almost as high as those in their 20s. People with high-level incomes had the highest life satisfaction scores. In addition, holders of a university degree reported the highest scores, those who were students showed the highest scores among occupations, and clerical/skilled workers are also had high scores.
The effect of positive thinking on life satisfaction
To test the hypothesis that positive thinking is associated with life satisfaction independent of demographic variables, we conducted a hierarchical regression analysis. In combination, demographic variables and positive thinking explained 33% of the variance in life satisfaction scores. In addition, after controlling for the dummy-coded demographic variables which showed significant differences, we added the positive thinking variable, and this introduced a 17% variance in life satisfaction (R2 Change = 0.170, F = 88.56, p < 0.001). Table 3 shows that positive thinking exerts its effect independently of any demographic influences on life satisfaction.
DISCUSSION
The aim of the present study was to describe the relationship between positive thinking and life satisfaction with the demographic information provided from the general Korean population. Our results indicate that positive thinking and life satisfaction tend to be related, which suggests that positive thinking as a thinking style is a very powerful predictor to restoring life satisfaction.
Although positive thinking is the factor to explain the determinants of life satisfaction to a better extent, there has been little research looking at the relationship between the pattern of positive thinking and the participants' demographic information. Also, little research about the pattern of positive thinking and demographic variables, such as marital status and living conditions, has been conducted in Korea. Our present research shows that positive thinking and life satisfaction significantly differ in the groups with diverse demographic variables. For example, respondents in their twenties and thirties scored higher on positive thinking and life satisfaction scales than their older counterparts. This finding is inconsistent with the results of previous optimism studies that found that older people tend to be somewhat happier than younger people.23,24 People with college degrees or higher education attained the higher scores on the positive thinking and life satisfaction measures. Apparently, wealthier people tend to report greater positive thinking and satisfaction than those with lower incomes.
Nevertheless, our results show congruency with previous results only under conditions in which the demographic factors account for only 10-15 percent of life satisfaction.7 This is not a trivial amount of variance and it has only suggested that demographics alone do not distinguish happy people from unhappy people.14,24 In addition, people with higher scores on positive thinking scales also achieved higher scores on life satisfaction scales. In keeping with our hypothesis, controlling for demographic factors and taking into account the positive thinking factor produces significant changes in life satisfaction scores. In other words, positive thinking might contribute to the promotion of life satisfaction amongst the general Korean population.
Positive thinking as a type of cognitive activity is also consistent with the study on dysfunctional thinking styles which linked this type of attitude to greater unhappiness.25 In addition, positive thinking as a type of coping strategy has positive functions in the promotion of life satisfaction. Because of these studies, some researchers propose that positive thinking prompts people to keep a positive psychological attitude, and it may offer many excellent possibilities for happiness interventions.26,27
There are some limitations to our study. Although the present investigation attempts to document relationships of various demographic variables on the experience of positive thinking, the sample size is not sufficient. In addition, medical comorbidity or individual perception of health could also be an important factor that may have influenced our results. Furthermore, we have age constraints (from the ages of 20 to 59) on the participants in our study. The effects of physical deterioration, a critical factor to older people,28,29 on life satisfaction could not be explained. Therefore, future research calls for better studies compensating for the limits listed previously. In addition to better responses from participants, our life satisfaction and positive thinking questionnaires could have been more thorough. We could have included a social desirability measure. Even if our results had shown no positive distribution as was seen in previous studies, we could have included items evaluating the comparative norms. In addition, we can use other methods like behavior-based frames, and computer-based tasks are essential to reduce response biases.28,30 These measures can be distributed on a pre or sub-conscious level to specify the life satisfaction predictors along with life satisfaction interventions. Lastly, life satisfaction could be assessed using several different modalities. For instance, if the scale included both domain-specific life satisfaction (family, school, workplace, living community, etc.) and global life satisfaction questions, it might be helpful to capture a multi-component conception of life satisfaction. Additionally, although our study attempted to unravel complicated concepts related to positive thinking, this construct could be replicated through more structured and multi-item measures among more diverse participants in terms of culture, age, and life contexts to provide broader results.
Despite the limitations, the present study suggests the current status of positive thinking and life satisfaction in the general Korean population. The results also postulate that beyond objective life circumstances, positive thinking is a strong and consistent predictor of life satisfaction. These findings offer promise of positive thinking as an approach for psychological interventions designed to promote life satisfaction. In that perspective, our research opens up many opportunities for future research that explores the development of specific thought processes in life satisfaction.

 XML Download