

 PDF
PDF ePub
ePub Citation
 Print
Print


INTRODUCTION
Non-small cell lung cancer (NSCLC) is a major cause of cancer-related deaths, despite recent improvements in diagnostic and therapeutic strategies (1, 2). Thus, identification of factors for prediction of survival or response to treatment would be helpful. One possible factor may be the epidermal growth factor receptor (EGFR), a cell-surface receptor which modulates cellular proliferation and neoplastic growth by signal transduction (3). Accordingly, the prognostic significance of EGFR protein overexpression (EGFR-overexpression) has been studied for multiple tumor types. EGFR-overexpression in head and neck, ovarian, cervical, bladder and esophageal cancers is a strong negative prognostic factor (4). EGFR-overexpression determined by immunohistochemical staining was also associated with a poor prognosis in NSCLC (5, 6).
Thus, if we can find imaging biomarkers from routinely performed preoperative imaging studies in NSCLC, it would help in formulating a better clinical decision without additional studies. Herein, we attempted to identify CT and FDG-PET/CT features associated with EGFR protein overexpression in patients with surgical treated stage I NSCLC. We further evaluated the ability for the prediction of survival using EGFR protein overexpression, maximum standardized uptake value (SUVmax) on FDG-PET, tumor diameter and other imaging characteristics.
MATERIALS AND METHODS
This study was approved by the Institutional Review Board of Seoul National University Hospital. Informed consents for tissue collection and gene analyses for research purposes were obtained from individual patients preoperatively according to the policy of the Lung Cancer Tissue Bank of the Cancer Research.
Patients
From October 2005 to December 2007, a search of the electronic medical records at Seoul National University Hospital revealed that 308 patients had undergone surgical resection of stage I NSCLC. Among them, 214 patients had available immunohistochemical analysis data of EGFR expression and thus comprised our study population. There were 129 (60.3%) men and 85 (39.7%) women ranging in age from 24 to 83 years (mean, 63.2 years; median, 64 years). A radiologist collected the data regarding EGFR expression status. All tumors were pathologically diagnosed according to the seventh edition of tumor-node-metastasis (TNM) classification of malignant tumors for lung cancer by the International Association for the Study of Lung Cancer (7-9). Lobectomy was performed in 206 patients, pneumonectomy in 4, and wedge resection in 4. Radical mediastinal lymph node dissection was performed in all patients. Final pathologic stages were stage IA in 112 patients (52.3%); and stage IB in 102 (47.7%). The tumors were histologically characterized as adenocarcinoma in 145 (67.8%) patients, squamous cell carcinoma in 52 (24.3%), large cell carcinoma in 9 (4.2%), adenosquamous carcinoma in 2 (0.9%), carcinoid tumor in 3 (1.4%), pleomorphic carcinoma in 1 (0.5%), choriocarcinoma in 1 (0.5%), and myoepithelial carcinoma in 1 (0.5%). Adenocarcinoma was classified according to research by the International Association for the Study of Lung Cancer, American Thoracic Society, and European Respiratory Society (10).
Clinical Data
One radiologist verified and updated all survival data of the patients. The clinical end point of the study was survival time (from surgery to the date of death or the last follow-up date as the endpoint). Median follow up duration was 1323.5 days (48-1905 days). Follow-up information of all patients was obtained through clinical follow-up, phone call or through inquiry with a patient's primary care physician.
CT Imaging
All patients included in the study had available preoperative chest CT scans, which had been conducted within one month prior to surgery. We used one of the 5 MDCT machines. CT imaging was performed using one of five CT systems (LightSpeed Ultra, GE Medical Systems, Milwaukee, WI, USA; Sensation 16 and Somatom Definition, Siemens Medical Systems, Erlangen, Germany; Brilliance 64 and MX8000, Philips Medical Systems, Best, The Netherlands). In four patients who had part solid nodules, low dose chest CT without contrast enhancement was performed using the following scan parameters: detector collimation 1-5 mm, beam pitch 0.75-1.75; reconstruction thickness, 1-5 mm; reconstruction interval, 1-5 mm; tube voltage, 120 kVp; tube current 40 mA; and reconstruction kernel, a high frequency algorithm. The scanning parameters used for the rest of the study population for which contrast enhancement was performed were as follows: detector collimation, 5-8 mm; beam pitch, 0.75-1.75; reconstruction thickness, 5-8 mm; reconstruction interval, 5-8 mm; tube voltage, 120 kVp; tube current, 150-200 mA; and reconstruction kernel, a high frequency algorithm. In 33 patients with a lung mass that had ground glass opacity (GGO) portion, we performed thin section chest CT using a 1-3 mm reconstruction thickness.
CT Interpretation
Two thoracic radiologists interpreted the CT images. All differences were resolved by discussion until a consensus was reached. Both radiologists were aware that patients had surgically resected lung cancers, but were blinded to the pathologic report and EGFR protein expression status. Imaging characteristics of the primary lesions were recorded. These included the GGO proportions, cavitation, air-bronchogram, marginal spiculation, and marginal lobulation. GGO was defined as opacity such that none of its encompassed lung parenchyma was obscured. We did not regard blood vessels as solid components despite their solid appearance (11). As previously described (12), tumor GGO proportions were categorized into two groups, GGO ≤ 50% and 50% < GGO. Tumor diameters were recorded by averaging the tumor length and width reported on the pathology report. When multiple lung masses were present, the largest masses were recorded.
FDG-PET Imaging and Interpretation
Of the 214 patients, 167 underwent integrated FDG-PET/CT less than 1 month before surgery. All integrated FDG-PET/CT scans were performed within 1 month of the contrast-enhanced chest CT scan. The details of FDG-PET imaging have been previously described (12). 18F-FDG (5.2 MBq/kg of body weight) was administered intravenously 1 hour prior to imaging. Integrated FDG-PET/CT was performed using a Gemini PET/CT camera (Philips Medical Systems, Cleveland, OH, USA). Whole body positron emission tomography PET images were acquired using conventional three-dimensional protocol. Integrated FDG-PET/CT PET and CT images were then coregistered on hardware. Low-dose CT (without i.v. contrast) for attenuation correction and anatomic localization purposes was performed from head to pelvis using a tube voltage of 120 kV, 50 mA, a tube-rotation time of 0.75 seconds per rotation, a pitch of 1.5, and a slice thickness of 6.5 mm, which matched PET image section thicknesses. Immediately after CT, emission PET images were acquired 150 seconds per bed in the three dimensional acquisition mode.
Fluorodeoxyglucose-positron emission tomography data were analyzed using standardized uptake values (SUV) by a nuclear medicine physician who was blinded to the EGFR protein expression status. Trans-axial images were used for analysis. SUVs were calculated as decay-corrected activity (kBq) per milliliter of tissue volume per kBq of injected 18F-FDG activity per gram of body mass. SUVmax of lung masses were measured after placing a region of interest over all masses.
Evaluation of EGFR-Overexpression
Immunohistochemical studies for EGFR protein were conducted as previously described using commercially available reagents and well-established staining methods (13). EGFR expression was evaluated by immunohistochemistry using the mouse anti-human EGFR monoclonal antibody (clone 31G7) (Zymed Laboratories, San Francisco, CA, USA) with labeled streptavidin-a biotin complex staining method (LSAB kit, DAKO, Carpentaria, CA, USA). Antigen retrieval was achieved by proteinase K digestion for 10 min, and the primary antibody was applied at a dilution of 1 : 50.
The intensity score was defined as follows: 0 = no appreciable staining in the tumor cells, 1 = barely detectable staining in the cytoplasm and/or nucleus compared with the stromal elements, 2 = readily appreciable brown staining distinctly marking the tumor cell cytoplasm and/or nucleus, 3 = dark brown staining in tumor cells obscuring the cytoplasm and/or nucleus, or 4 = very strong staining of nucleus and/or cytoplasm. The score was based on the fraction of positive cells (0-100%). The total score was calculated by multiplying the intensity score and the fraction score producing a total range of 0-400. For statistical analyses, scores of 0-200 were considered negative/low expression, and scores of 201-400 were considered positive/high expression (13).
Statistical Analysis
Nominal variables were compared using the χ2 test or Fisher's exact test. Differences between continuous variables were compared using the Mann-Whitney test. Prior to comparing the average diameter and SUVmax values of tumors which overexpress EGFR protein and those which do not, optimal cut-off values were calculated using a receiver operating characteristics-based positive test with categorical variables of EGFR-overexpression. Tumor diameters and SUVmax values of tumors were dichotomized as ≤ optimal cut-off value and > optimal cut-off value.
To assess whether increasing SUVmax values were associated with EGFR protein overexpression (EGFR-overexpression), we performed a trend analysis using linear by linear association in a two-sided χ2 test. To identify independent factors that predict EGFR protein overexpression, multivariate logistic regression analysis was performed. For logistic regression analysis, a forward stepwise selection mode was used, with iterative entry of variables based on test score p values of < 0.05 and with removal of variables with a likelihood ratio probability of 0.10.
The strength of the association between the prognostic effect of the putative covariates and the disease-free survival time was evaluated with hazard ratios using univariate Cox proportional hazards models. Diameters and SUVmax values of tumors were dichotomized using a receiver operating characteristics-based positive test with categorical variables of tumor related death. A multivariate Cox proportional hazards regression model was used to examine simultaneously the effects on the overall survival of gender, age, and evaluated variables; gender and age was set as not excluded and stepwise selection was used for other variables. Stepwise selection was performed using the Akaike information criterion. SPSS statistical software version 17.0 (SPSS, Inc, an IBM Company, Chicago, IL, USA) or MedCalc version 8.2.1.0 was used for analyses. The multivariate Cox proportional-hazards model fitting was carried out in R (http://www.r-project.org, version 2.14.2). Null hypotheses of no difference were rejected if p values were less than 0.05, or, equivalently, if hazard or odds ratio (OR) 95% confidence limits excluded 1.
RESULTS
Fifty one patients (23.8%) overexpressed EGFR. EGFR overexpression was found in 22 of 145 adenocarcinomas (15.2%), 23 of 52 squamous cell carcinomas (44.2%), 2 of 9 large cell carcinomas (22.2%), 2 of 3 adenosquamous carcinomas (100%), 0 of 3 carcinoid tumors (0%), 0 of 1 pleomorphic carcinomas (0%), 1 of 1 choriocarcinoma (100%), and 1 of 1 myoepithelial carcinoma (100%).
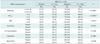
The median value of the average diameter of EGFR-overexpressing tumors and non-EGFR-overexpressing tumors was 2.53 ± 1.4 cm and 1.63 ± 1.16 cm (median ± quartile), respectively, and there was a statistical difference (p < 0.001) (Table 1). We dichotomized the tumors with a cut off value of an average diameter of 2.43 cm. Tumors with an average diameter > 2.43 cm were more frequently found among tumors with EGFR-overexpression than tumors without EGFR-overexpression (27/51, 52.9% vs. 35/163, 21.5%; p < 0.001) (Table 2).
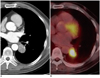
The Median SUVmax of tumors with EGFR-overexpression and tumors without EGFR-overexpression was 7.75 ± 5.25, 3.80 ± 4.70, respectively, and there was a statistical difference (p < 0.001) (Table 1, Fig. 1). We dichotomized the tumors with a cut off value of SUVmax 5.0. Tumors with an SUVmax > 5.0 were more frequently found among tumors with EGFR-overexpression than in tumors without EGFR-overexpression (31/42, 73.8% vs. 46/125, 36.8%; p < 0.001) (Table 2, Fig. 2). Then, we found a statistically significant trend between EGFR-overexpression and SUVmax. The higher the SUVmax of the tumor, the more EGFR-overexpression was found (p < 0.001). When SUVmax was smaller than 1.1, the proportion of tumors showing EFGR-overexpression was 0% (0 / 12); When SUVmax was 1.1 or larger than 1.1 and smaller than 3.0, the proportion was 9.5% (4/42); When SUVmax was 3.1 or larger than 3.1 and smaller than 5.0, the proportion was 19.4% (7/36); When SUVmax was 5.1 or larger than 5.1 and smaller than 7.0, the proportion was 29.2%; When SUVmax was 7.1 or larger than 7.1, the proportion was 45.3%.
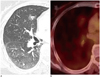
Tumors with a GGO proportion > 50% were less frequent among tumors with EGFR-overexpression than tumors without EGFR-overexpression (2/51, 3.9% vs. 31/163, 19.0%; p = 0.007) (Table 2). The presence of cavitation, air-bronchogram, marginal lobulation, and marginal spiculation showed neither a statistical difference nor a trend between tumors according to EGFR-overexpression (Table 2).
Multivariate logistic regression analysis showed that an SUVmax of > 5.0 on FDG-PET (OR, 3.113; 95% confidence interval [CI], 1.375-7.049; p = 0.006) and average tumor diameter > 2.43 cm (OR, 2.799; 95% CI, 1.285-6.095; p = 0.010) significantly and independently predicted EGFR-overexpression of tumors.
We dichotomized the tumors with a cut off value of SUVmax 4.0 and of average diameter 1.93 cm for survival analysis. On the univariate analysis, EGFR-overexpression (hazard radio, 2.643; 95% CI, 1.199-5.827; p = 0.016), average diameter > 1.93 cm (hazard radio, 3.978; 95% CI, 1.588-9.963; p = 0.003), SUVmax > 4.0 (hazard ratio, 18.378; 95% CI, 2.464-137.079; p = 0.005), cavitation (hazard ratio, 2.639; 95% CI, 1.102-6.320; p = 0.029), and air-bronchogram (hazard ratio, 0.277; 95% CI, 0.095-0.808; p = 0.019) were predictors of shorter survival. GGO proportion > 50%, marginal lobulation, and marginal spiculation were not predictive of survival. Multivariate analysis used the following variables: gender, age, EGFR-overexpression, SUVmax > 4.0, EGFR-overexpression, average diameter > 1.93 cm, cavitation, air-bronchogram. Multivariate analysis showed that SUVmax > 4.0 (hazard ratio, 10.660; 95% CI, 1.370-82.966; p = 0.024), and cavitation (hazard ratio, 3.122; 95% CI, 1.143-8.532; p = 0.026) were independent predictors of shorter survival.
DISCUSSION
The present study consists of two main parts. In the first part, we evaluated the relationship between EGFR overexpression and various features including CT characteristics, average tumor diameter, and SUVmax on FDG-PET/CT. Subsequently, we showed that EGFR overexpression was associated with tumors > 2.43 cm in diameter, SUVmax > 5.0, and GGO proportion ≤ 50%, and that CT characteristics including cavitation, air-bronchogram, marginal lobulation, and marginal spiculation did not show a significant association with EGFR overexpression. On multivariate regression analysis, an SUVmax of > 5.0 on FDG-PET and an average diameter > 2.43 cm were found to significantly and independently predict EGFR overexpression. In the second part, we evaluated the survival for various features including EGFR overexpression, CT characteristics, and SUVmax on FDG-PET/CT; and we found that SUVmax > 4.0 and cavitation were independent prognostic indicators in multivariate analysis.
In this study, we found that tumor diameter was associated with EGFR-overexpression and was a predictor of poor prognosis for stage I NSCLC on univariate analysis. The pathologic stage of the disease is the most important prognostic factor in malignant tumors. Our result which showed shorter survival time for tumor diameters > 1.93 cm in stage I NSCLC (tumor diameter < 5 cm) supports and verifies the efficacy of subclassifying T1 as T1a (≤ 2 cm) or T1b (> 2 cm to ≤ 3 cm) in the seventh TNM classification of lung cancer (7, 14, 15). The cut off value in our study for stage I NSCLC (< 5 cm) was 1.93 cm, and not 2 cm as in the seventh TNM. However, we believe that a cut off value of less than 3 cm is useful. Yano et al. (16) also showed that the differences of 5-year postoperative survival among new T categories were statistically significant in any pathologic node (any pN) status and in pN0 status except for T2a and T2b in pN0 status. In their study, the difference of T1a and T1b in 5-year postoperative survival was significant in any pN status and pN0 status.
For the measurement of the size of the lung cancer, we used the results on the pathology report. We assumed that the size discrepancy of a GGO nodule between CT and pathology would be greater than the discrepancy of solid nodules, and we had 33/220 (15%) patients who had a GGO proportion greater than 50%. Current methods of measuring nodule volume with the use of bi-dimensional and three-dimensional CT do not reflect the real soft tissue volume of nodules with GGO (17). Recently, a collection of 2-year follow-up data from the screened population of the NELSON trial (lung-cancer screening trials) used only the volume of the solid region in the case of partially solid lesions (18). However, there are no standard methods for the measurement of the diameter of the volume of nodules with GGOs.
High SUVmax in FDG-PET is a poor prognostic factor in NSCLC (19, 20). On the other hand, Taylor et al. (21) showed that high SUVmax in FDG-PET correlates with EGFR-overexpression. Similarly, our study shows that high SUVmax is significantly associated with EGFR-overexpression and poor prognosis. It is not surprising that the study for the next phase (8th) of TNM staging system will prospectively analyze additional components more than TNM, including the impact of histologic type, surgical resection status, clinical factors, such as pulmonary function tests, and radiologic factors, such as SUVmax (22).
There have been several reports regarding the relationship between molecular biomarkers related to EGFR and imaging features. Yano et al. (23) reported that tumors with a GGO ratio ≥ 50% and a diameter ≤ 3 cm often show EGFR mutation in peripheral pulmonary adenocarcinoma. Furthermore, Park et al. (12) reported that low EGFR gene copy number status determined by fluorescence in situ hybridization was found more often in tumors with a GGO > 50% and diameter < 15.5 mm in their study of 132 patients with adenocarcinoma of the lung. In our study, we found that tumors with a GGO proportion > 50% and diameter ≤ 2.43 cm was frequent among tumors without EGFR-overexpression, and this has not been reported in the literature. For the other imaging features, Onn et al. (24) evaluated the relationships among imaging findings, prognosis and EGFR overexpression and showed that cavitary lesions in tumors on CT were likely to overexpress EGFR, whereas, in our study, the presence of a cavity was not related with EGFR overexpression. This may be because in their study the percentage of the tumor by cell type was 40% squamous cell carcinoma, 32% adenocarcinoma, and 18% bronchioloalveolar carcinoma; whereas in our study, adenocarcinoma accounted for 67.8% and squamous cell carcinoma 24.3%. In addition, EGFR-overexpression is more common in squamous cell carcinoma as shown in our study and other studies (25, 26). Therefore, it is likely that as the higher proportion of squamous cell carcinomas affected this difference (24).
Moreover, there have been other reports regarding imaging features and prognosis in NSCLC. Suzuki et al. (27) radiologically classified peripherally located adenocarcinomas less than 2 cm in diameter and showed that nodal metastasis was related to greater than 50% GGO proportion. Furthermore, Takashima et al. (28) evaluated CT findings in 64 peripheral adenocarcinomas 20 mm or less in diameter in 64 patients and showed that GGO areas measured on CT was an independent prognostic factor for survival. Vazquez et al. (29) evaluated 338 patients with a diagnosis of adenocarcinoma 30 mm or less in length in a low-dose CT screening program and showed that the proportion of a bronchioloalveolar carcinoma component within adenocarcinomas represented a positive prognostic factor and correlated with the proportion of GGOs at CT. In our study, GGO proportion did not differ significantly. This may be because our study included stage I NSCLC in which tumor diameter reached 7 cm, whereas Suzuki et al. (27) and Takashima et al. (28) includes tumors less than 2 cm, and Vazquez et al. (29) less than 3 cm, and that bronchioloalveolar carcinoma component is more frequently found in smaller tumors (29). The comparatively short follow up duration is another factor of our result. Vazquez et al. (29) evaluated 10-year survival; however our median follow up was 3.6 years. In addition, we had smaller number of patients.
In addition, we found that presence of cavity on CT was associated with poor prognosis. Similarly, Onn et al. evaluated stage I NSCLC showed that cavitary lesions were significantly associated with shorter disease-free survival and shorter overall survival time. Radiologic cavitation is present about 10% to 20% of all lung carcinomas, which is believed to be due to tumor necrosis as a consequence of ischemia and/or bronchial obstruction (30). Most cavitating lung cancers are of squamous cell carcinoma (82%) (31). In a study of squamous cell lung carcinoma that underwent radical surgery, cavitation was poor prognostic factor (32). However, Pentheroudakis et al. (33) found no definite evidence of inferior survival of cavitating squamous cell carcinoma than that of solid squamous cell carcinoma in the lung.
The strength of our study is that it compares preoperative imaging features with EGFR protein expression status in resected stage I NSCLC tissue samples. Moreover, our findings indicated that preoperative imaging features were related to tumor biological characteristics. Nevertheless, this study has limitations that should be considered. First, its retrospective nature may have introduced selection bias. Second, postoperative follow-up periods were relatively short.
In conclusion, EGFR-overexpression status was significantly associated with higher SUVmax on FDG-PET, larger diameter, and smaller GGO proportion of stage I NSCLC; in multivariate analysis, higher SUVmax and larger diameter were independent predictor. Shorter survival was observed in tumors with EGFR-overexpression, higher SUVmax, larger diameter, cavitation, or absence of air-bronchogram; in multivariate analysis, higher SUVmax and cavitation were independent predictors of shorter survival.

 XML Download