Abstract
Purpose:
To evaluate the usefulness of cone beam computed tomography (CT)-based parenchymal blood volume (PBV) mapping for the detection of marginal recurrence or residual hepatocellular carcinoma, after transcatheter arterial chemoembolization (TACE), and to compare it with multiphase dynamic CT (MDCT).
Materials and Methods:
From March 2015 to October 2016, 26 patients with 49 iodized nodules who underwent TACE and a pre-interventional MDCT scan were enrolled in our study. We evaluated the diagnostic efficacies of PBV mapping using cone beam CT and MDCT in the detection of marginal recurrences or viable tumors.
Results:
The sensitivity, specificity, positive predictive value, and negative predictive value (NPV) of PBV mapping and MDCT were 100%, 96.7%, 94.7%, and 100%, and 77.9%, 93.5%, 87.5%, and 87.8%, respectively. The overall sensitivity for identifying local marginal recurrence was higher for PBV mapping than for MDCT (p < 0.005). The performances of PBV mapping and MDCT in the diagnosis of local marginal recurrence were significantly different (p = 0.037, McNemar test).
Conclusion:
Compared with MDCT, PBV mapping can significantly increase the detection of marginal recurrence or residual tumor after TACE because it is free of beam-hardening artifact. PBV mapping should be considered as a feasible modality-related tool for patients who have undergone chemoembolization.
REFERENCES
1.Vogl TJ., Schaefer P., Lehnert T., Nour-Eldin NE., Ackermann H., Mbalisike E, et al. Intraprocedural blood volume measurement using C-arm CT as a predictor for treatment response of malignant liver tumours undergoing repetitive transarterial chemoembolization (TACE). Eur Radiol. 2016. 26:755–763.

2.Yu JS. Hepatocellular carcinoma after transcatheter arterial chemoembolization: difficulties on imaging follow-up. Korean J Radiol. 2005. 6:134–135.

3.Kim SH., Lee WJ., Lim HK., Lim JH. Prediction of viable tumor in hepatocellular carcinoma treated with transcatheter arterial chemoembolization: usefulness of attenuation value measurement at quadruple-phase helical computed tomography. J Comput Assist Tomogr. 2007. 31:198–203.
4.Choi SJ., Kim J., Seo J., Kim HS., Lee JM., Park H. Parametric response mapping of dynamic CT for predicting intrahepatic recurrence of hepatocellular carcinoma after conventional transcatheter arterial chemoembolization. Eur Radiol. 2016. 26:225–234.

5.Choi SH., Chung JW., Kim HC., Baek JH., Park CM., Jun S, et al. The role of perfusion CT as a follow-up modality after transcatheter arterial chemoembolization: an experimental study in a rabbit model. Invest Radiol. 2010. 45:427–436.
6.Lee JK., Chung YH., Song BC., Shin JW., Choi WB., Yang SH, et al. Recurrences of hepatocellular carcinoma following initial remission by transcatheter arterial chemoembolization. J Gastroenterol Hepatol. 2002. 17:52–58.
7.Kubota K., Hisa N., Nishikawa T., Fujiwara Y., Murata Y., Itoh S, et al. Evaluation of hepatocellular carcinoma after treatment with transcatheter arterial chemoembolization: comparison of Lipiodol-CT, power Doppler sonography, and dynamic MRI. Abdom Imaging. 2001. 26:184–190.

8.Choi JW., Kim HC., Lee JH., Yu SJ., Cho EJ., Kim MU, et al. Cone beam CT-guided chemoembolization of probable hepatocellular carcinomas smaller than 1 cm in patients at high risk of hepatocellular carcinoma. J Vasc Interv Radiol. 2017. 28:795–803. .e1.

9.Hunt SJ., Yu W., Weintraub J., Prince MR., Kothary N. Radiologic monitoring of hepatocellular carcinoma tumor viability after transhepatic arterial chemoembolization: estimating the accuracy of contrast-enhanced cross-sectional imaging with histopathologic correlation. J Vasc Interv Radiol. 2009. 20:30–38.

10.Kim HC. Role of C-arm cone-beam CT in chemoembolization for hepatocellular carcinoma. Korean J Radiol. 2015. 16:114–124.

11.Lee IJ., Chung JW., Yin YH., Kim HC., Kim YI., Jae HJ, et al. Conebeam CT hepatic arteriography in chemoembolization for hepatocellular carcinoma: angiographic image quality and its determining factors. J Vasc Interv Radiol. 2014. 25:1369–1379. quiz 79-e1.

12.Ahmed AS., Zellerhoff M., Strother CM., Pulfer KA., Redel T., Deuerling-Zheng Y, et al. C-arm CT measurement of cerebral blood volume: an experimental study in canines. AJNR Am J Neuroradiol. 2009. 30:917–922.

13.Kaufmann S., Horger T., Oelker A., Kloth C., Nikolaou K., Schulze M, et al. Characterization of hepatocellular carcinoma (HCC) lesions using a novel CT-based volume perfusion (VPCT) technique. Eur J Radiol. 2015. 84:1029–1035.

14.Bayraktutan Ü., Kantarci A., Og˘ul H., Kizrak Y., Özyig Ö., Yücel-er Z, et al. Evaluation of hepatocellular carcinoma with computed tomography perfusion imaging. Turk J Med Sci. 2014. 44:193–196.

15.Sahani DV., Holalkere NS., Mueller PR., Zhu AX. Advanced hepatocellular carcinoma: CT perfusion of liver and tumor tissue—initial experience. Radiology. 2007. 243:736–743.
16.Petralia G., Fazio N., Bonello L., D'Andrea G., Radice D., Bellomi M. Perfusion computed tomography in patients with hepatocellular carcinoma treated with thalidomide: initial experience. J Comput Assist Tomogr. 2011. 35:195–201.
17.Jiang T., Kambadakone A., Kulkarni NM., Zhu AX., Sahani DV. Monitoring response to antiangiogenic treatment and predicting outcomes in advanced hepatocellular carcinoma using image biomarkers, CT perfusion, tumor density, and tumor size (RECIST). Invest Radiol. 2012. 47:11–17.

18.Zhuang ZG., Zhang XB., Han JF., Beilner J., Deuerling-Zheng Y., Chi JC, et al. Hepatic blood volume imaging with the use of flat-detector CT perfusion in the angiography suite: comparison with results of conventional multislice CT perfusion. J Vasc Interv Radiol. 2014. 25:739–746.

19.Pung L., Ahmad M., Mueller K., Rosenberg J., Stave C., Hwang GL, et al. The role of cone-beam CT in transcatheter arterial chemoembolization for hepatocellular carcinoma: a systematic review and meta-analysis. J Vasc Interv Radiol. 2017. 28:334–341.

20.Lucatelli P., Argirò R., Ginanni Corradini S., Saba L., Cirelli C., Fanelli F, et al. Comparison of image quality and diagnostic performance of cone-beam CT during drug-eluting embolic transarterial chemoembolization and multidetector CT in the detection of hepatocellular carcinoma. J Vasc Interv Radiol. 2017. 28:978–986.

Fig. 1
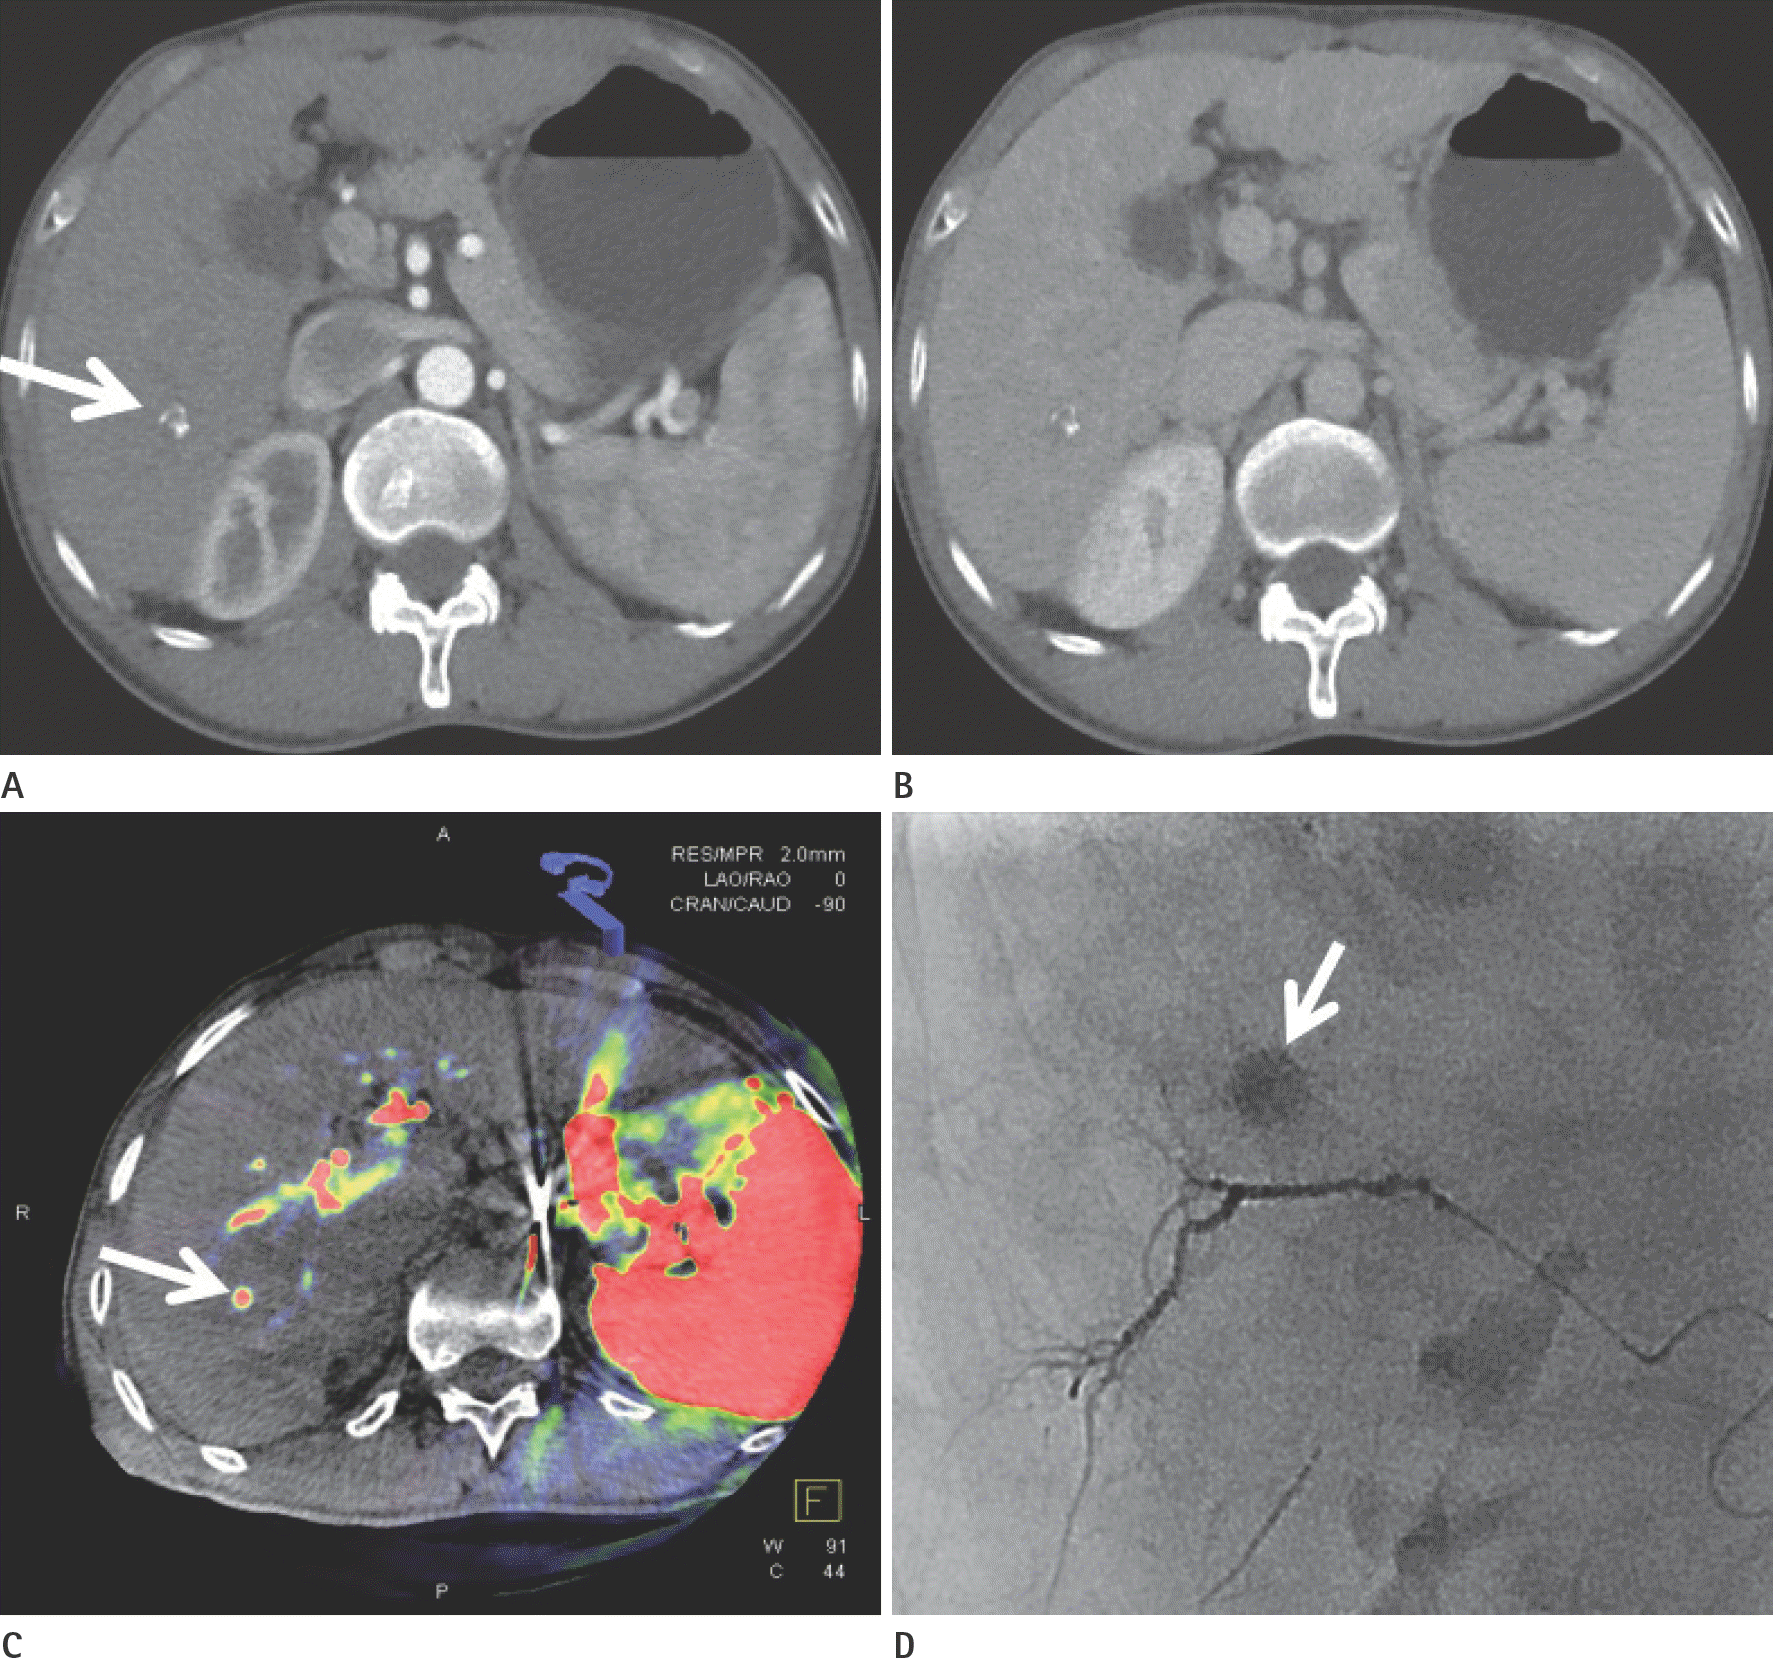
A 71-year-old male patient who had undergone a single transarterialchemoembolization treatment. A. Axial image of the arterial-phase CT scan show a tiny defect at the margin of the iodized oil-containing nodule at S8 of the liver, although no significant enhancing portion was seen. B. Axial images of the delay-phase CT scan show a tiny defect at the margin of the iodized oil-containing nodule at S8 of the liver, although no significant wash-out portion was seen. C. Parenchymal blood volume mapping using cone beam CT shows increased blood flow (arrow). D. Selective arteriogram demonstrating an enhancing residual marginal tumor (arrow). CT = computed tomography

Fig. 2
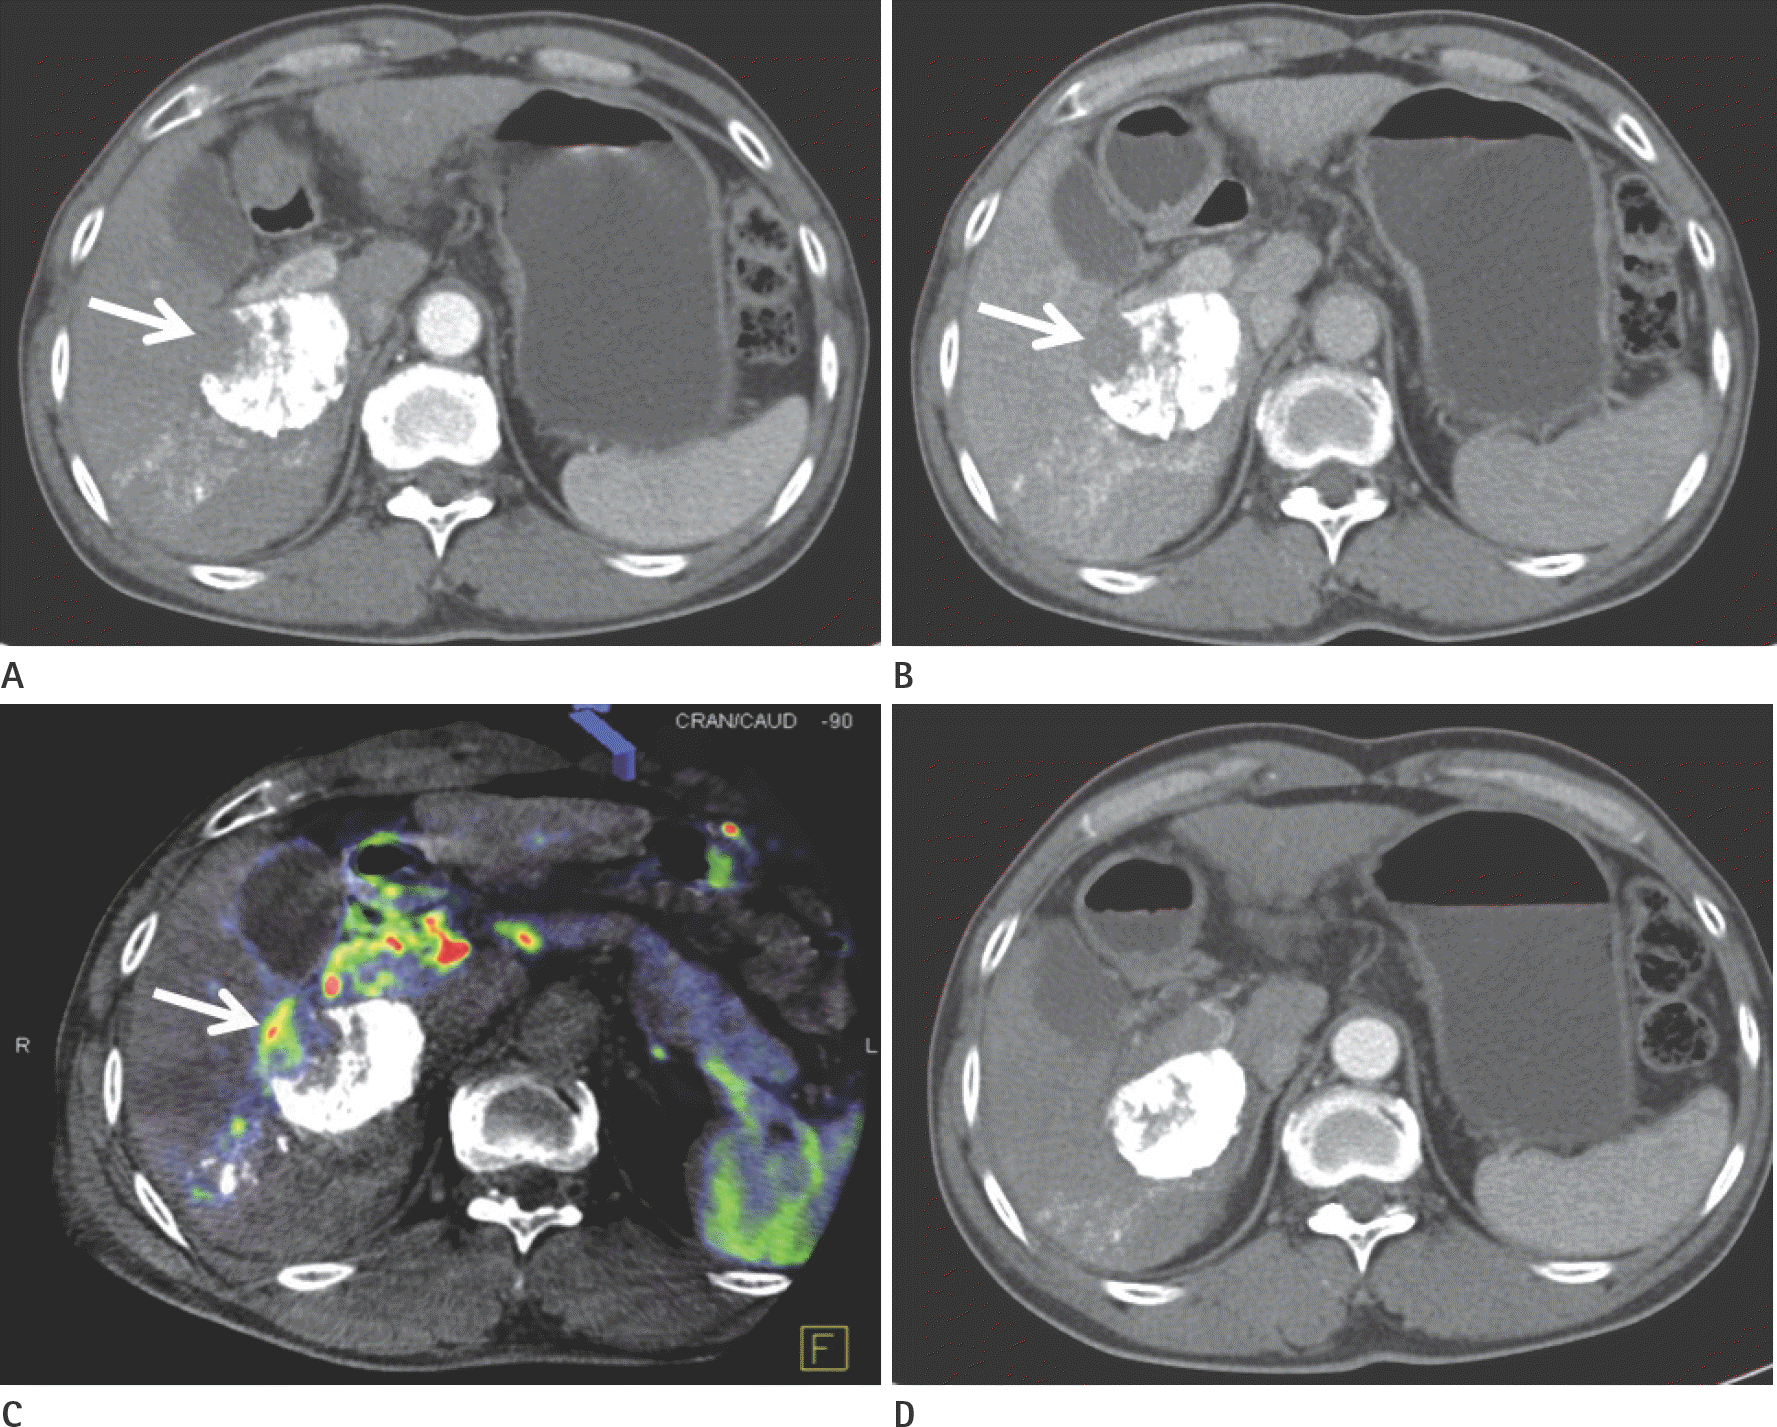
A 54-year-old male patient who had undergone a single transarterial chemoembolization treatment. A. Axial images of the arterial-phase CT scan show defect within the iodized nodule at S6 of the liver, but no definite enhancing viable tumor focus was visible (arrow). B. Axial images of the delay-phase CT scan show defect within the iodized nodule at S6 of the liver, but no definite wash-out portion is seen. C. Parenchymal blood volume mapping using cone beam CT shows an area of increased blood flow (arrow). D. After selective chemoembolization to a branch of the S6 artery, the viable tumor is confirmed by uptake of dense iodized oil (arrow). CT = computed tomography

Fig. 3
A 48-year-old male patient who had undergone a single transarterial chemoembolization treatment. A, B. Axial images of the arterial and delayed phase CT scan images show large defects within the iodized nodule, but no definite enhancing viable tumor focus is visible (arrows). C. Parenchymal blood volume mapping using cone beam CT shows an area of increased blood flow (arrow). D. After transarterial chemoembolization, the follow up CT shows lipiodol uptake at a previously defective area that was confirmed as viable tumor. CT = computed tomography

Fig. 4
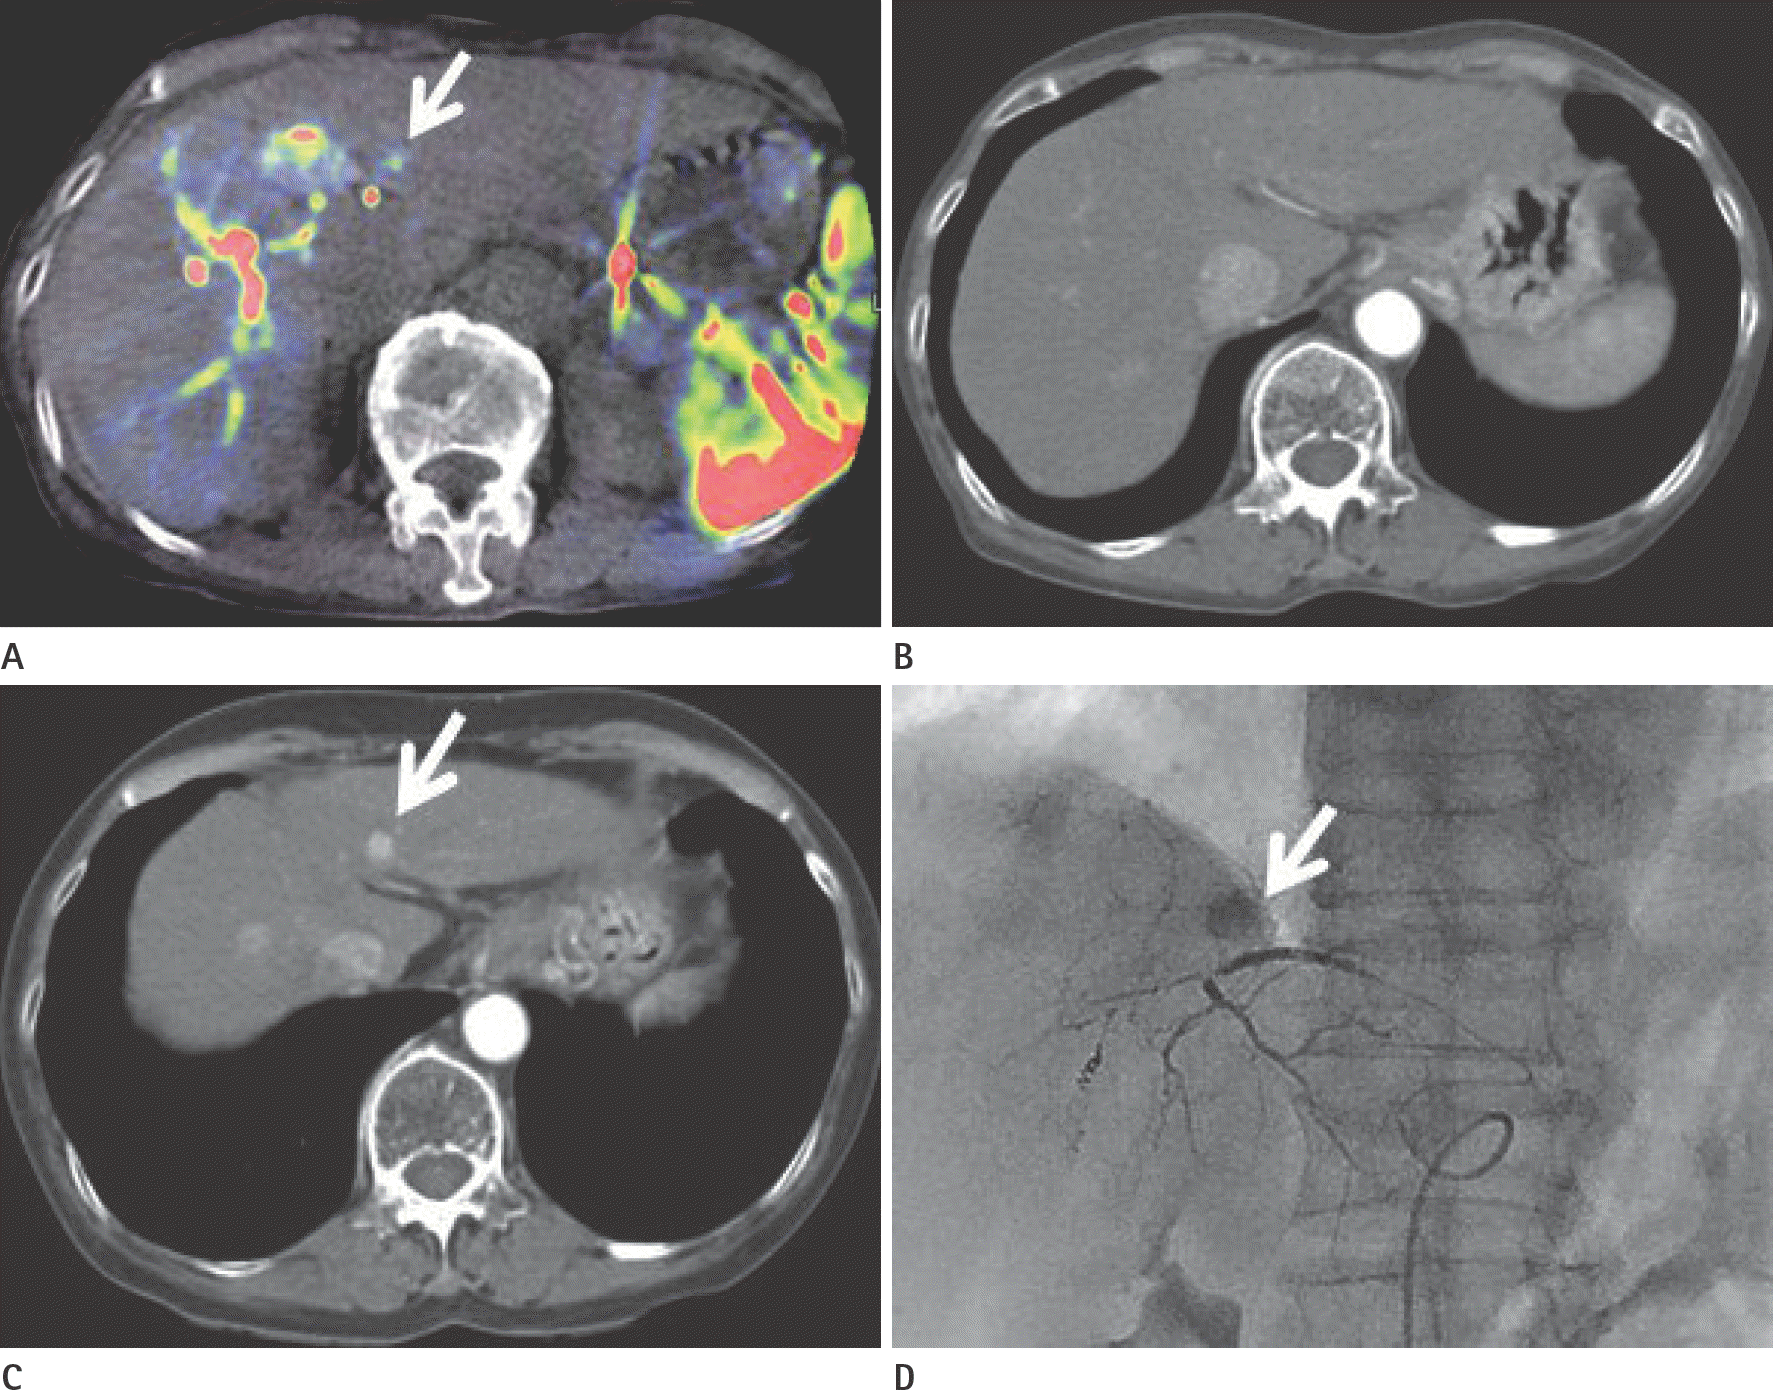
A 65-year-old female patient who had undergone fourth transarterial chemoembolization treatment. A. Parenchymal blood volume mapping using cone beam CT shows an area of increased blood flow (arrow). B. Axial images of the arterial phase CT scan image show no arterial enhancement. C. 6 months later, arterial phase CT scan image show arterial enhancement (arrow). D. After selective chemoembolization to a branch of the S3 artery, the viable tumor is confirmed by uptake of dense iodized oil (arrow). CT = computed tomography

Table 1.
Baseline Characteristics of the Patients with Hepatocellular Carcinomas


 PDF
PDF ePub
ePub Citation
 Print
Print


 XML Download