

 PDF
PDF ePub
ePub Citation
 Print
Print


INTRODUCTION
Type 2 diabetes is a chronic disease that has a major impact on public health and is a major cause of morbidity and mortality. However, the etiology of type 2 diabetes is not wholly understood, because type 2 diabetes is a complex disease that is influenced by many risk factors (1, 2). Fasting glucose (FG) level is an important type 2 diabetes related trait. A chronically elevated FG level reflects a damaged glucose metabolism and is a crucial risk marker for type 2 diabetes (3).
Furthermore, the heritability of FG level has been reported to be in 17%-51% in the general population (4). Therefore, knowledge of genetic susceptibility for FG level would improve our understanding of the risks of an impaired FG level and of type 2 diabetes.
Linkage and association analyses are the methods generally used to map genes that confer to susceptibility to complex diseases, such as, type 2 diabetes (5). Linkage analysis is performed on the joint distributions of trait and marker alleles in family members to determine whether a major gene associated with a familial trait is linked to a well-defined marker. Conversely, association analysis is useful for verifying susceptibility genes, in which the distributions of alleles at polymorphic markers are compared. Association studies are valuable for localizing regions of interest identified by linkage analysis. Recently, many researchers have performed linkage and association studies for complex disease using high throughput screening tools, and single-nucleotide polymorphism (SNP) arrays provide one of the most powerful high throughput screening approaches to genome-wide studies (6).
Adding twins can enrich a family study. Dizygotic (DZ) twins are valuable to gene mapping studies as ideal sib-pairs (7). Although monozygotic (MZ) twins do not contribute to gene mapping per se, the presence of them provides more precise discrimination between polygenic and shared environmental variance, which can potentially increase power of family-based regression methods (8).
Aiming at identifying novel or known genetic variations concerning FG level, we analyzed associations between genetic polymorphisms and FG level using a genome-wide SNP array chip in this study. In addition, we explored the trait of FG level in a healthy, family cohort containing MZ twins using a combined linkage/family-based association analysis approach.
MATERIALS AND METHODS
Population and data collection
In the present study, we used the Korean Healthy Twin study cohort data obtained from the Center for Genome Science at the Korean National Institute of Health. The aim of the Korean Healthy Twin cohort study was to explore genetic variation related to complex traits and to study the effects of environment on the etiologies of complex diseases, in adult same-sex twin pairs aged 30-yr or older and their first-degree family members regardless of family size. Participants were recruited by placing advertisements in daily newspaper and by using a poster campaign in about 300 hospitals and governmental agencies. The study design used in the Korean Healthy Twin study cohort has been previously described in detail (9). Of the 2,124 subjects in the cohort, we investigated 1,754 individuals, which included 432 families and 219 pairs of MZ twins (female and male pairs) after excluding individuals without an FG level. Participants in the Healthy Twin Study that signed a consent form before enrollment were interviewed by trained interviewers at each institution, and general epidemiological and clinical data were recorded. Subject weights and heights were also recorded, and blood samples were taken using standard protocols. Plasma glucose was assayed using a hexokinase enzymatic method.
Genotyping analysis
Genotyped data were obtained from the Center for Genome Science in the Korean Centers for Disease Control and Prevention. Sixteen short tandem repeat markers (15 autosomal short tandem repeat markers plus one sex-determining marker) were used to confirm sample identities for the twins (AmpFlSTR Identifier Kit; PerkinElmer, Norwalk, CT, USA). Only if at least 15 of the 16 markers corresponded in each twin pair, was the pair considered MZ (9). Microarray-based SNP genotyping was performed using the genome-wide human SNP array 6.0 chip (Affymetrix, Santa Clara, CA, USA). All genomic DNA samples were normalized to a concentration of 50 ng/µL. The Affymetrix standard protocol was followed. Genomic DNA was digested using restriction enzymes such as Nsp I and Sty I and amplified by PCR. We labeled the amplified genomic DNA using Streptavin, fragmented it to be 50-200 bp, and hybridized it in the chip. Scanning was performed using a high-resolution Affymetrix GeneChip scanner 3000 7G. Image files were used to transfer the data into GCOS 1.4 for subsequent processing using G-TYPE 4.0 software. Using V3 annotation for the genome-wide human SNP array 6.0 chip, a total of 906,600 SNPs and 946,000 copy number probes were genotyped per sample. Genotype calls were generated by a proprietary Birdseed 2.0 algorithm. Genotyped SNPs with a call rate of less than 95% were dropped. Monomorphic SNPs, SNPs with a minor allele frequency of < 0.01, or SNPs out of Hardy-Weinberg Equilibrium (P < 0.001) were filtered out. Finally, 520,484 SNPs were subjected to further analyses.
Statistical analysis
We examined the relationships between FG levels and covariates, such as, age, sex, and body mass index (BMI), using Spearman correlation coefficient test or Wilcoxon rank sum test (Mann-Whitney U test). Statistical analysis was performed using SAS version 9.1 (SAS Institute, Cary, NC, USA). Familial correlations of FG level between possible pairs in the pedigree and heritability of FG level were obtained using S.A.G.E. software, version 6.0.1 (http://darwin.cwru.edu/).
Combined genome-wide linkage analysis with peak wise association tests was performed to identify genetic markers of FG level. During the genome-wide linkage scan, multivariate regression-based quantitative trait loci (QTL) analysis of the number of alleles identical by descent (IBD) at a given marker was performed on the squared sum and squared difference of FG level after adjusting for confounders, such as, age, sex, and BMI (10). For adjusted FG level, we used regression residuals of log(FGmi) on age, sex, and BMI in family members i (i = 1, 2, ...) within the mth family. We considered S = [Sij = (Xi + Xj)2] and D = [Dij = (Xi + Xj)2] as predictor variables, and Π = [( )] for the estimated proportion of alleles IBD (i≠j) as dependent variables in the multivariate regression model. MERLIN-REGRESS software (8) was used for extended regression based QTL analysis. For this analysis, we controlled overestimated genetic variance in the model caused by MZ twins sharing identical genotypes within pairs.
)] for the estimated proportion of alleles IBD (i≠j) as dependent variables in the multivariate regression model. MERLIN-REGRESS software (8) was used for extended regression based QTL analysis. For this analysis, we controlled overestimated genetic variance in the model caused by MZ twins sharing identical genotypes within pairs.We next performed association studies for SNPs in linkage regions using a LOD score ≥ 1.3 in the genome-wide linkage analysis. We considered the T statistic of 2.45, which corresponds to a LOD score of 1.3, since 4.6 × LOD score is distributed as a 50-50 mixture of χ2 with 1 df and a point mass at 0 under the null hypotheses of no linkage. We used two different association analysis approaches, that is, the family-based association test (FBAT) in all families and population-based tests of association in founders of each family, after adjusting for age, sex, and BMI to identify specific genetic loci associated with the risk of an increased FG level. Using FBAT, we merged each MZ twin's pair as one subject by averaging traits, such as, BMI and FG level, of each MZ twin pair to adjust for possible overestimation of genetic variance in the model. FBAT under the additive model was used to allow both variations in a quantitative trait log(FG) and in covariates into a general score test of association in 1,535 subjects using FBAT software, version 2.0.3 (http://www.biostat.harvard.edu/~fbat/).
Population-based association tests under various modes of inheritance, including additive, dominant and recessive models, and regression analyses of the log(FG) on interactive effects of significant SNPs were performed in 467 unrelated founders of each family using PLINK software, version 1.07 (http://pngu.mgh.harvard.edu/purcell/plink/). Of the additive, dominant, and recessive models for each SNP-trait association, we selected the best genetic model based on Akaike's information criterion (AIC). To combine two independent P values derived by FBAT and association analysis, we used Fisher's method for combining P values (11).
RESULTS
Distribution of subject characteristics
Table 1 shows the distribution of subject characteristics for all families and founders of each family. Founders tended to be older and had a higher FG level than all families. Comparisons of FG levels in unrelated population of founders showed they were different by sex (P = 0.028 by Wilcoxon's rank sum test), and significantly correlated with age and BMI (r = 0.132, P = 0.004 for age and r = 0.156, P < 0.001 for BMI by Spearman correlation coefficient analysis). The proportions of study population with a history of type 2 diabetes were 5.3% for all families and 12.6% for founders.
Familial correlations of FG level between two random variables within nuclear family are shown in Table 2. Correlation estimate between MZ twins was moderately significant with r = 0.528 (SE = 0.049, P < 0.001), and was higher than that between pairs of full siblings (r = 0.257, SE = 0.034). No large differences were found between correlation estimates for all family members and families without one twin member in each pair of MZ twins. Heritability estimates for FG level were h2 = 0.27 (SE = 0.07, P < 0.001) and adjusted h2 = 0.47 (SE = 0.06, P < 0.001) (adjusting for age, sex and BMI). Without one member of twins in each pair of MZ twins, we obtained heritability estimates for FG level of h2 = 0.31 (SE = 0.07, P < 0.001) and adjusted h2 = 0.49 (SE = 0.06, P < 0.001) (adjusted for age, sex, and BMI).
Genome-wide linkage analysis
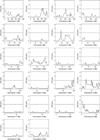
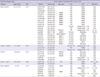
Initially, we performed an autosomal genome-wide linkage study for log(FG), after adjusting for age, sex, and BMI, using multivariate regression-based QTL analysis (10). We detected overall 7 peak regions in chromosomes 2, 3, 7, 15, 16, and 20 with significant evidence of linkage with FG level by genome-wide linkage analysis (Fig. 1). Top linkage peaks with LODs of >2 in each region were located in chromosome 2q31.1 (172.1 Mb), 3q13.11 (105.2 Mb), 7p13 (43.5 Mb), 15q26.3 (98.3 Mb), 16p12.1 (22.8 Mb), 16q12.1 (48.8 Mb), and 20p13 (3.0 Mb), as shown in Table 3. Subsequently, we focused on SNPs in the 6 linkage regions of chromosomes 2q23.3-2q31.1, 3q13.11-3q13.13, 15q26.1-15q26.3, 16p12.1, 16q12.1-16q13, and 20p13-20p12.2 with relatively wide regions showing linkage (except for 7p13 in which only a small region showed linkage). Among these regions, we were able to find several well-known markers with significant evidence of linkage or association with FG level or risk of diabetes in the following regions of chromosomes 2q23.3-2q31.1, 15q26.1-15q26.3, 16p12.1, 16q12.1-16q13, and 20p13-20p12.2 (Table 4).
Association analyses for SNPs in the linkage peaks
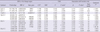
We then performed two different association studies on SNP sites with an LOD score ≥1.3 within the significant linkage regions described above. Using FBAT in all families, we identified 3 significant SNPs within 6 linkage regions associated with FG level after adjusting for age, sex, and BMI (P < 0.001, Table 5). We also performed population-based association analyses in founders only for each SNP with respect to FG level after adjusting for age, sex, and BMI for the various modes of inheritance. We confirmed 9 significant SNP sites using the best genetic model for each SNP within 6 linkage regions (P < 0.001, Table 5). By combining the two different P values obtained by FBAT and association analysis, we were able to identify 4 significant SNPs, namely, rs16853036 located in the XIRP2 gene (xin actin-binding repeat containing 2 in chromosome 2q24.3), rs6497610 (in chromosome 16p12.1), rs6132978 in the VPS16 gene (vacuolar protein sorting 16 homolog in the chromosome 20p13), and rs6132978 in the PTPRA gene (protein tyrosine phosphatase, receptor type, A in the chromosome 20p13) that were significantly associated with FG level with a combined P < 0.001 (Table 5). In particular, rs6138953 located in the PTPRA gene was found to be highly associated with FG level (combined P = 1.8×10⁻⁶) under the recessive model.
DISCUSSION
FG level is a typical complex trait related to type 2 diabetes that is affected by multiple genes. FG level does not follow any mode of Mendelian inheritance and its phenotype is widely variable. In this study, we used two ways to map genes that confer susceptibility to an elevated FG level, that is, genome-wide linkage and association analyses. Initially, we performed genome-wide linkage scan analysis using the Affymetrix SNP 6.0 chip with the objective of identifying those markers which are linked to major genes for FG level in all family members. We then used two different types of association analyses to identify susceptibility genes with the FG level and to localize linkage regions of concern in genes identified by genome-wide linkage scan analysis.
We found multiple regions with evidence of linkage that were associated with the risk of an elevated FG level in our healthy twin-family cohort. Based on our combined genome-wide linkage and association analyses, we were able to confirm several regions that have evidence of linkage with FG level and type 2 diabetes in different populations. In particular, regions of chromosomes 2q23.3-2q31.1, 15q26.1-15q26.3, 16p12.1, and 20p13-20p12.2 were consistently found to show evidence of linkage with FG level in different populations (Table 4). Meigs et al. (12) found that chromosome 2q24.3 (rs1882347) have evidence of linkage (maxLOD=2.2) with FG level in the Framingham Heart Study cohort. Furthermore, a region of D2S2345 located in 2q24.3 showed evidence of linkage with an LOD=3.0 in French Europids in studies by Busfield et al. (13) and Huang et al. (5). However, chromosome 15q26.2 region showed relatively weak evidence of linkage with glucose level (LOD=1.3) in Amish families (14). Chromosome 16p12.1 also showed weak evidence of linkage with type 2 diabetes (LOD <2.0) in Finnish families (15) and French Europids (16). The 20p13-20p12.2 region, which showed evidence of linkage and association with FG level in the present study, has been previously reported to show evidence of linkage (16-18) and association (18-20) with type 2 diabetes in different populations. Furthermore, D20S905 region (located in 20p12.3) showed peak evidence of linkage with type 2 diabetes with an LOD >3 in the FUSION (non-insulin-dependent diabetes mellitus genetics) study in Finnish families (17, 18).
The findings of this study were mostly novel, however, of the identified genes (Table 5), PTPRA and PRKCB1 are likely to have direct/indirect impacts on insulin signaling and FG levels. The rs6138953 SNP in the intron region of PTPRA, located in 20p13, was found to be significantly associated with FG level under the recessive model in the present study. The protein encoded by the PTPRA gene is protein tyrosine phosphatase receptor type A (PTPRA), which is a member of the protein tyrosine phosphatase (PTP) family. PTPRA may play a role as a negative regulator of insulin signaling, and has been shown to dephosphorylate the insulin receptor, inhibit insulin-mediated effects, and modify insulin secretion in vitro (21). The expression of PTPRA is up-regulated in the skeletal muscles of obese humans (22), but unlike protein tyrosine phosphatase-1B (PTP1B) or leukocyte antigen related (LAR), there is insufficient evidence to prove its importance in insulin signaling. The present finding may support the suggestion that PTPRA participates in the pathogenesis of impaired glucose homeostasis in humans due to altered insulin signaling. In addition to its association with insulin signaling, PTPRA has been actively studied in relation to cancer. Protein tyrosine phosphorylation, which is controlled by protein tyrosine kinase (PTKs) and PTPs, play an important role in various cellular events, such as, cell growth, differentiation, and oncogenesis (23), and the oncogenic function of various PTPs (PTPN11, PTPRH, PTPRF, and other) have been well demonstrated (24). However, concerning PTPRA, the function in human tumor biology has not been clearly verified, because in vitro (25) and clinical research (26) results in various cancers (colon, breast, gastric cancer, and other) are inconsistent. Therefore, further studies on the potential oncogenic role of PTPRA needed to be implemented.
The mutant types of rs11640219 and rs9923820, which are located in the intron region of the PRKCB1 gene (in 16p12.1), showed weak associations with FG level elevation according to the recessive model in the founder population in the present study. The protein encoded by PRKCB1 is protein kinase C (PKC) β (β1 and β2), which has been reported to be involved in glucose homeostasis and to play an important role in the pathogenesis of diabetic complications (27). Furthermore, the overexpressions of PKC β1 and β2 was found to inhibit the tyrosine kinase activity of the insulin receptor in vitro (28), and PKC β knockout mice showed mildly improved glucose homeostasis and increased glucose transport in muscle and adipose tissue (29). In another study, PKC β2 overexpression was found to induce c-myc expression and to suppress insulin gene transcription in rat pancreatic islets (30). On the other hand, PKC β2 was required to ensure adequate insulin-dependent glucose uptake in rat skeletal muscle (31). In another study by (32) a functional PKC β promoter polymorphism at position-546, which reduced promoter activity, was found to be associated with insulin resistance in human subjects.
This study has several strengths. First, our data included various familial relationships in a Korean twin-family cohort, which enable us to identify evidence of genetic signals more accurately. Second, to the best of our knowledge, this is the first study to report linkages and associations of polymorphisms in chromosomes 16p12.1 and 20p13-20p12.2 with respect to FG level elevation. Concerning the 16p12.1 and 20p13-20p12.2 regions, little linkage and association analyses has been performed with respect to fasting glucose, insulin, and insulin resistance, because most research has been focused on type 2 diabetes and its complications. However, we found that the PTPRA and PRKCB1 genes among 11 selected genes (Table 5) are involved in glucose metabolism and insulin secretion directly or indirectly, and thus, may affect FG levels.
However, this study is limited by a lack of extensive fine-mapping and reliable replications of FG levels in individuals. Unclear biological understanding stayed behind for the other significantly detected polymorphisms, and thus, further studies are required on these polymorphisms. This study also has a limited power to identify well-known genetic variants involved in FG level, due to small sample size. Also, the absence of information on specific diabetic medications for the subjects who had diabetes is a limitation of our study.
In addition, meta-analyses of linkage regions and more extensive fine-mapping experiments that more broadly probe regions believed to contain additional markers associated with FG levels are needed in our future studies. Furthermore, replication studies are needed to explore the association between confirmed susceptibility loci and environmental factors of the trait.
Summarizing, we found multiple regions that showed evidence of linkage and an association with FG level in our Korean twin-family cohort. This study identifies that chromosomes 2q23.3-2q31.1, 15q26.1-15q26.3, 16p12.1, and 20p13-20p12.2 show evidence of linkage with FG level. In particular, SNP (rs6138953) on PTPRA in the 20p13 region is associated with FG level, and the PRKCB1 gene (in 16p12.1) is possibly associated with FG level. These findings contribute to our understanding of the pathogenesis of type 2 diabetes in the Korean population. The combined approach of genome-wide linkage and family-based association analysis is useful to identify novel or known genetic regions concerning FG level in a family cohort study.


 XML Download