Abstract
Rhynchophylline (RP) is a major tetracyclic oxindole alkaloid of Uncariae Ramulus et Uncus which has been used to treat hypertension, seizures, pain and anxiety in the oriental countries. A recent report revealed that RP attenuated ischemia-induced neuronal damage and kainite-induced convulsions in animals. This study was performed to investigate whether RP enhances pentobarbital-induced sleep behaviors and modulates sleep architecture in mice. Locomotor activity was significantly inhibited by RP at 0.25 and 0.5 mg/kg, similar to 2 mg/ kg diazepam (a benzodiazepine agonist) in mice. RP shortened sleep latency and increased total sleep time in a dose-dependent manner when administrated with pentobarbital (42 mg/kg, i.p.). RP also increased the number of sleeping mice and total sleep time by concomitant administration with the sub-hypnotic dosage of pentobarbital (28mg/kg, i.p.). On the other hand, RP (0.25mg/kg, p.o.) itself significantly inhibited sleep-wake cycles, prolonged total sleep time, and rapid eye movement in rats. In addition, RP also increased chloride influx in the primary cultured hypothalamic neuronal cells. In addition, we found that glutamic acid decarboxylase (GAD65/67) was activated by RP. In conclusion, RP augments pentobarbital-induced sleeping behaviors, and can be a candidate for treating insomnia.
References
(1). Kim C. S.., Han J. Y.., Kim S. h.., Hong J. T.., Oh K.W.; Biomolecules & Therapeutics,. 2011. 19:274–281.
(3). Sieghart W.Pharmaco. Rev. 1995. 47:181–234.
(4). Seifi M.., Brown J. F.., Mills J.., Bhandari P.., Belelli D.., Lambert J. J.., Rudolph U.., Swinny J. D. J.Neurosci. 2014. 34:10361–10378.
(5). Wang W.., Xu T. L.Neurosci. Lett. 2006. 406:11–16.
(6). Abourashed E. A.., Koetter U.., Brattström A.Phytomedicine. 2004. 11:633–638.
(7). Zhang W. B.., Chen C. X.., Sim S. M.., Kwan C. Y.Naunyn Schmiedebergs Arch. Pharmacol. 2004. 369:232–238.
(8). Kang T. H.., Murakami Y.., Takayama H.., Kitajima M.., Aimi N.., Watanabe H.., Matsumoto K.Life Sci. 2004. 76:331–343.
(9). Yuan D.., Ma B.., Yang J. Y.., Xie Y. Y.., Wang L.., Zhang L.., Kano Y.., Wu C.F.; Int. Immunopharmacol. 2009. 9:1549–1554.
(10). Kang T. H.., Murakami Y.., Matsumoto K.., Takayama H.., Kitajima M.., Aimi N.., Watanabe H.., Eur J.Pharmacol. 2002. 455:27–34.
(11). Morton G. J.., Kaiyala K. J.., Fisher J. D.., Ogimoto K.., Schwartz M. W.., Wisse B. E.Am. J. Physiol. Endocrinol. Metab. 2011. 300:E392–E401.
(12). Zhenzhen H.., Kim C. S.., Oh E. H.., Lee M. K.., Eun J. S.., Hong J. T.., Oh K. W.Nat. Prod. Sci. 2012. 18:67–75.
(13). Wolfman C.., Viola H.., Marder M.., Wasowski C.., Ardenghi P.., Izquierdo I.., Paladini A. C.., Medina J. H.Eur. J. Pharmacol. 1996. 318:23–30.
(14). Paxinos G.., Watson C.., Pennisi M.., Topple A. J.Neurosci. Methods. 1985. 13:139–143.
(15). Sanford L. D.., Yang L.., Liu X.., Tang X.Brain Res. 2006. 1084:80–88.
(16). Tokunaga S.., Takeda Y.., Niimoto T.., Nishida N.., Kubo T.., Ohno T.., Matsuura Y.., Kawahara Y.., Shinomiya K.., Kamei C.Biol. Pharm. Bull. 2007. 30:363–366.
(17). Ma Y.., Eun J. S.., Lee K. S.., Lee E. S.., Kim C. S.., Hwang B. Y.., Oh K. W.Nat. Prod. Sci. 2009. 15:213–221.
(18). Ma Y.., Han H.., Eun J. S.., Kim H. C.., Hong J. T.., Oh K. W.Biol. Pharm. Bull. 2007. 30:1748–1753.
(19). West M. R.., Molloy C. R.Anal. Biochem. 1996. 241:51–58.
(20). Wagner C.., Vargas A. P.., Roos D. H.., Morel A. F.., Farina M.., Nogueira C. W.., Aschner M.., Rocha J. B.Arch. Toxicol. 2010. 84:89–97.
(21). Han S.., Niu W.., Li H.., Hu L.., Yuan Y.., Xu G.Talanta. 2010. 81:44–47.
(22). Shi J. S.., Yu J. X.., Chen X. P.., Xu R. X.Acta Pharmacol. Sin. 2003. 24:97–101.
(23). Zhou J.., Zhou S. J.Ethnopharmacol. 2010. 132:15–27.
(24). Trachsel L.., Tobler I.., Achermann P.., Borbély A. A.Physiol. Behav. 1991. 49:575–580.
(25). Gottesmann C.Neurosci. Biobehav. Rev. 1996. 20:367–387.
(26). Datta S.., Hobson J. A.Behav. Neurosci. 2000. 114:1239–1244.
(27). Siegel J. M.Nature. 2005. 437:1264–1271.
(28). Erlander M. G.., Tobin A. J.Neurochem. Res. 1991. 16:215–226.
(29). Esclapez M.., Tillakaratne N. J.., Kaufman D. L.., Tobin A. J.., Houser C. R. J.Neurosci. 1994. 14:1834–1855.
(30). Rudolph U.., Mohler H.Curr. Opin. Pharmacol. 2006. 6:18–23.
Fig. 2.
Effects of RP on locomotor activity test. Ambulation activity was measured for 1 h, 30 min after oral administration of diazepam and 1 h after administration of RP. Each column shows the mean ± SEM. The significance of the compound's effects was assessed using ANOVA. Where there was significant variability, the individual values were compared using Student's t-test. ∗∗∗P < 0.005 compared with the control.
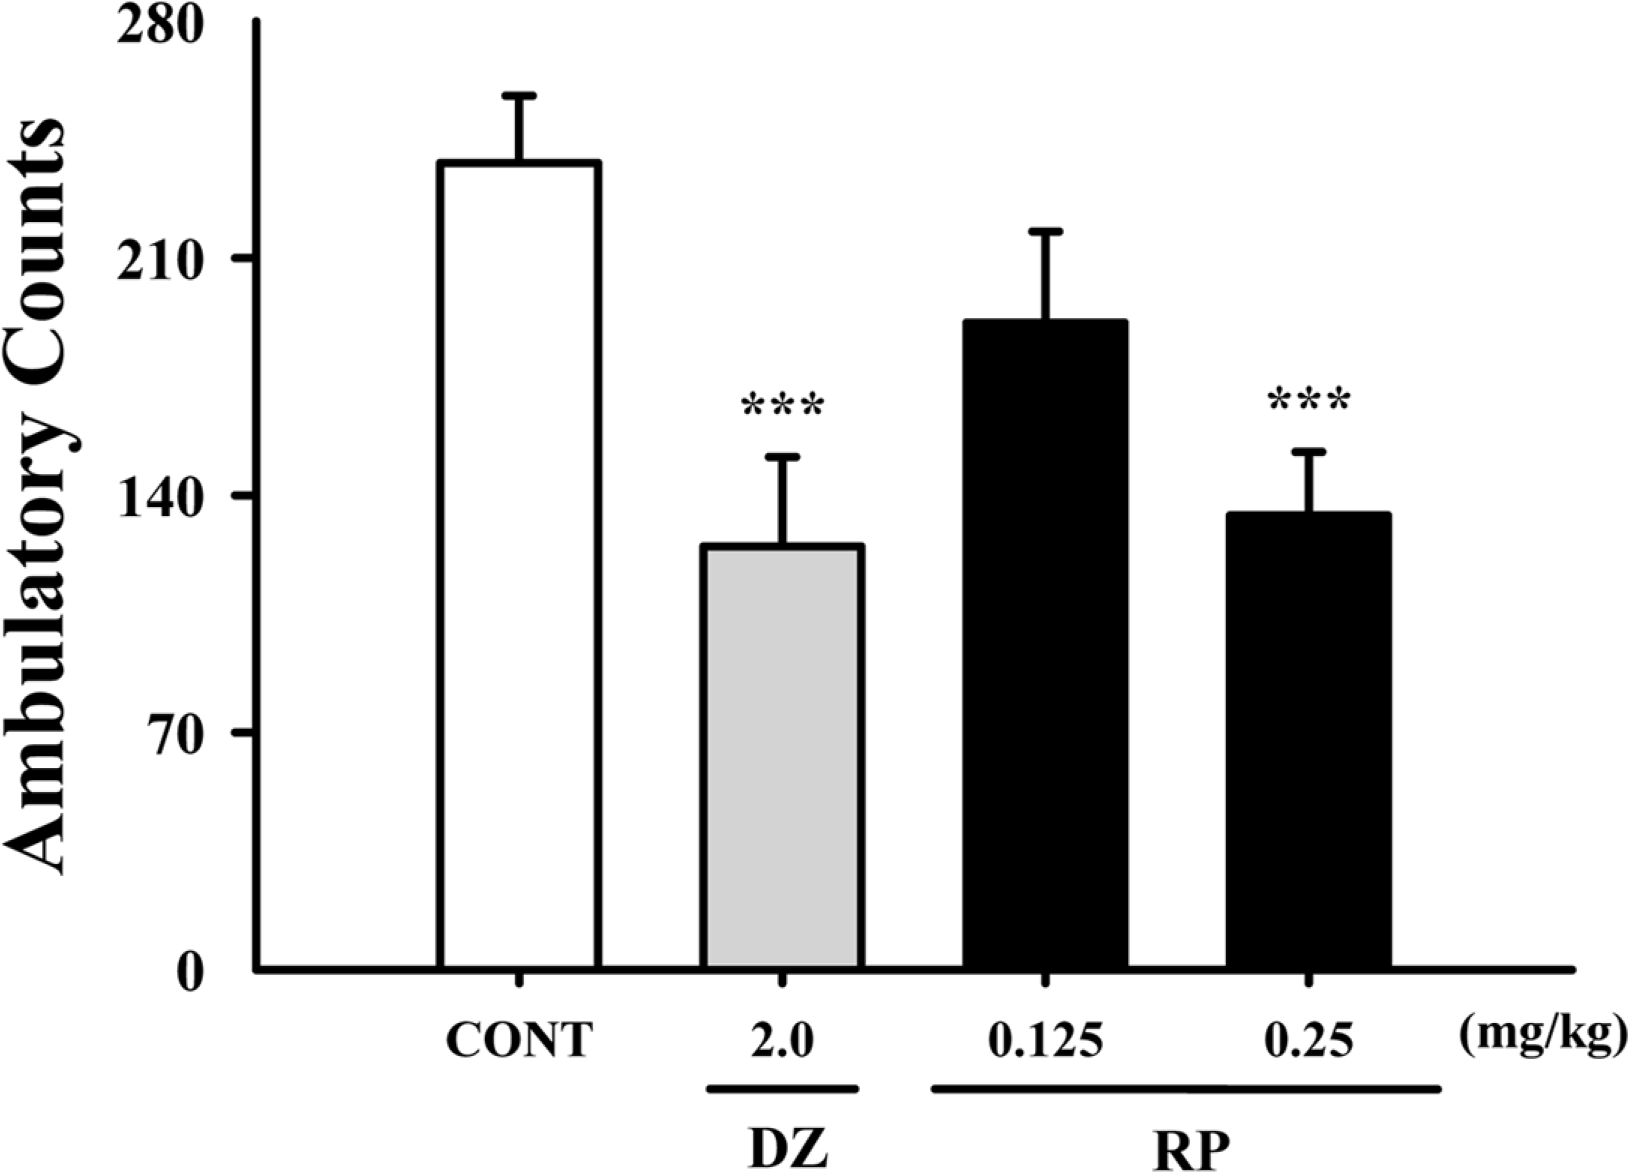
Fig. 3.
Effects of RP on sleep onset and duration in pentobarbital-treated mice. Mice were deprived of sleep for 24 h prior to the experiment. Pentobarbital (42 mg/kg, i.p.) was administered to mice following administration of muscimol or RP, and sleep latency (A) and sleep time (B) were measured. Each column shows the mean ± SEM. The significance of the compounds' effects was assessed using ANOVA. Where there was significant variability, the individual values were compared using Student's t-test. ∗∗P < 0.01, ∗∗∗P < 0.005 compared with the control.
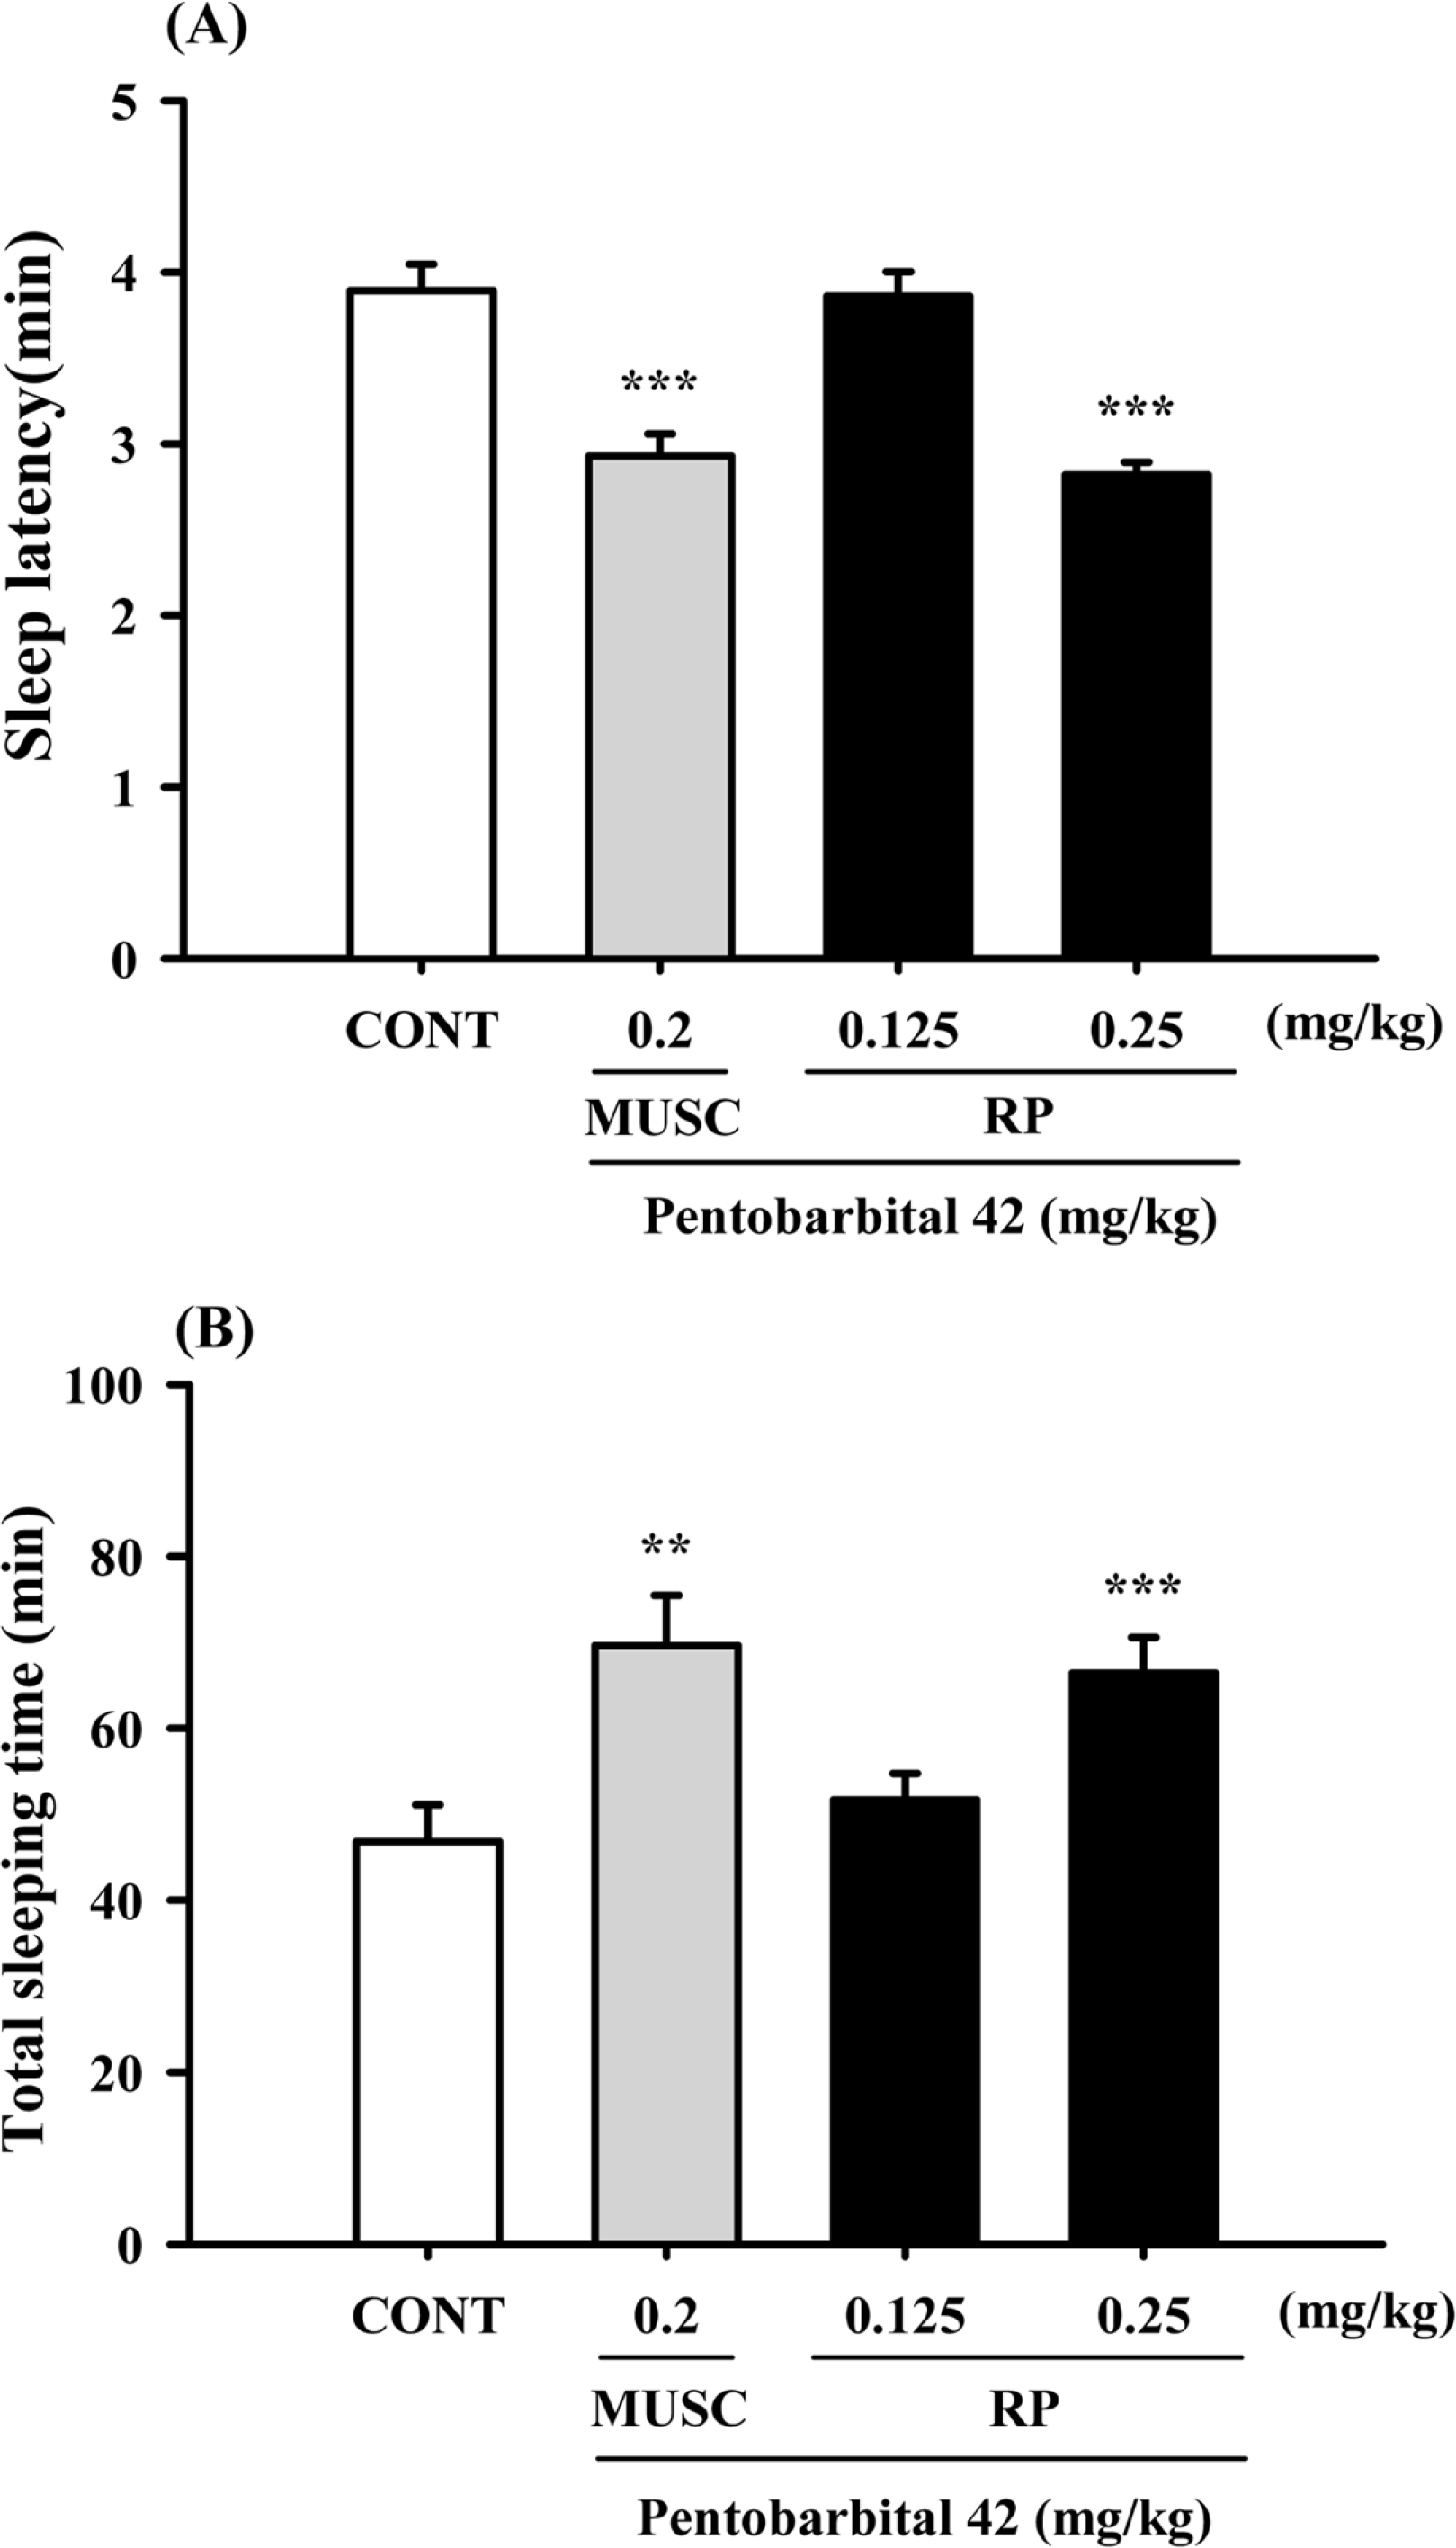
Fig. 4.
Effects of RP on numbers of sleep-wake cycles. Where there was significant variability, the individual values were compared using Student's t-test. ∗∗∗P < 0.005 compared with the control.
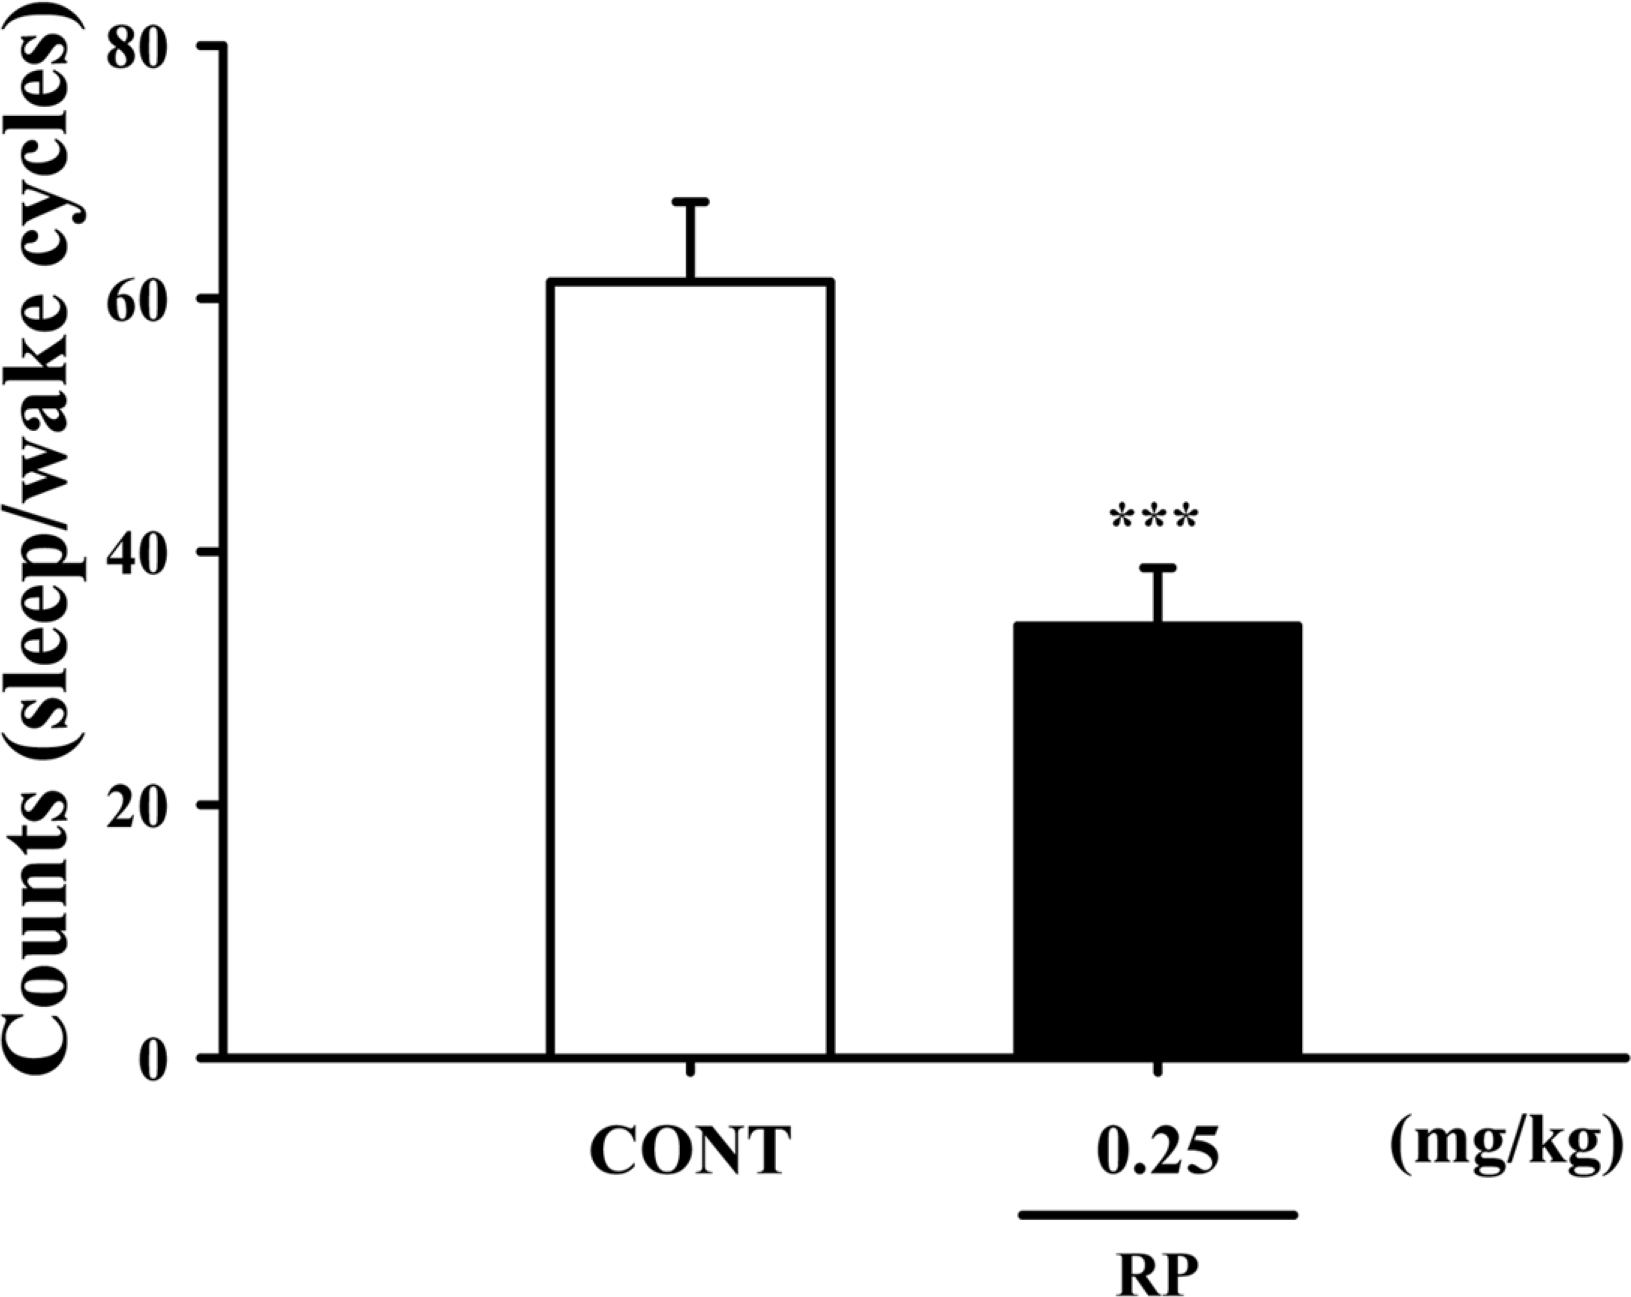
Fig. 5.
Effects of RP on rat sleep architecture. The data show the mean ± SEM of time spent, which separated the wakefulness and sleep (NREM and REM) states. The significance of the compounds' effects was assessed using ANOVA. Where there was significant variability, the individual values were compared using Student's t-test. ∗P < 0.05, ∗∗P < 0.01 compared with that of the naïve control.
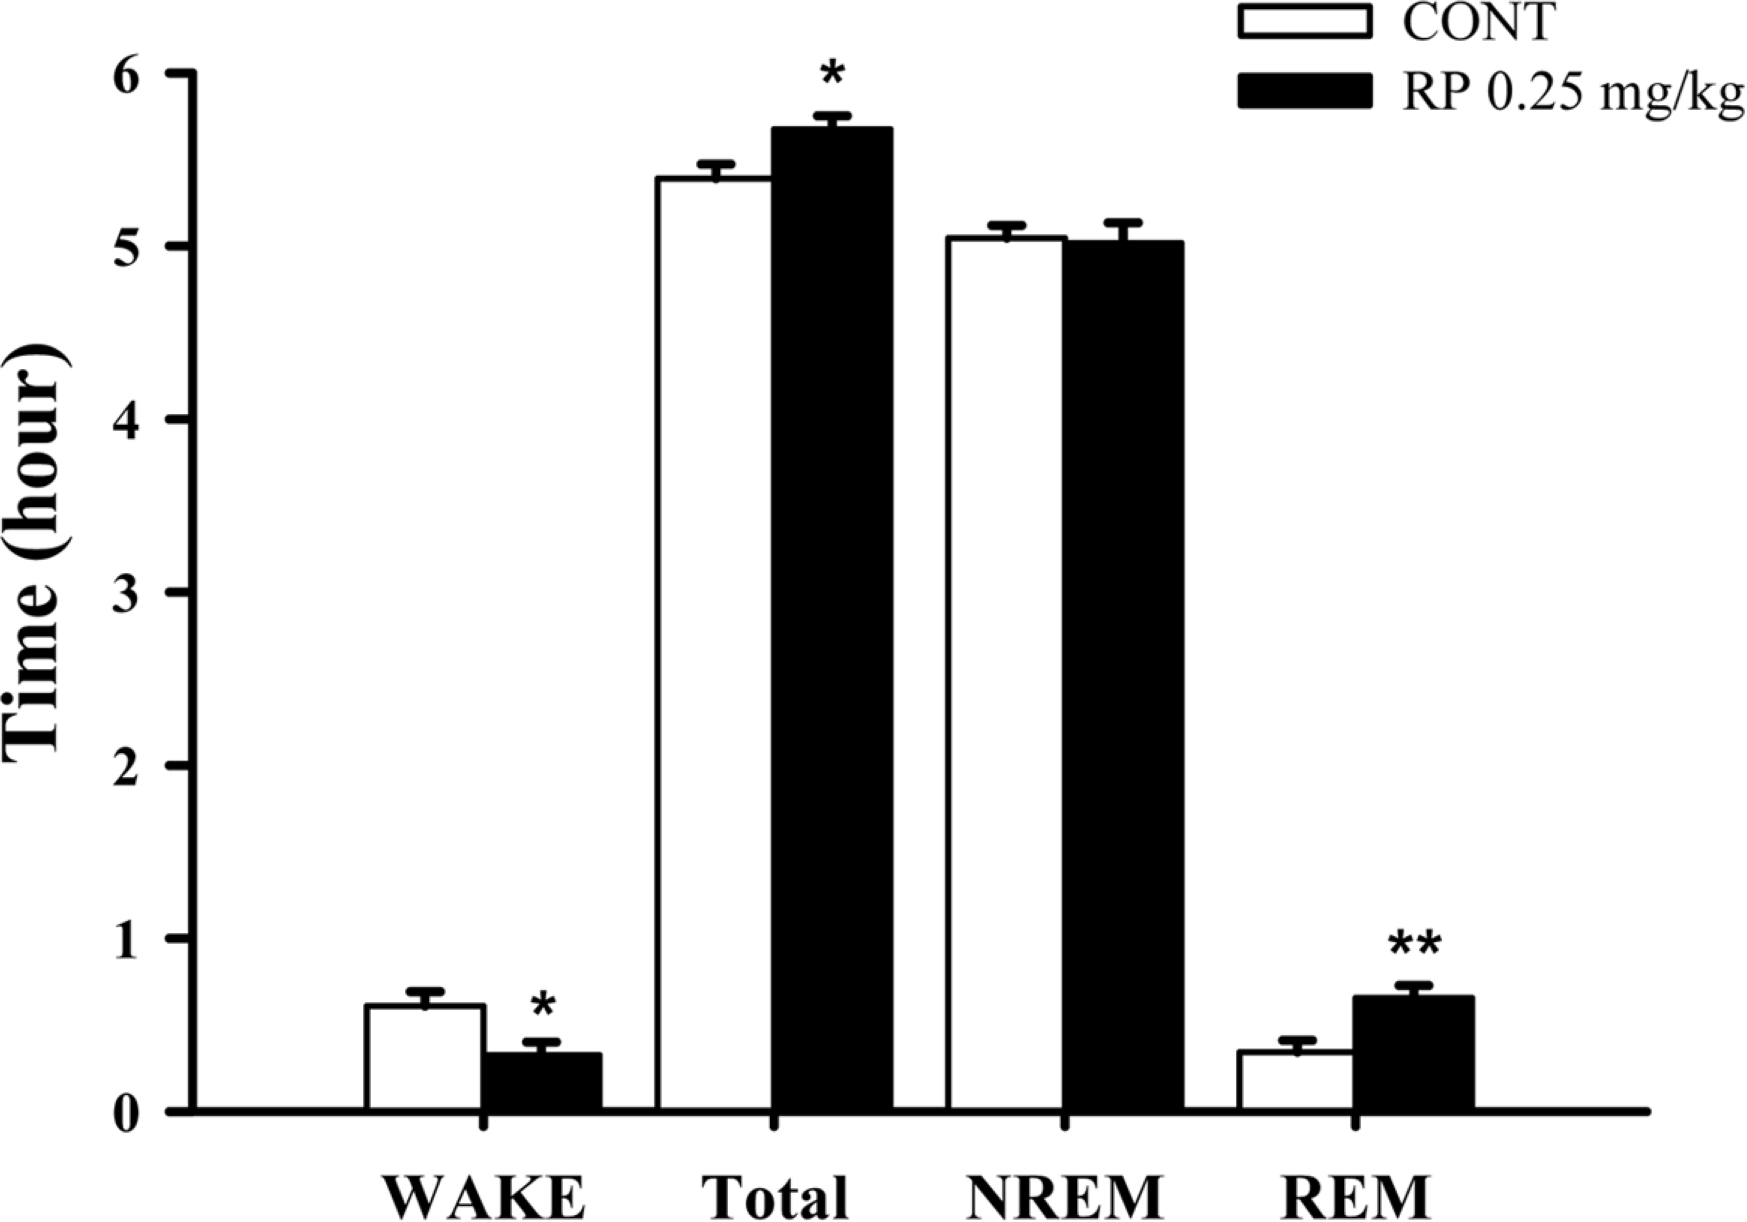
Fig. 6.
Effects of RP on Cl− influx in primary cultured cerebellar granule cells. After the hypothalamic neuronal cells were cultured for 8 days, the cells were incubated with MQAE overnight, and then RP (0.01, 0.1, and 1 µg/ml) and pentobarbital (10 µM) were added 1 h prior to measurement. Each column shows the mean ± SEM. The significance of the compounds' effects was assessed using ANOVA. Where there was significant variability, the individual values were compared using Student's t-test. ∗∗P < 0.01, ∗∗∗P < 0.005 compared with that of the control.
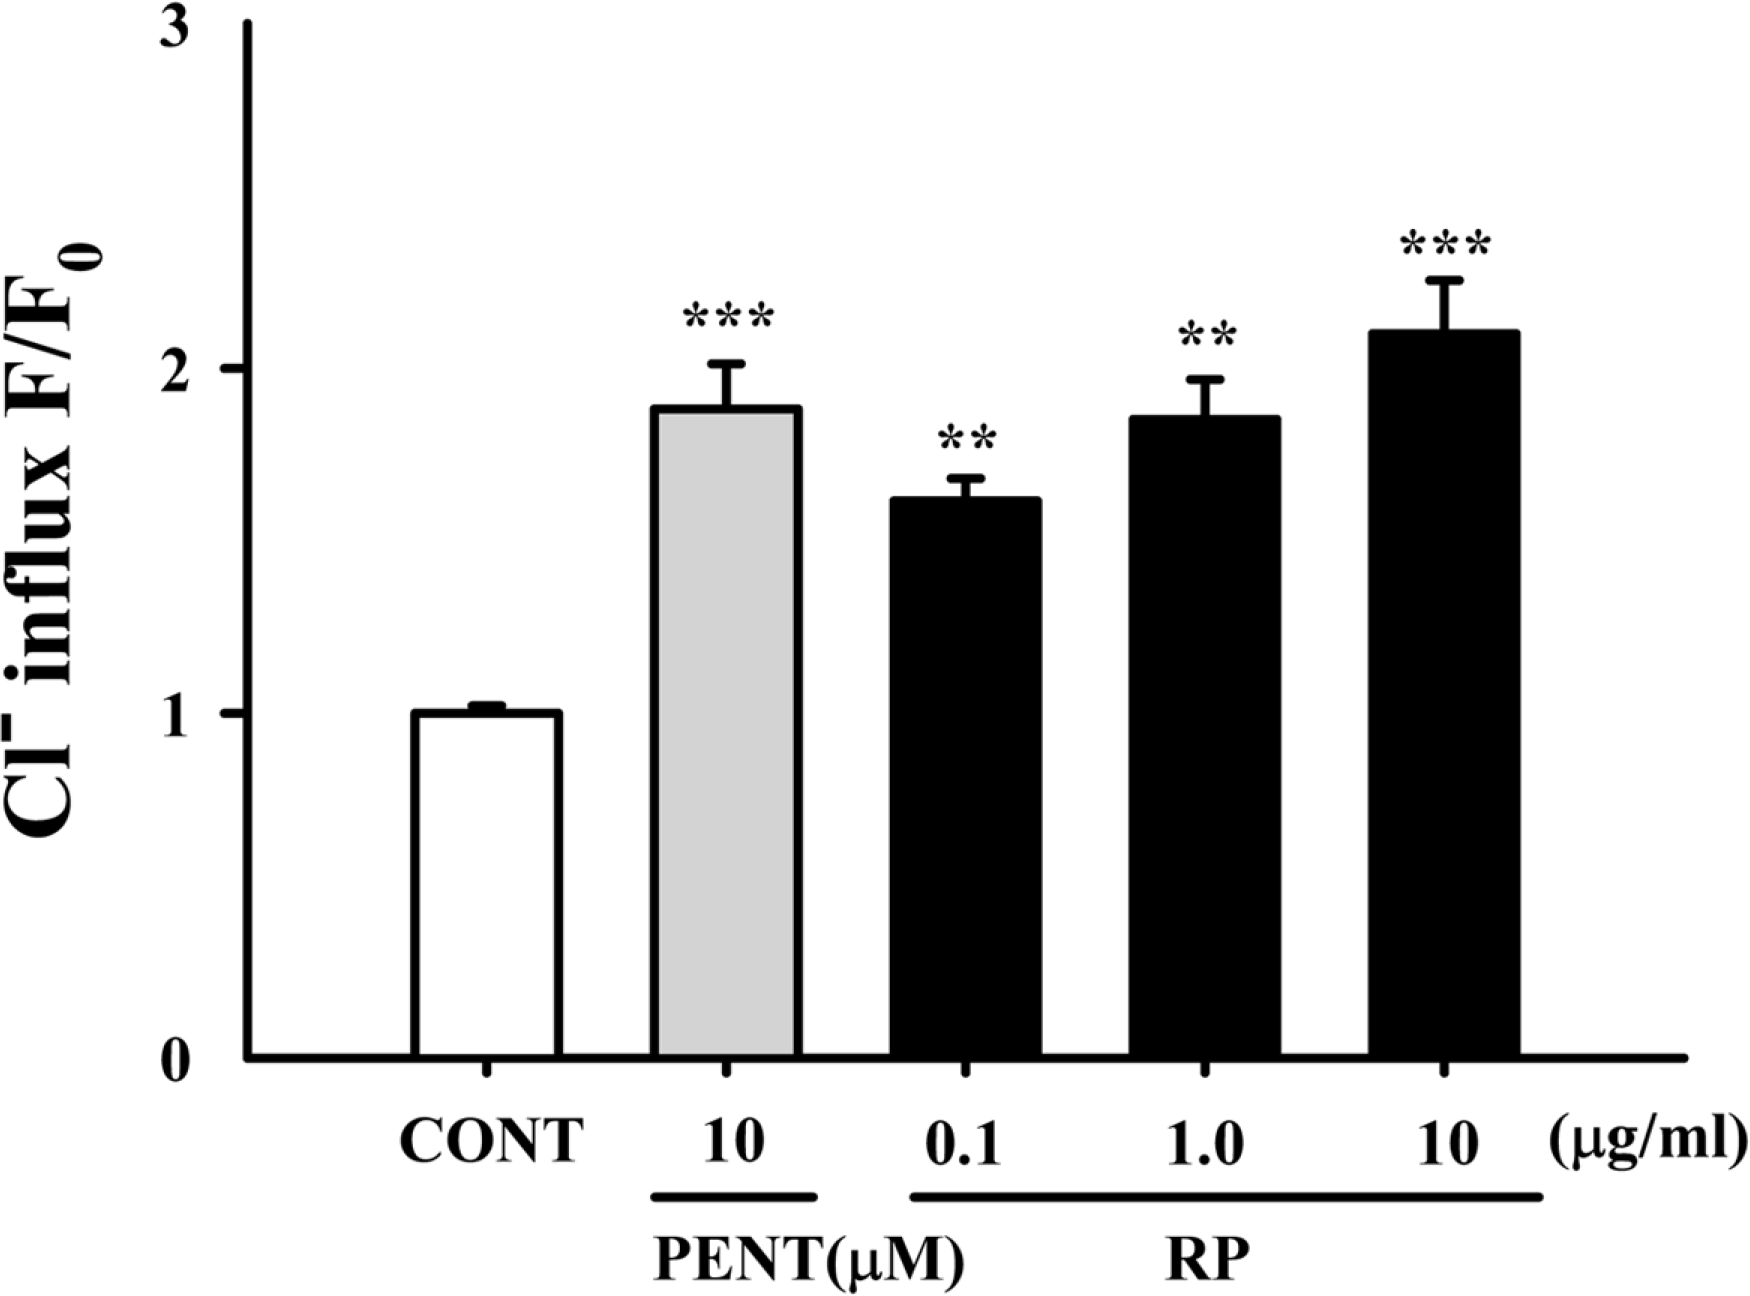
Fig. 7.
Effects of RP on the expression of GAD; the GAD65/67 expression was induced by RP (0.25 mg/kg) in the hypothalamic neuronal cells of the mice. GAPDH levels were needed in order to normalize the protein expression. Each column shows the mean ± SEM. The significance of the compounds' effects was assessed using ANOVA. Where there was significant variability, the individual values were compared using Student's t-test. ∗∗∗P < 0.005 compared with the control.
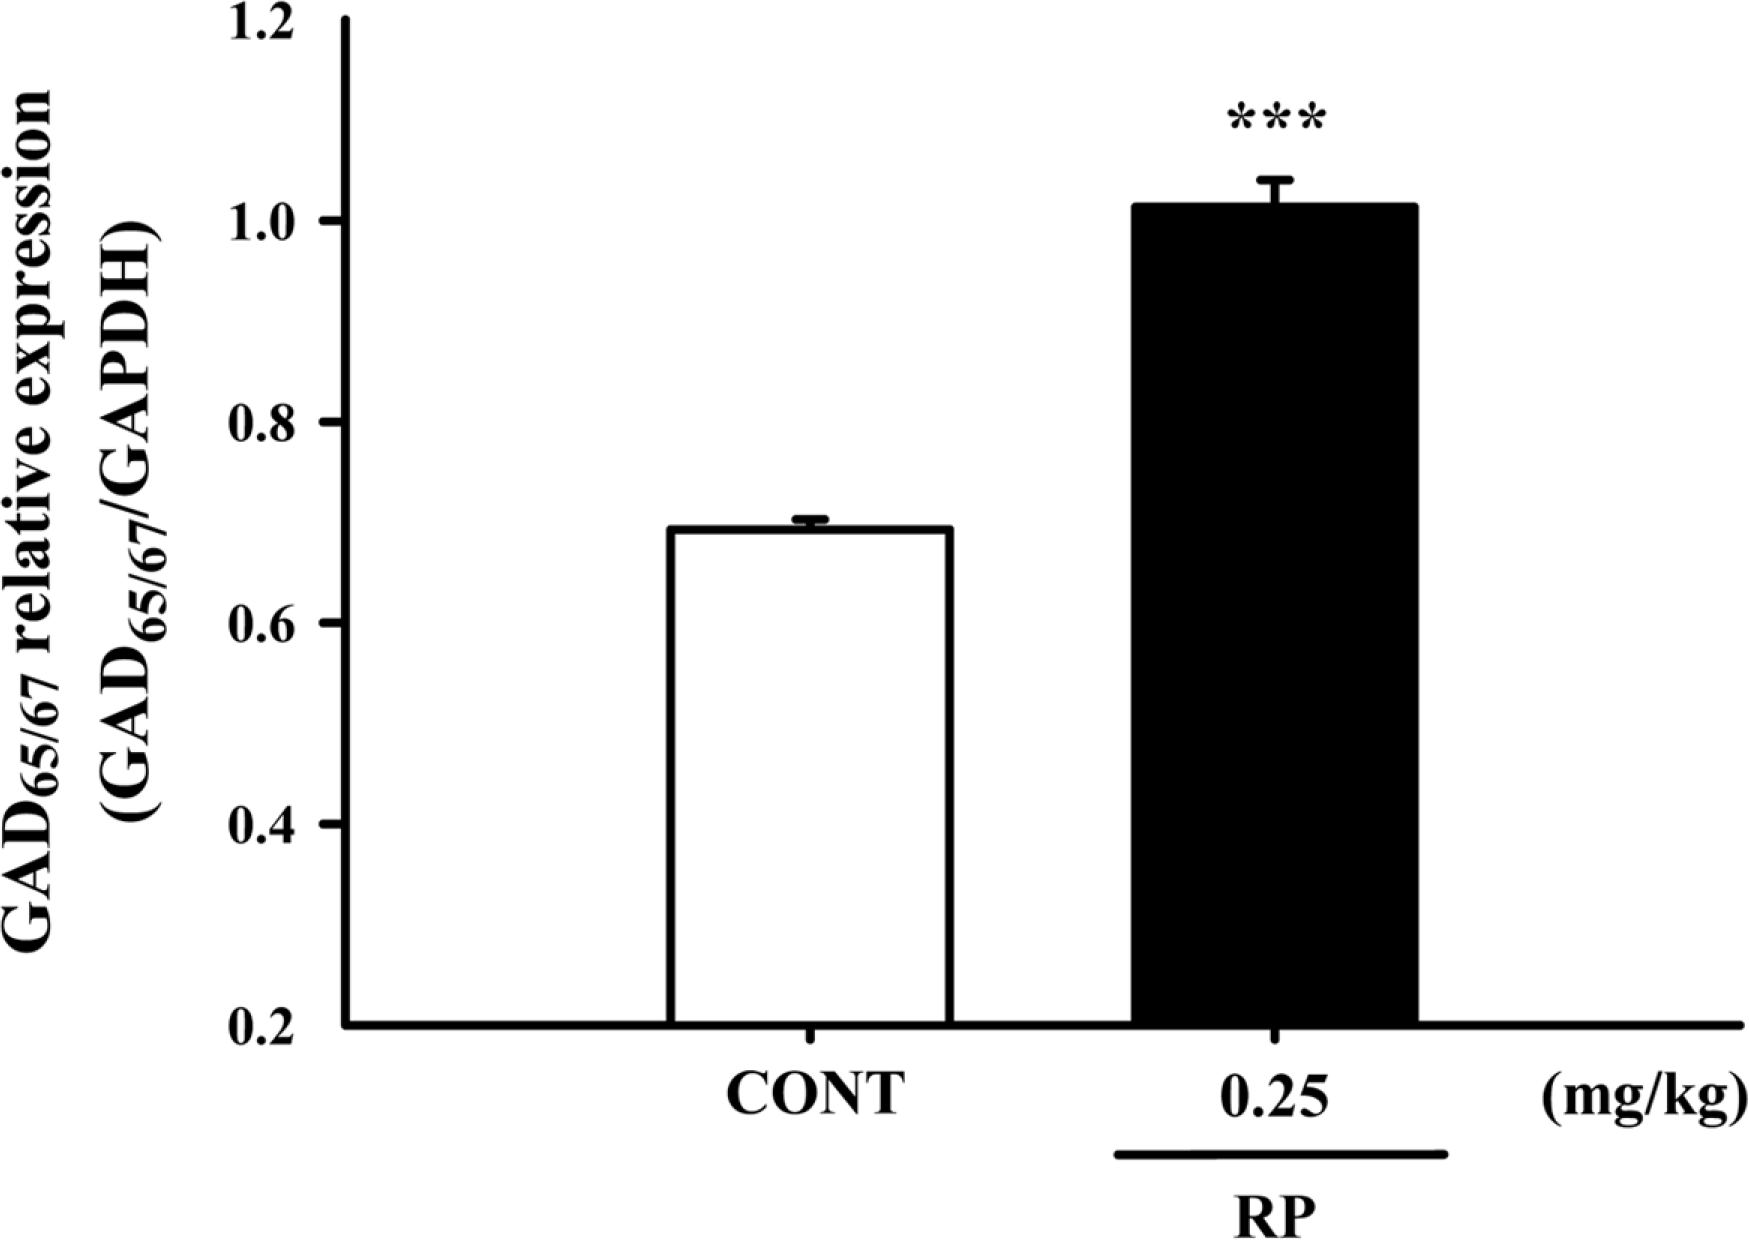
Fig. 8.
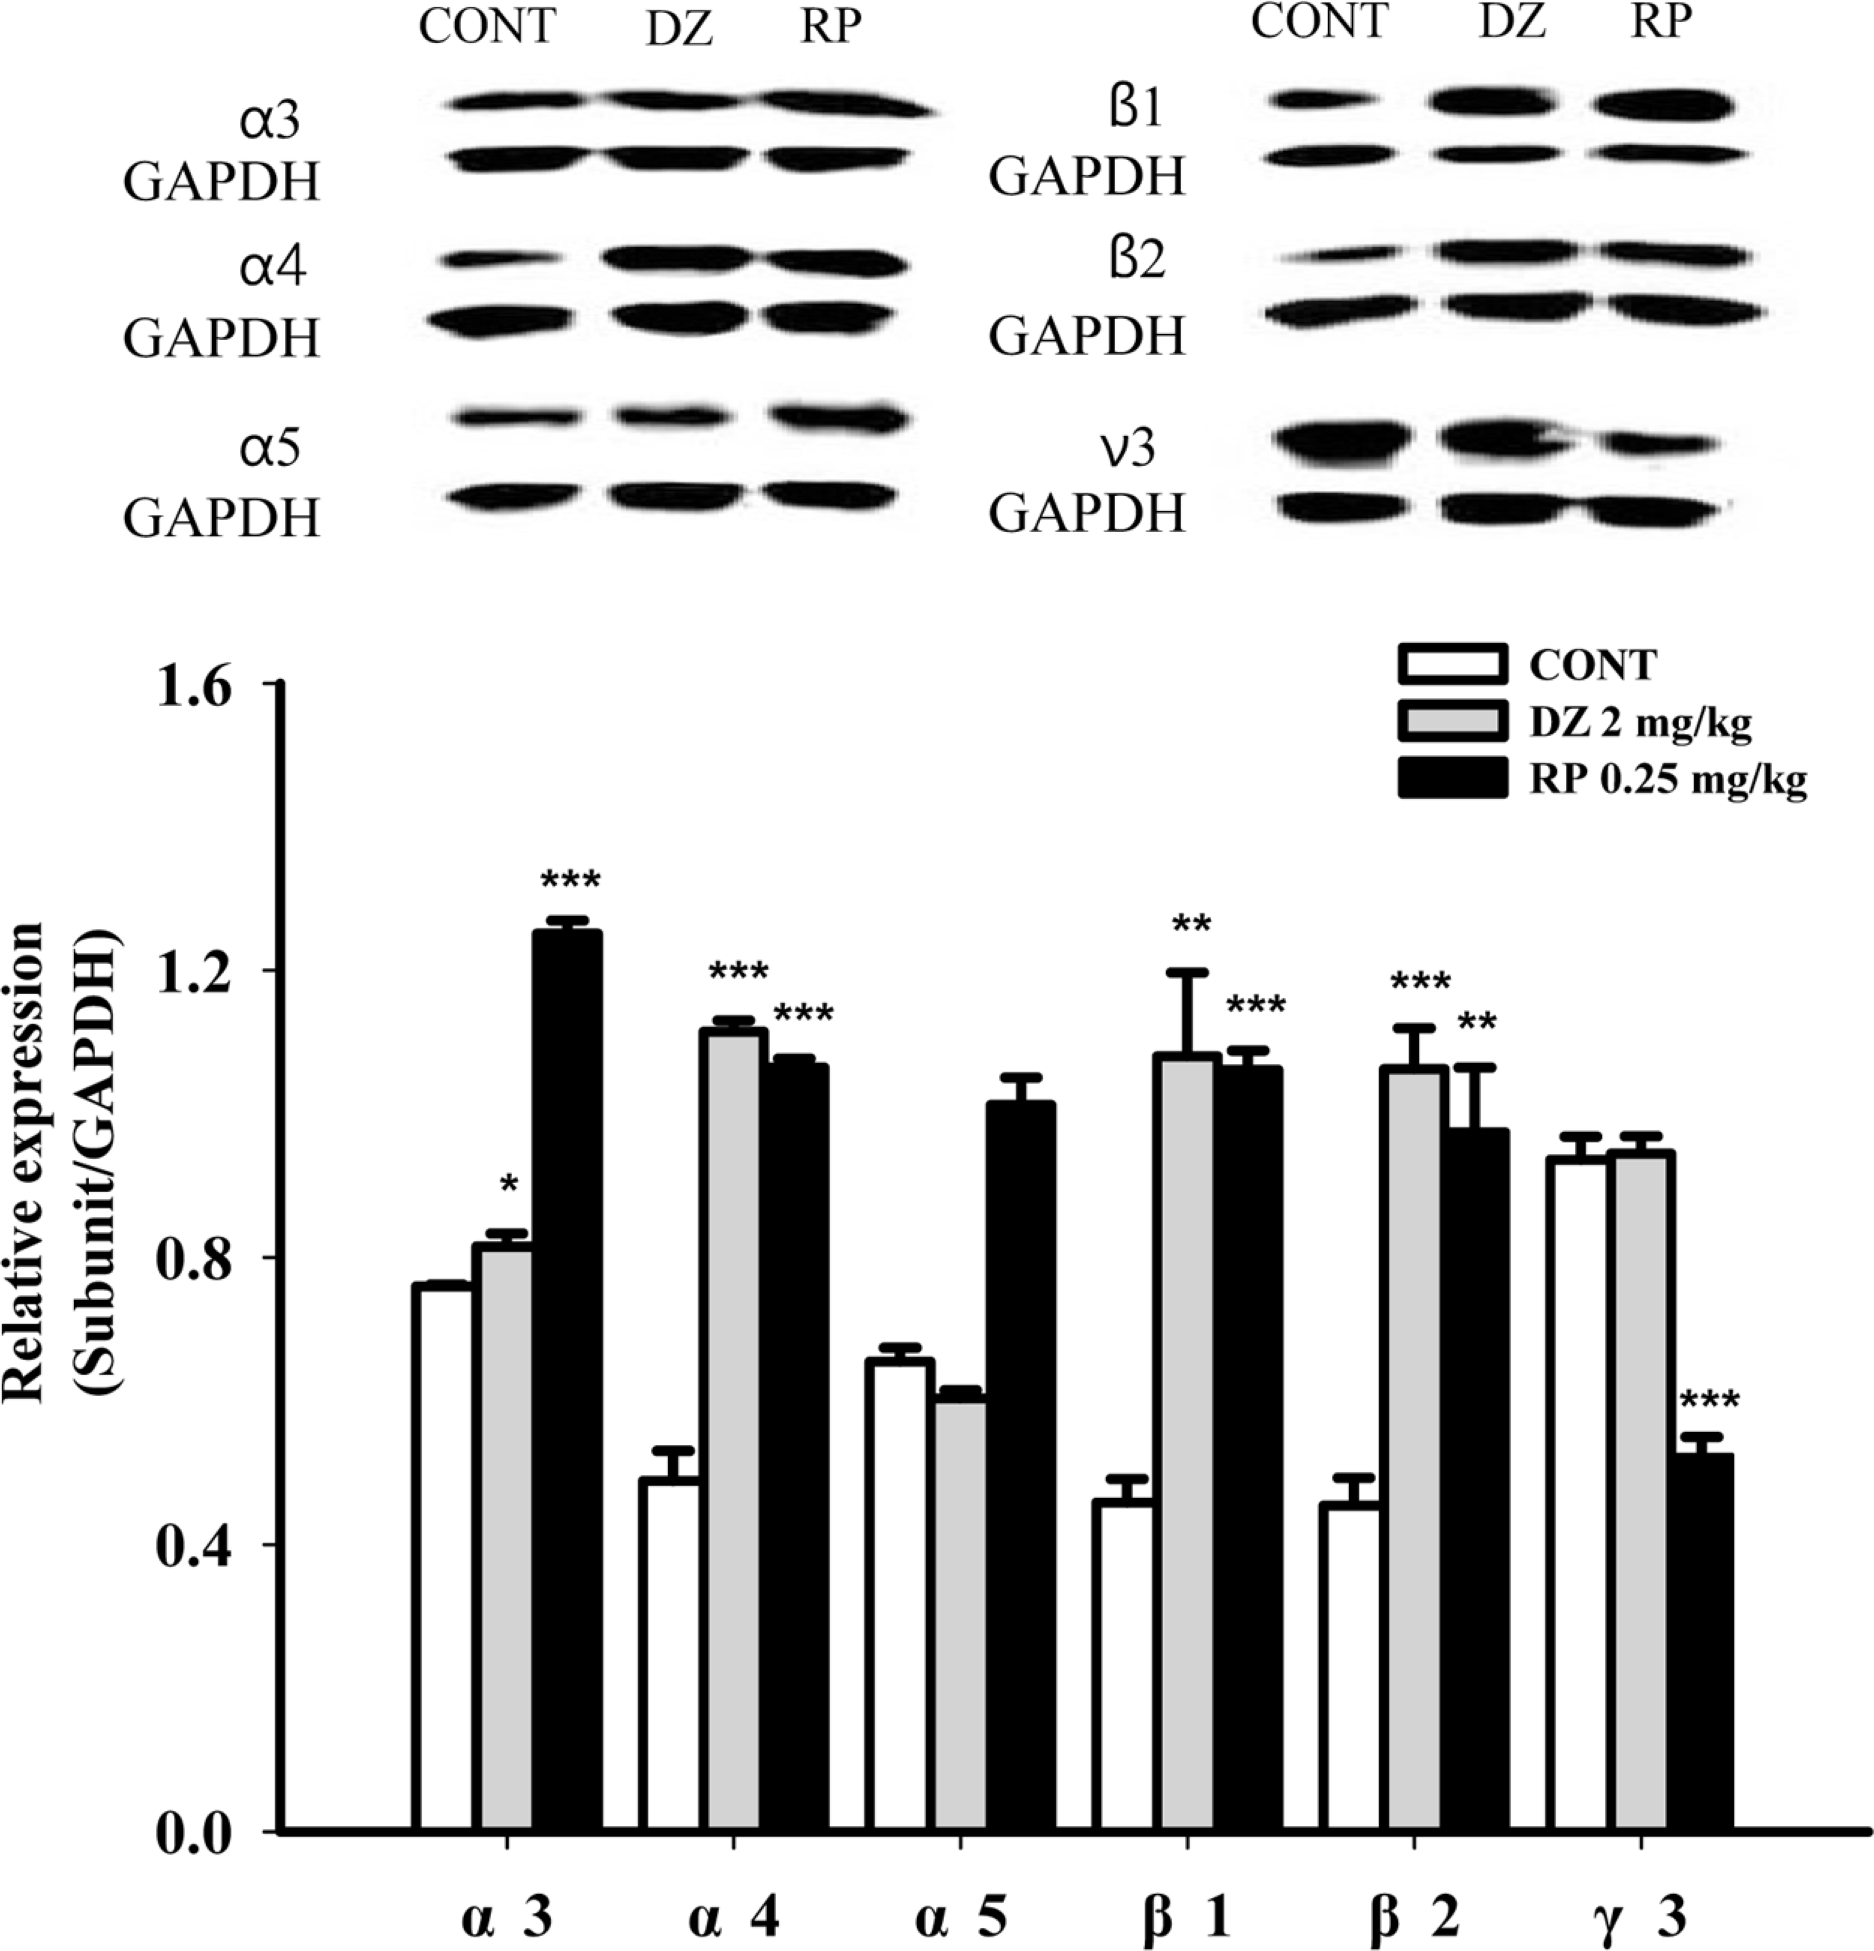
Effects of RP on expression of GABAA receptor subunits. Immunoblots are shown of lysed hypothalamic neuronal cells that were treated for 1 h following RP. GAPDH levels were needed in order to normalize the protein expression. Each column shows the mean ± SEM. The significance of the effects of the compounds was assessed using ANOVA. Where there was significant variability, the individual values were compared using Student's t-test. ∗P < 0.05, ∗∗P < 0.01,∗∗∗P < 0.005, compared with that of the control.


 PDF
PDF ePub
ePub Citation
 Print
Print


 XML Download