Abstract
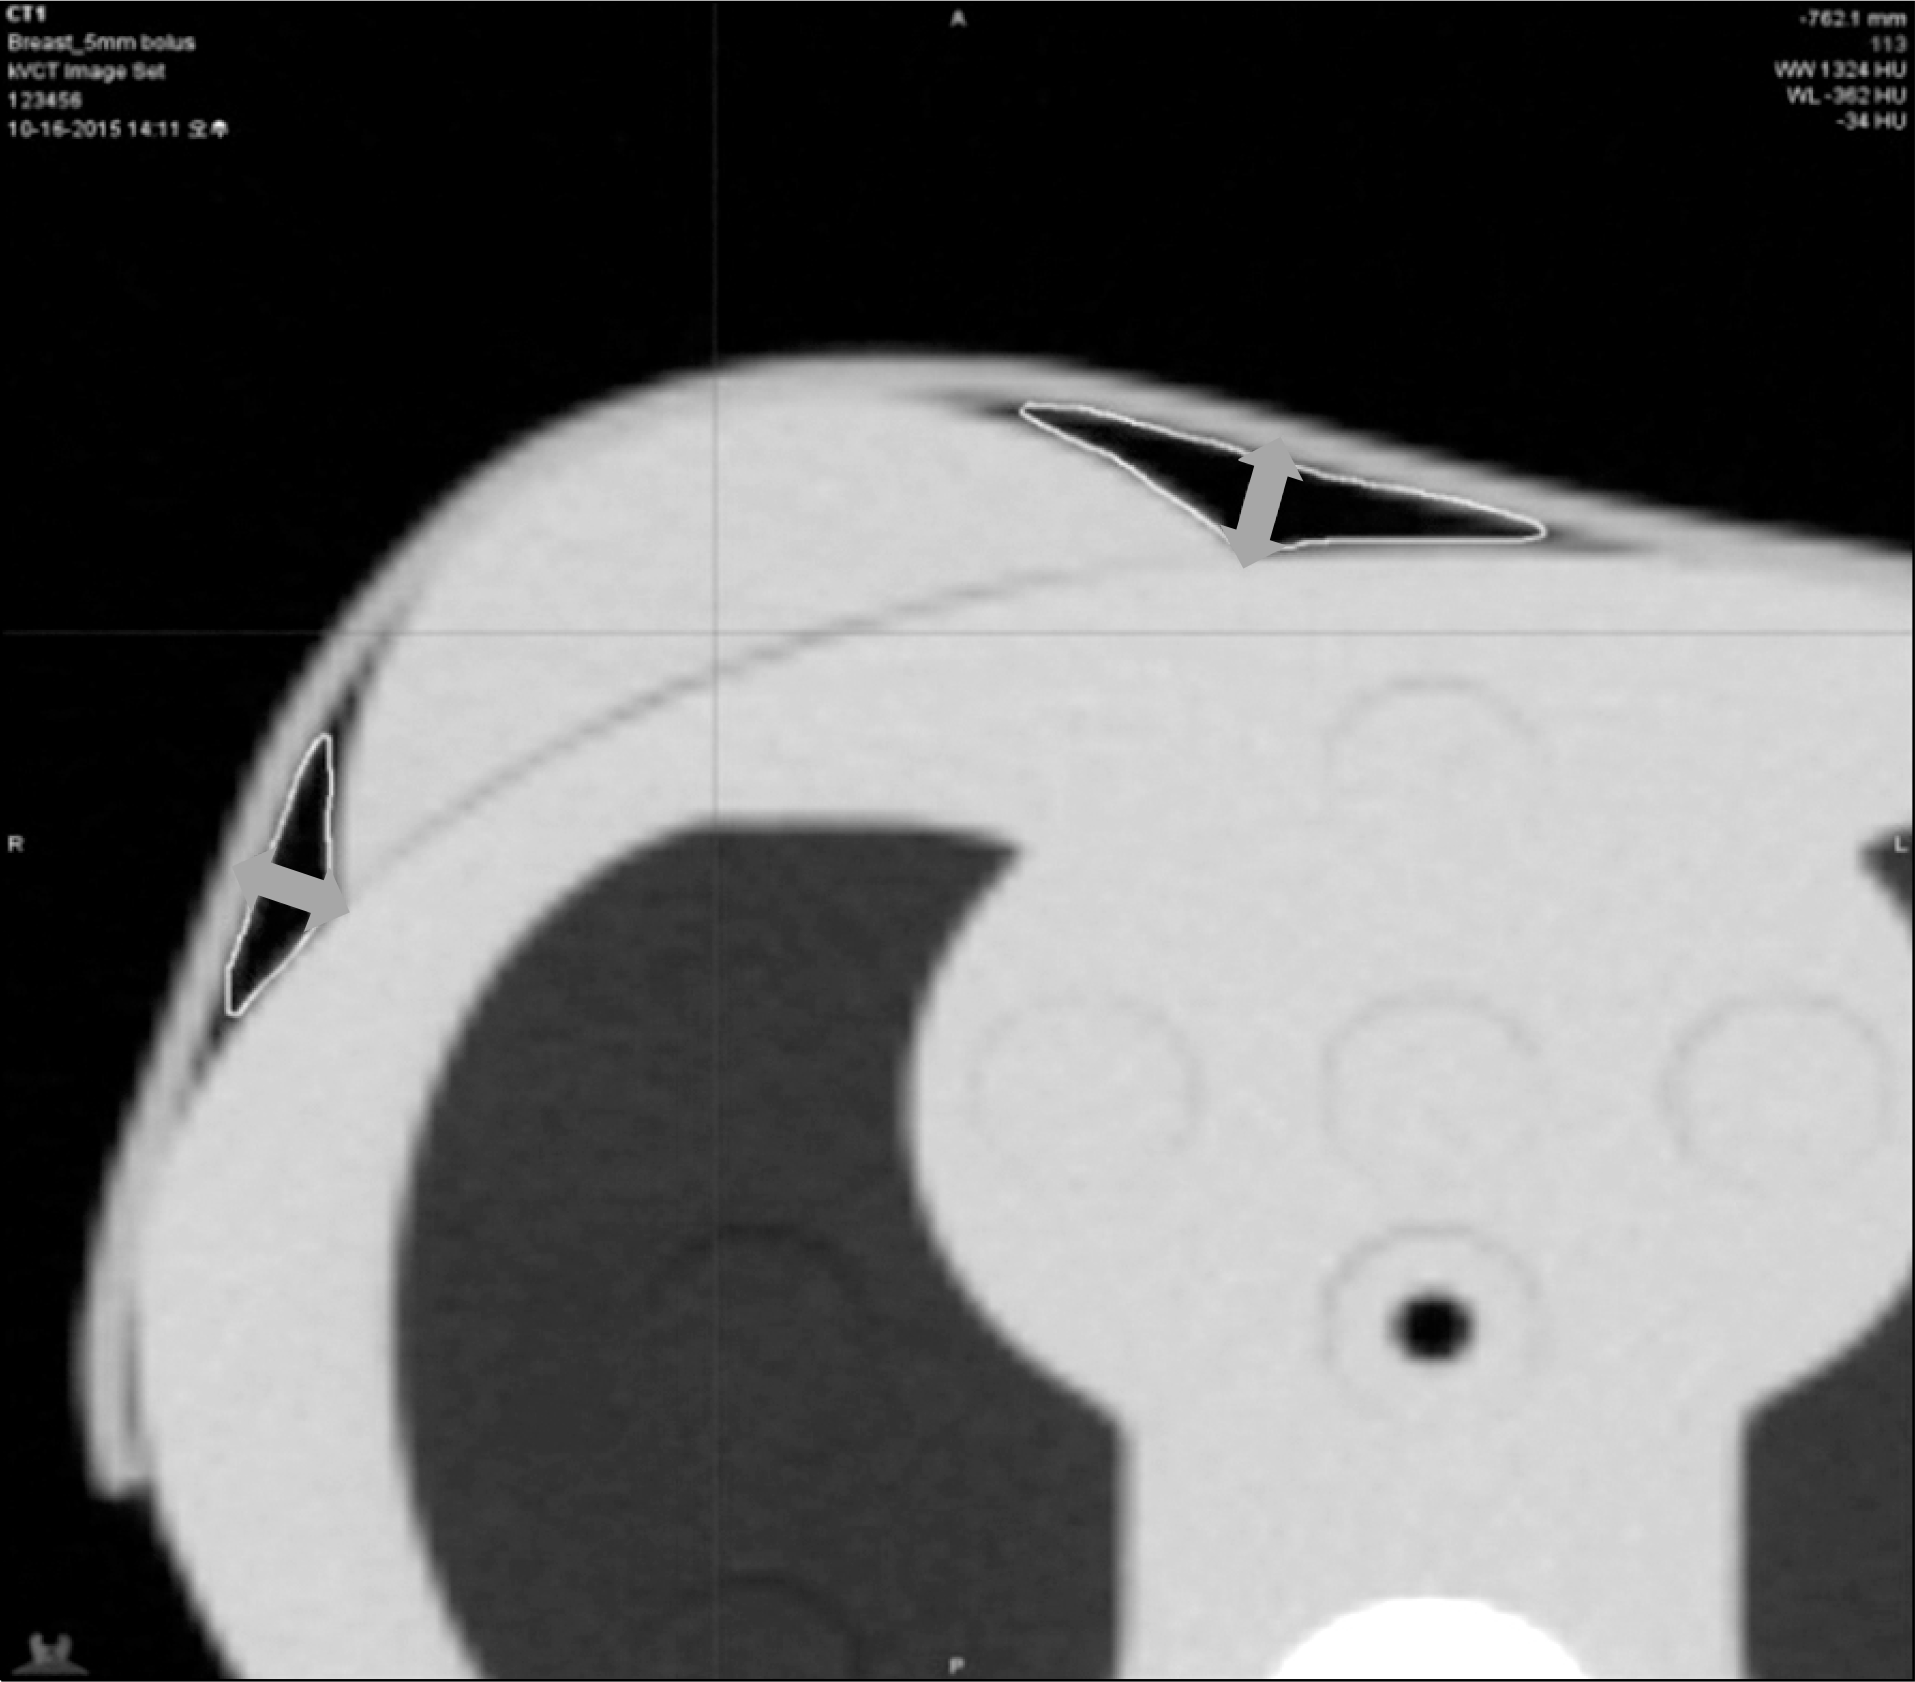
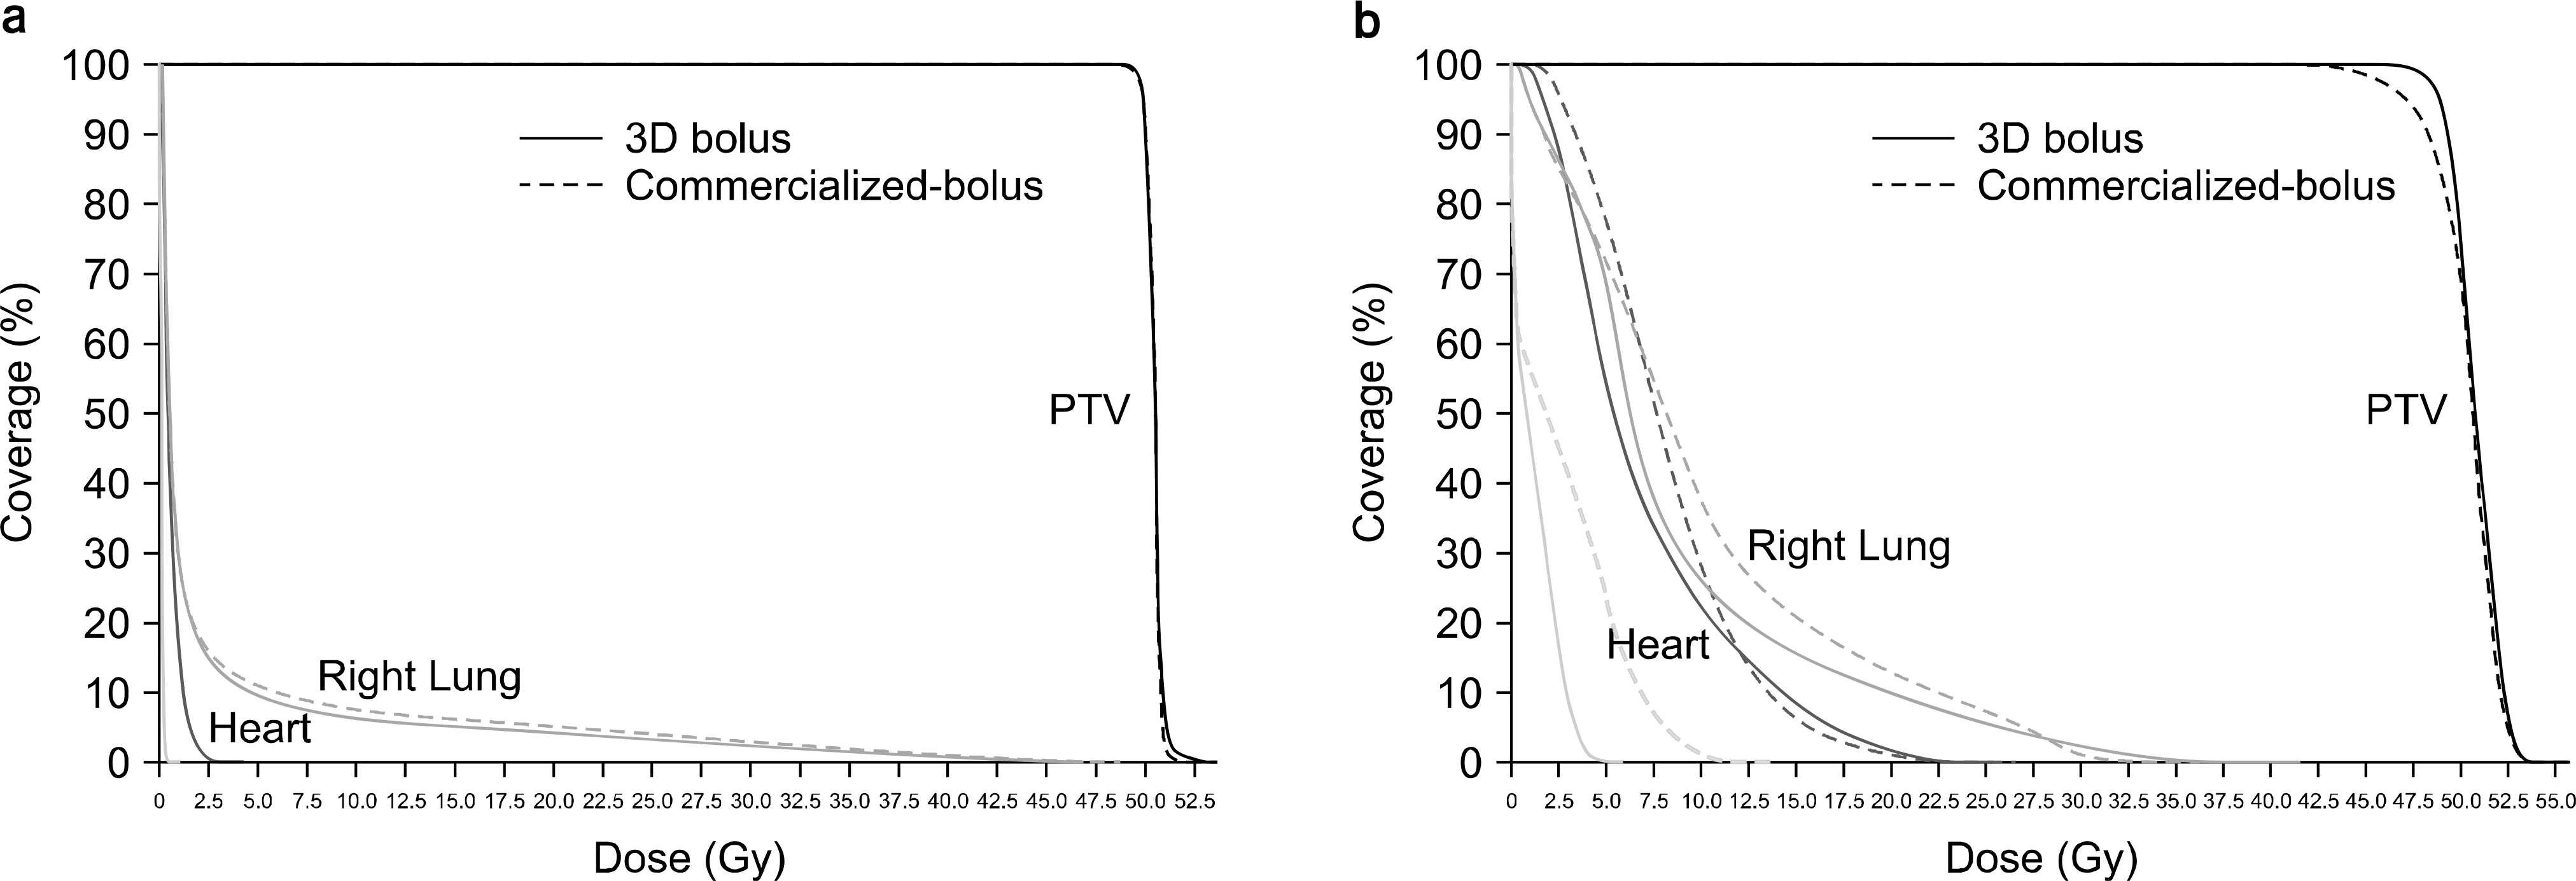
We aim to develop the breast bolus by using a 3D printer to minimize the air-gap, and compare it to commercial bolus used for patients undergoing reconstruction in breast cancer. The bolus-shaped region of interests (ROIs) were contoured at the surface of the intensity-modulated radiation therapy (IMRT) thorax phantom with 5 mm thickness, after which the digital imaging and communications in mdicine (DICOM)-RT structure file was acquired. The intensity-modulated radiation therapy (Tomo-IMRT) and direct mode (Tomo-Direct) using the Tomotherapy were established. The 13 point doses were measured by optically stimulated luminescence (OSLD) dosimetry. The measurement data was analyzed to quantitatively evaluate the applicability of 3D bolus. The percentage change of mean measured dose between the commercial bolus and 3D-bolus was 2.3% and 0.7% for the Tomo-direct and Tomo-IMRT, respectively. For air-gap, range of the commercial bolus was from 0.8 cm to 1.5 cm at the periphery of the right breast. In contrast, the 3D-bolus have occurred the air-gap (i.e., 0 cm). The 3D-bolus for radiation therapy reduces the air-gap on irregular body surface that believed to help in accurate and precise radiation therapy due to better property of adhesion.
REFERENCES
1. Khan FM. The Physics of Radiation Therapy. 3rd ed, pp.259.
2. Veronesi U, Saccozzi R, Del Vecchio M. Comparing radical mastectomy with quadrantectomy, axillary dissection, and radiotherapy in patients with small cancers of the breast. N Engl J Med:. 305:6–11. 1981.

3. Ahn Seung Kwon, Lee Won Joo, Shin Dong Bong, et al. A Study on the change of skin dose by Air-gap with patient using Bolus. The Journal of Korea society for Radiation Therapy. 13:51–58. 2001.
4. Khan FM. The Physics of Radiation Therapy. 3rd ed, pp.327.
5. Sharma S. C., Johnson M. W. Surface dose perturbation due to air-gap between patient and bolus for electron beams. Med phys. 20(1):377–378. 1993.
6. Kong M., Holloway L.An investigation of central axis depth dose distribution perturbation due to an air gap between patient and bolus for electron beams. Australasian Physical & Engineering Sciences in Medicine. 30:111–119. 2007.

7. Khan Yousaf, Eduardo Villarreal-Barajas J., Udowicz Mona, et al. Clinical and Dosimetric Implications of Air Gaps between Bolus and Skin Surface during Radiation Therapy. Journal of Cancer Therapy. 4:1251–1255. 2013.

8. Butson Martin J., Cheung Tsang, Yu Peter, Metcalfe Peter. Effects on skin dose from unwanted air gaps under bolus in photon beam radiotherapy. Radiation Measurements. 32:201–204. 2000.

9. Fuller S. M., Butz D. R., Vevang C. B., et al. Application of 3-dimensional printing in hand surgery for production of a novel bone reduction clamp. J Hand Surg Am. 39:1840–1845. 2014.

10. Dong Zhiwei, Li Qihong, Bai Shizhu, et al. Application of 3-Dimensional Printing Technology to Kirschner wire Fixation of Adolescent Condyle Fracture. J Oral Maxillofac Surg. 14:1970–1976. 2015.
11. Kim S-W, Shin H-J, Kay CS, et al. A Customized Bolus Produced Using a 3-Dimensional Printer for Radiotherapy. PLoS ONE. 9(10):e110746. 2014.

12. Ehler ED, Barney BM, Higgins PD, et al. Patient specific 3D printed phantom for IMRT quality assurance. Phys Med Biol. 59(19):5763–5773. 2014.

13. Heyns M, Breseman K, Lee C, et al. Design of a Patient-Specific Radiotherapy Treatment Target. 39th Annual Northeast Bioengineering Conference: 171-2. 2013.
14. Solomen J, Mileto A, Ramirez-Giraldo JC, et al. Diagnostic performance of an advanced modeled iterative reconstruction algorithm for low-contrast detectability with a third-generation dual-source multidetector CT scanner. Radiology. 275(3):735–745. 2015.
15. Vicini F. RTOG 0319: A Phase I/II Trial to Evaluate Three Dimensional Conformal Radiation Therapy (3D-CRT) Confined to the Region of the Lumpectomy Cavity For Stage I And II Breast Carcinoma.
16. Fernández-Delgado J, López-Pedraza MJ, Blasco JA, et al. Satisfaction with and psychological impact of immediate and deferred breast reconstruction. Ann Oncol. 19(8):1430–1434. 2008.
17. Kang HJ, Kim SW, Noh DY, et al. Immediate breast reconstruction after a mastectomy for breast cancer. J Korean Surg Soc. 59(5):584–589. 2000.
Fig. 3.
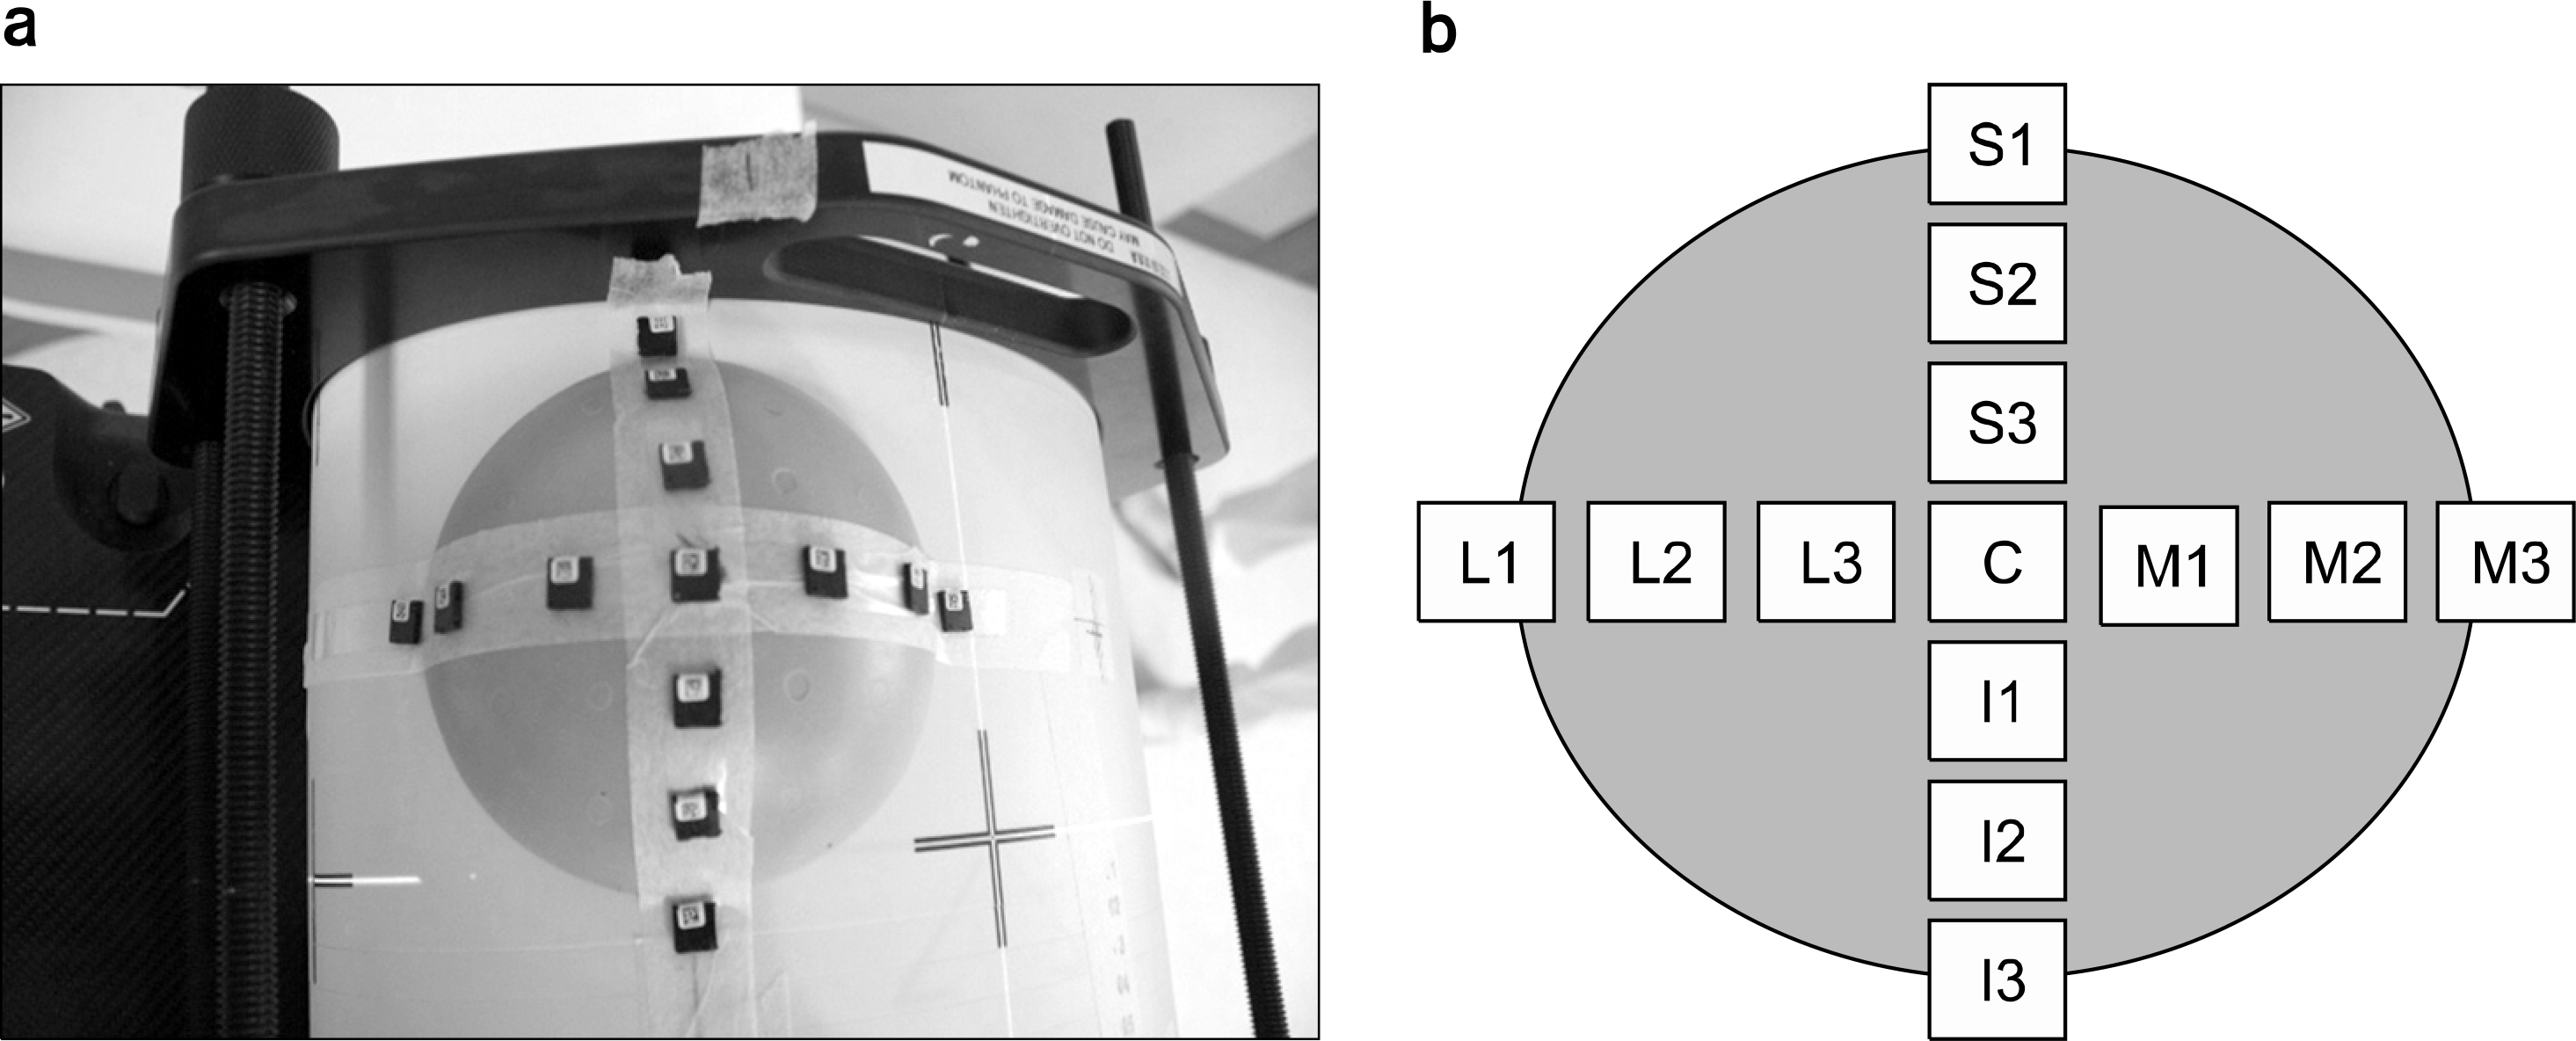
The IMRT thorax phantom with OSLDs (a) and total of 13 points in horizontal, vertical and central location in breast phantom (b) (L: Lateral, M: Medial, C: Center, S: Superior, I: Inferior).

Table 1.
OSLD measurement at 13 points for Tomo-IMRT treatment planning.
Table 2.
OSLD measurement at 13 points for Tomo-Direct treatment planning.


 PDF
PDF ePub
ePub Citation
 Print
Print


 XML Download