

 PDF
PDF ePub
ePub Citation
 Print
Print


Introduction
Blood pressure typically exhibits a circadian rhythm with a rise in the morning and a fall in the night.[12] This is not true for all individuals, however, and atypical patterns associated with an absence of nocturnal decline and even a paradoxical increase have been reported. Such individuals are defined as ‘non-dippers’ in the literature and are known to be associated with increased risk of cerebrovascular events.[3456] Unlike other physiological rhythms, blood pressure is known to depend on activity and sleep rather than clock time per se,[7] and ‘non-dipper’ phenotype might arise from differences in daily activities rather than from an inherent biological polymorphism.
From the viewpoint of clinical pharmacology, the acquisition of an unbiased estimate of drug effect in antihypertensive agents requires a set of reference values of untreated blood pressure. Such information can be acquired from randomized clinical trials, either through the control group in parallel design studies or run-in periods in crossover studies. Tanigawara et al,[8] as part of a PKPD modeling work of olmesartan and azelnidipine, built a model of circadian variation of blood pressure based on ambulatory blood pressure monitoring data acquired during the run-in period and subsequently built a drug effect model using data from the treatment period.
In addition to unbiased estimation of the drug effect of antihypertensive drugs, placebo effect on blood pressure is required for the assessment of drug safety on vital signs and other cardiovascular variables acquired during drug development. When analyses must be conducted for drug effect on blood pressure in an ad hoc manner using retrospective data originally collected for alternative purposes (such as safety monitoring), identifying different sources of blood pressure variability is difficult without the information on the placebo effect.
Authors of this work have previously published a report whereby physiologic relationships among mean arterial pressure (MAP), pulse pressure (PP), and heart rate (HR) were exploited to simultaneously estimate circadian variation, homeostatic feedback mechanism, and drug effect,[9] but the estimates related to circadian variation showed significant deviation from that known in the literature. This is an expected result considering the sparse sampling scheme consisting of only 5 measurements per patient over a 24 hour period, but better results would have been possible if prior information with which to perform Bayesian analyses were available.
In this context, an investigator-initiated clinical trial was undertaken in this work where blood pressure was measured on an hourly basis for 24 hours without drug treatment. The purpose of the trial was to generate data for modeling the placebo effect that predicts baseline or pre-treatment blood pressure fluctuations or circadian variation in the Korean population. In particular, we attempted to model circadian variation of not only the typical ‘dippers’ but also ‘non-dippers’. To the authors' knowledge, numerous models have been proposed to predict the typical ‘morning rise, night fall’ circadian pattern but none yet to predict the atypical profile of the ‘non-dippers’. We intended to fill this void by constructing a model that encompasses both subpopulations, offering a more comprehensive reference of circadian blood pressure fluctuations.
Methods
Study protocol
Out of 117 male subjects who previously participated in a bioequivalence study of a newly developed fixed-dose combination tablet of telmisartan 80mg/rosuvastatin 20mg, 23 were recruited for an additional investigator-initiated clinical trial. The trial was conducted between July and September 2013 in the clinical trial center of Severance Hospital, Seoul Korea. Subjects exhibiting systolic blood pressure (SBP) greater than or equal to 150 mmHg or less than or equal to 100 mmHg, or diastolic blood pressure (DBP) greater than or equal to 100 mmHg or less than or equal to 65 mmHg were excluded from this study.
Study participants were refrained from taking excessive alcohol (> 30 g/day), smoking (> 10 cigars/day), and any kind of medication beginning from 7 days prior to trial initiation. Subjects were admitted to the clinical trial center 1 day before intensive blood pressure (BP) measurements and were put to bed at 11 PM. No food intake was allowed after 10 PM.
On day 1, BP measurements were taken on an hourly basis beginning at 8 AM for 24 hours. Lunch and dinner were provided at 12 AM and 6 PM, respectively. BP measurements were continued into sleep-time. On day 2, study participants were discharged after the last blood pressure measurement at 8 AM. A follow-up BP sampling was done on day 3 at 8 AM.
All BP measurements during wake hours were taken at heart level in a sitting position after at least 5 minutes of rest. During sleep, BP measurements were taken in a sleeping position so as to minimize unnecessary stimulations. Both SBP and DBP were collected from each measurement.
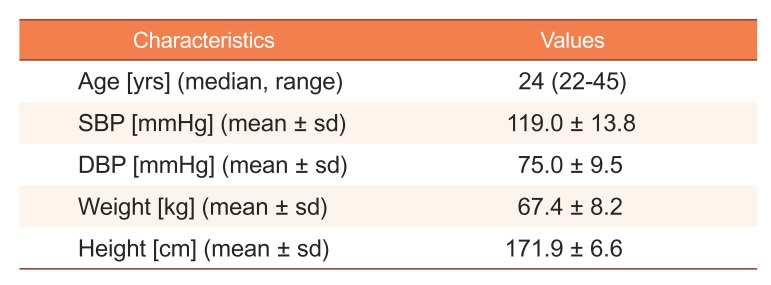
The demographics of the study participants are summarized in Table 1.
Modeling circadian rhythm
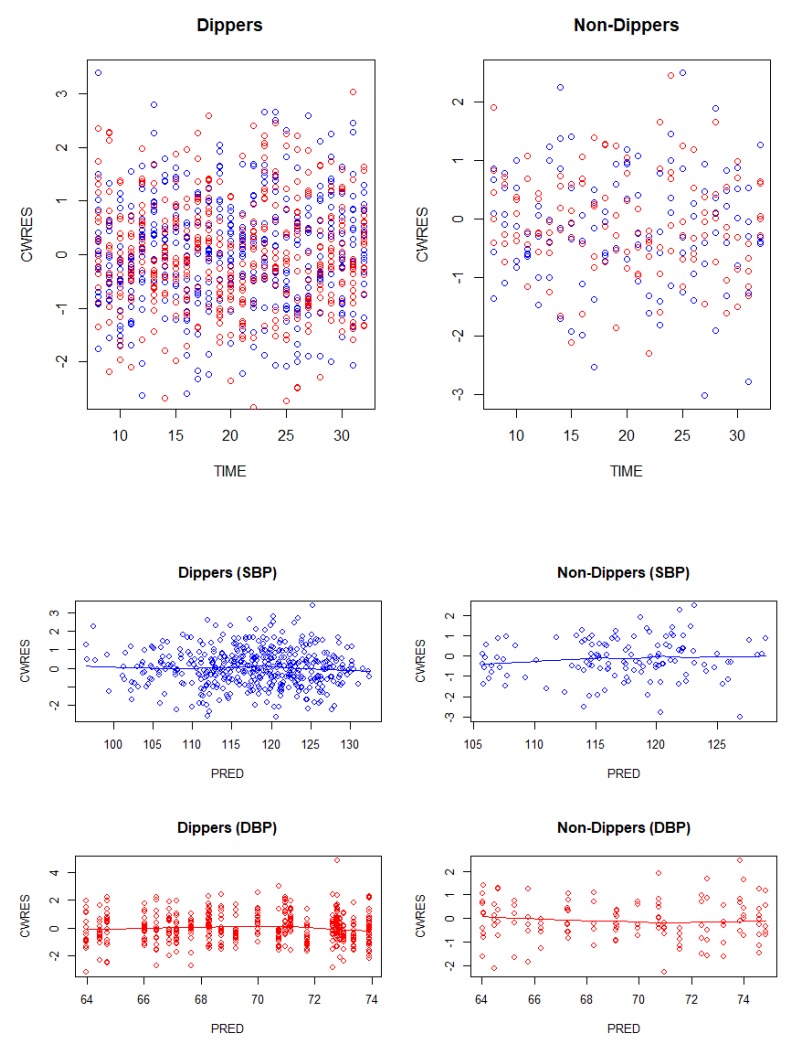
Circadian fluctuations in SBP and DBP were modeled simultaneously using two cosine functions with periods 24 and 12 h as described in (1) and (2).
CIRC(t) is the circadian rhythm at t, with reference time (i.e. t = 0) set to 12 AM, Amp24, Phase24 and Amp12, Phase12 are amplitude and phase of oscillator for periods 24 and 12 h, respectively, assumed to differ between SBP and DBP, Mesor is the mean BP over 24 h, and ε is the measurement error. A mixture model was used to identify subgroups of subjects exhibiting different circadian profiles assuming a common mesor and different amplitudes and phases between subgroups. NONMEM software implements a mixture model by estimating pik (θ), the mixture probability of the kth mixture (k = 1,‥,r) for the ith subject, and then calculating Li, the marginal likelihood for the ith subject, as Li =  (θ)·∫ lik (η,θ)·h(η,Ω)dη, where lik (η,θ) represents the conditional likelihood given η and h(η,Ω) the density function of η.
(θ)·∫ lik (η,θ)·h(η,Ω)dη, where lik (η,θ) represents the conditional likelihood given η and h(η,Ω) the density function of η.Model parameters were assumed to differ randomly among study individuals.
In the above, η is defined as a random variable following a normal distribution centered at zero with an associated variance ω2. Param is an individual-specific parameter whereas tvParam is the expected (typical) model parameter estimate.
Model building was initially done without assuming a mixture distribution of model parameters. This base model was defined as ‘Model 1’. Next, a mixture distribution of the set of circadian parameters was assumed in ‘Model 2’. The improvement in model fit with this added assumption was tested based on the comparison of objective function values.
Exploratory data analysis was undertaken whereby patient covariates of age and weight were plotted against the empirical Bayesian estimates of the model parameters to select covariate candidates showing any correlation with parameters. Covariate model building was then carried out on the selected candidates using a stepwise selection algorithm performed at the significance level of p < 0.01 for forward addition and p < 0.001 for backward deletion. The covariate-incorporated model was defined as ‘Model 3’.
Additive, proportional, and combined residual error models were tested and the one offering the lowest objective function value was selected.
Model validation
Model fit was assessed using basic goodness of fit plots (DV vs. PRED, CWRES vs. PRED, CWRES vs. TIME, etc.) during the model building stage. Model comparison was done based on objective function value (OFV) and estimated standard errors of model parameters. A decline of OFV beyond the threshold value of a chi-square statistic associated with p-value < 0.05 was used as evidence of model improvement. The precision of model parameter estimates was judged based on the standard errors (SE) calculated using the default covariance matrix provided by NONMEM (i.e.R−1
SR−1, where S and R denote cross-product gradient and Hessian matrices, respectively). The final model was validated using a visual predictive check (VPC) procedure given 1,000 simulated datasets. Percentiles of 2.5%, 50%, and 97.5% of observations were compared with the prediction interval of corresponding percentiles to assess whether most of the observations fell within each interval.
Results
OFV difference between Model 1 and 2 was highly significant (ΔOFV = 37.1, p < 0.0001). Weight was incorporated into Mesor for SBP as follows, leading to an OFV decline of 18.9 (p < 0.0001):
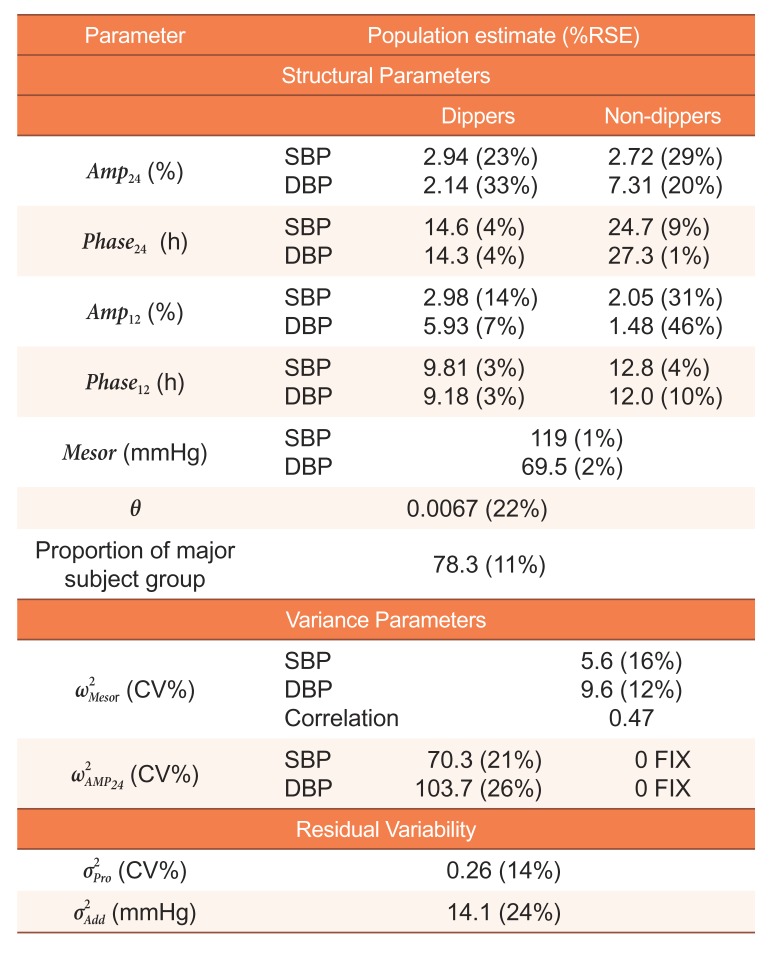
Where tvMesorSBP represents the typical estimated mesor for SBP, MesorSBP the value of tvMesorSBP evaluated at the median weight (WT) of 70 kg, θ the covariate coefficient, and η the unexplained deviation from the population mean. Table 2 shows the parameter estimates acquired from fitting Model 3 to data. In the typical subject group (i.e. ‘dippers’) comprising 78% of the study subjects, Phase24 and Phase12 for SBP were 14.6 and 9.81 hours, and those for DBP were 14.3 and 9.18 hours, indicating SBP and DBP were in phase as expected. Our results were in close agreement with values reported in the literature [8] (with estimates of Phase24 and Phase12 for SBP reported as 14.32 and 8.93 hours). The acrophases of the minor subject group (i.e. ‘non-dippers’) showed no resemblance to those of the typical subject group, however, and returned estimates of 24.7 and 12.8 hours for SBP and 27.3 and 12.0 hours for DBP for Phase24 and Phase12, respectively.
Random interindividual variability was incorporated into Mesor in both subject groups and Amp24 in the typical subject group. Incorporation of random interindividual errors into other model parameters or into those of the ‘non-dippers’ did not lead to OFV decline associated with p < 0.05.
The combined error model incorporating both proportional and additive error components seemed to best describe our data.
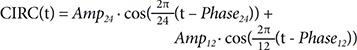
The typical predicted values of SBP and DBP based on the final model (i.e., model 3) of each subject group are graphically depicted in Figure 1. There seems to be a tendency of lower mesor in the ‘non-dipper’ subject group, but a post-hoc comparison of mesor between ‘dippers’ and ‘non-dippers’ failed to show a statistically significant difference when evaluated based on two-sample t-tests, with p-values of 0.078 and 0.079 for SBP and DBP, respectively.
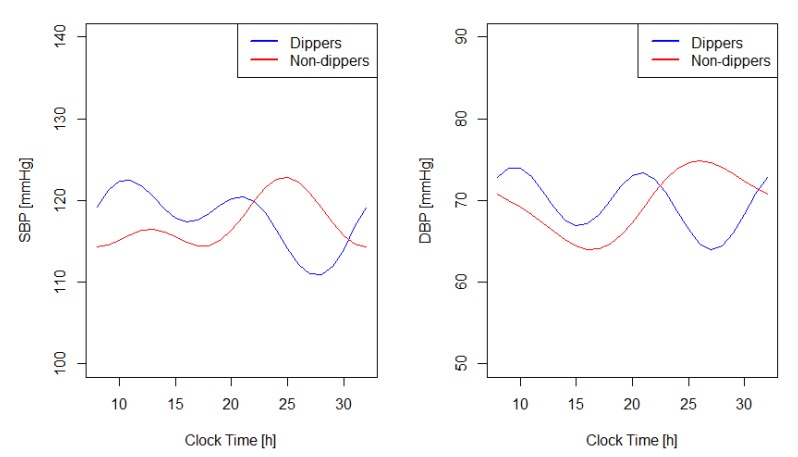
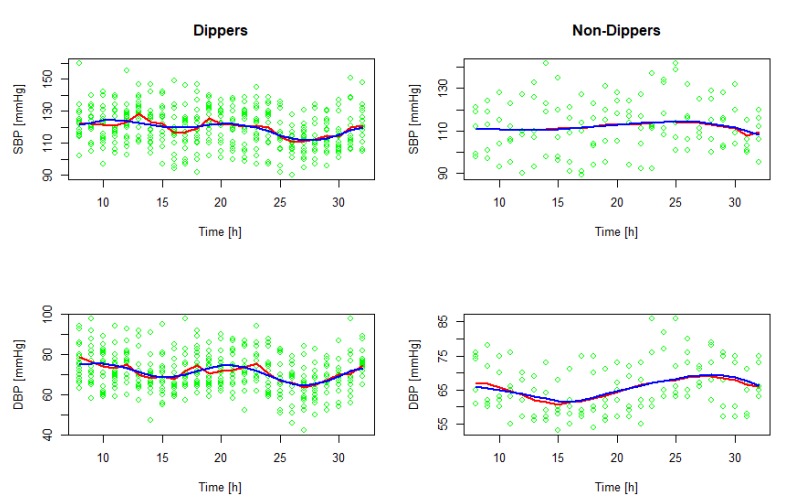
Figure 2 shows predictions superimposed on observations, suggesting that predicted values agree reasonably well with the observations. Figure 3 shows conditional weighted residuals plotted against time and predictions, demonstrating no appreciable trends.
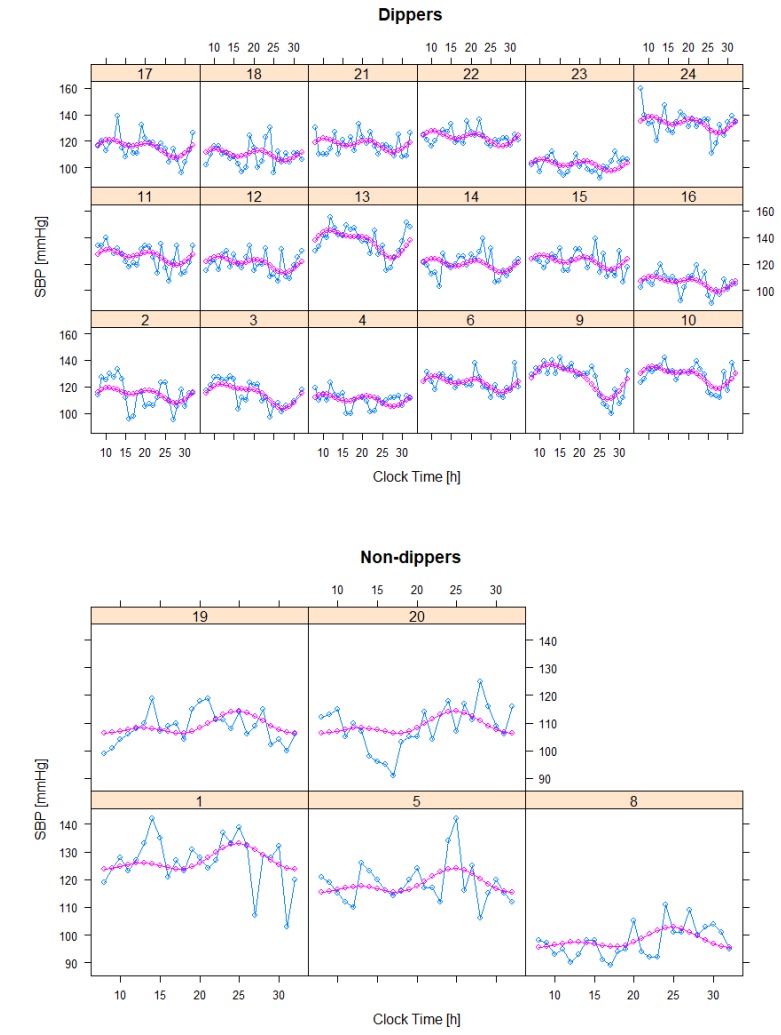
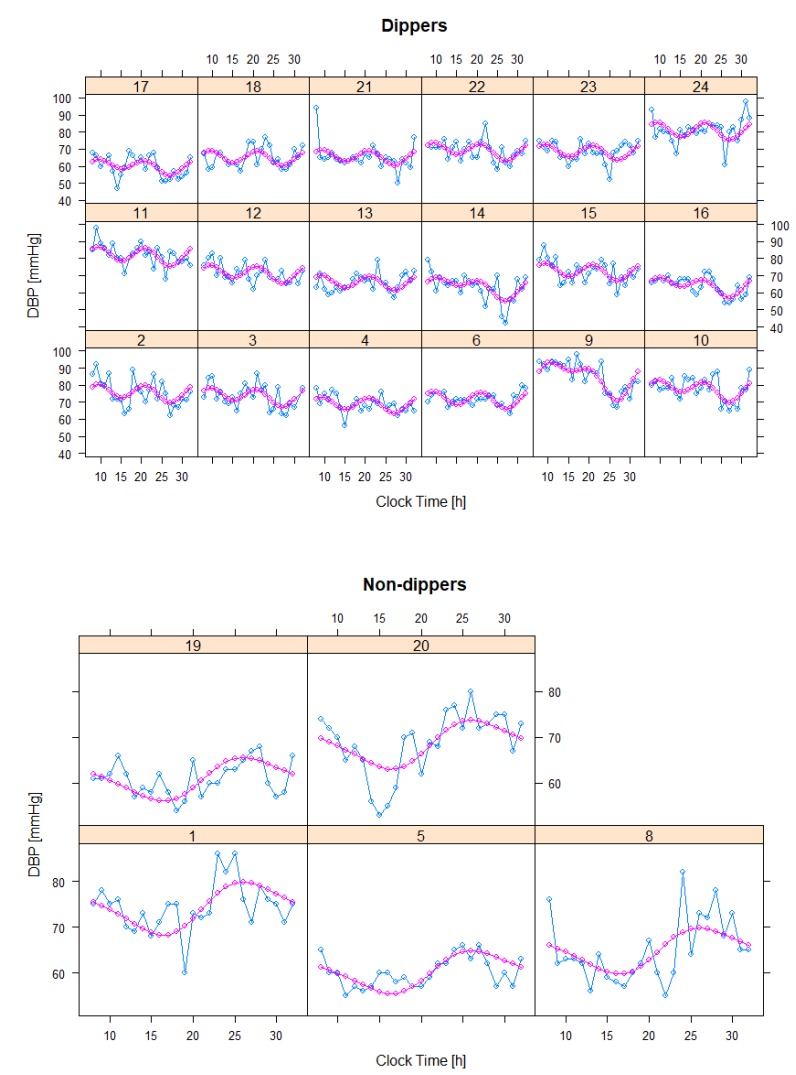
Figures 4 and 5 show individual predictions superimposed on observations, indicating our model seems to offer sufficient flexibility to describe observed data.
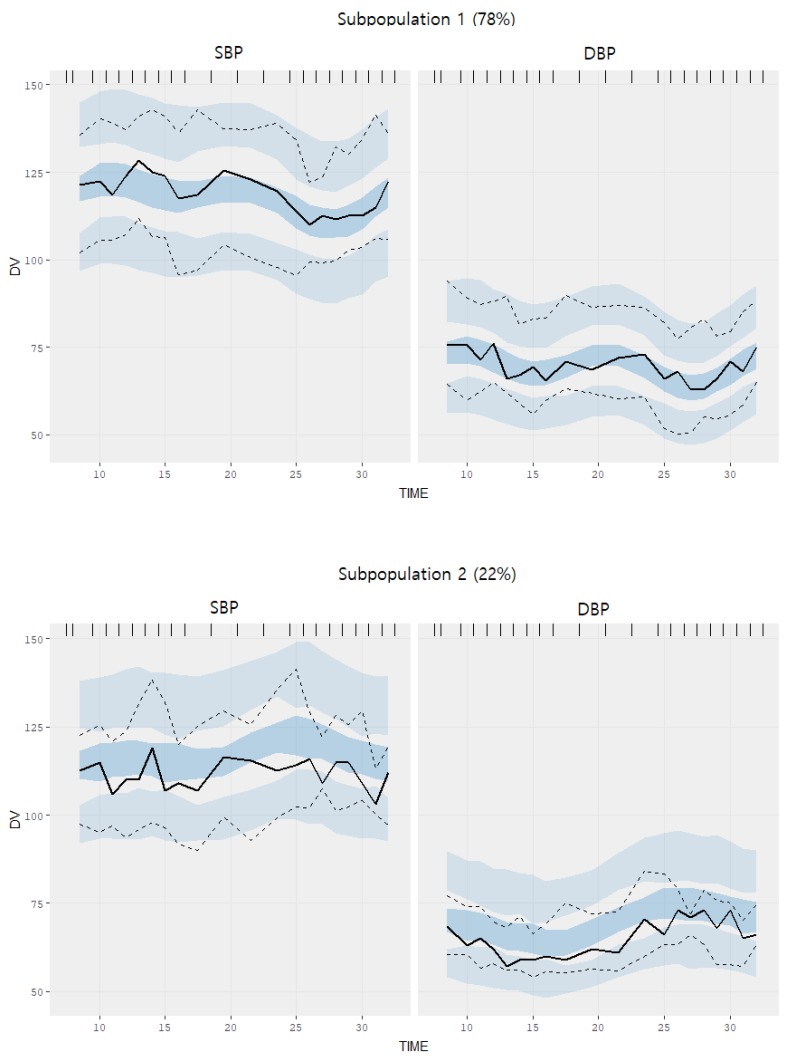
For model validation, VPC in Figure 6 suggests that predictions are generally in agreement with observations in the ‘dippers’ where most of the median observed values fall within the shaded areas depicting the 95% confidence intervals around the 5%, 50%, and 95% percentiles. Concordance between the predicted and the observed values are not as good in the ‘non-dippers’. Bootstrap was not carried out because the precisions of parameter estimates were reliable as judged by RSE, which was less than or about 30% in all cases, except for 46% of Amp12 for DBP in the non-dipper group.
Discussion
The mixture model identified subgroups exhibiting different circadian blood pressure profiles. The model estimation results showed that about 80% of the study participants followed a typical pattern reported in the literature. The remaining 20% showed patterns that were more consistent with a non-dipper phenotype and exhibited differences in the acrophases (24.7 vs. 27.3 h) associated with a 24 hours period oscillator. Such a phase difference inevitably leads to different circadian profiles between SBP and DBP (see Fig. 1) in non-dippers such that a tendency of rising SBP but falling DBP is seen in the morning.
An empirical method of using a linear combination of cosine basis functions to model circadian profiles of blood pressure has been widely used, producing generally consistent and reproducible results. Staesson et al.[10] suggested using 4 harmonic oscillators (cosine functions) based on the Fourier model but in many papers, only 2 to 3 have been used. This cosine functions based approach to model circadian profiles is becoming one of the standard methods in pharmacometrics,[81112] and our work followed this approach. Of course, this is by no means the only method and an alternative approach of using a feedback turnover model that mimics asymmetric circadian oscillations has been reported.[13]
The non-dipper phenotype is associated with several disease states including stroke and cardiovascular complications of essential hypertension, and in an early Lancet paper,[3] 102 (82.9%) out of 123 patients were classified as dippers while the remaining 21 (17.1%) as non-dippers. These values are similar to the proportions estimated from our data of healthy subjects, indicating that the non-dipper subgroup showing atypical circadian profiles of blood pressure can exist in a population of healthy individuals.
Predicting circadian blood pressure profiles is important in the assessment of the antihypertensive drug effect. It is known that different antihypertensive agents show a maximal effect at different times. For example, oxprenolol taken during the day reduces daytime blood pressure but is less effective during the night and early morning.[14] Other drugs such as labetalol, nifedipine, and verapamil are known to show a more pronounced effect in the morning when the risk of cerebrovascular events is highest.[1]
Two of the major limitations of our work are the small sample size and failure to include female subjects. The latter limitation, however, would not pose a major problem when it comes to clinical trials for incrementally modified drugs since only male subjects are recruited in general. Inconsistency in the methods of BP measurement where study subjects were required to sit in the daytime but were allowed to be recumbent in the night could have led to another potential bias in the parameter estimates.
Notwithstanding these limitations, our work is the first to analyze baseline circadian BP profiles in the Korean population-based non-linear mixed effects modeling methodology. The proportions of dippers and non-dippers and parameters related to the circadian profiles were successfully estimated. Our work is expected to serve as a useful reference in analyzing and interpreting data acquired from clinical trials assessing systematic intra-day blood pressure fluctuations and antihypertensive effects. It can also be applied to better assess drug safety of incrementally modified or generic drugs as measured by blood pressure change, which is currently in Korea assessed only based on the equivalence with the reference drug (so-called relative safety), not the placebo (so-called absolute safety).
 XML Download