Journal List > Transl Clin Pharmacol > v.26(4) > 1111909

Huh, Hwang, and Lee: Trends of clinical trials from 2014 to 2016 in South Korea

Abstract

Mandatory registration of clinical trials in public registry can ensure the transparency of clinical trials. Public clinical trial registry of can provide current chronological and geographical distribution of clinical trial throughout the country. We used public clinical trial registry provided by Ministry of Food and Drug Safety to analyze current status of clinical trial from 2014 to 2016 in South Korea. The number of clinical trials in antineoplastic and immunomodulating agents area was the greatest, followed by cardiovascular system and antiinfectives for systemic use as a whole. From 2014 to 2016, overall number of clinical trials decreased while the number of phase I clinical trials increased. Seoul accounted for more than half number of clinical trials in Korea. Supports for clinical trials in non-metropolitan area needs to be considered.

Introduction

Mandatory registration of clinical trials in public registry can ensure the transparency of clinical trials. Hopewell (2009) reported trials with positive findings were more likely to be published than those with negative findings with odds ratio of 3.90, while assessed time to publication was about two to three years shorter.[1] Selective publication of clinical trials results could lead to publication bias, undermining reliability of clinical trial results.
Validated public database can make it easier to summarize and analyze current status of clinical trials. The largest clinical trial registry, ClinicalTrials.gov, provides search engine service equipped of user-friendly features including spelling correction and relaxation, use of synonymy and relevancy ranking. [2] Growing number of researches have been conducted on ClinicalTrials.gov database, from systematic review of clinical trial results to the examination of selective publication of study results.[3]
Along with increase in registration of clinical trials, utilization of clinical trial registry data needs to be followed. South Korea reported more than 344% increase in number of registered clinical trials between 2007 and 2012.[4] Ministry of Food and Drug Safety (MFDS) in South Korea recently has been providing approval status of ongoing clinical trials. However, because database provided by MFDS is not classified by therapeutic area and province, utilization of public database is limited.
In this study, we tried to analyze the clinical trial status of South Korea by therapeutic area, study phase and province based on the MFDS public registry from 2014 to 2016.

Methods

Clinical trials listed in the MFDS clinical trial registry from January 1st, 2014 to December 31st, 2016 were included in the analysis.
Therapeutic areas were classified based on investigational product (IP) described in the study title by World Health Organization Anatomical Therapeutic Chemical (WHO-ATC) Classification System. If the IP code was not specified in the database, IP code was referred to ClinicalTrials.gov registry to classify therapeutic area. When reference was not found, the trial was counted as ‘Other’. When IPs of different therapeutic area co-existed in a clinical trial, therapeutic area was selected in terms of relative importance considering the number of drugs and study purpose.
Study phase of ‘0’, ‘1/2a’, ‘1/2’, ‘1’, ‘1/3’ was coded as phase 1;‘2/3’, ‘2a’, ‘2b’, ‘2’, ‘2b/3’ was coded as phase 2; ‘3a’, ‘3b’, ‘3’, ‘3/4’ was coded as phase 3; trials other than phase 1 to 4 and investigator-initiated trial were coded as ‘Other’.
Province was coded based on the study site. In case of multi-center trial, the participating center was counted individually to count the total number of clinical trials by province, whereas multi-center trial was counted once to count the number of clinical trials by therapeutic area and study phase. The total number of clinical trials was summarized using R version 3.4.3.

Results

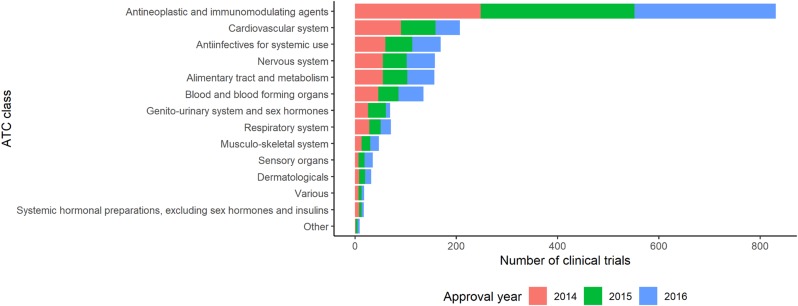
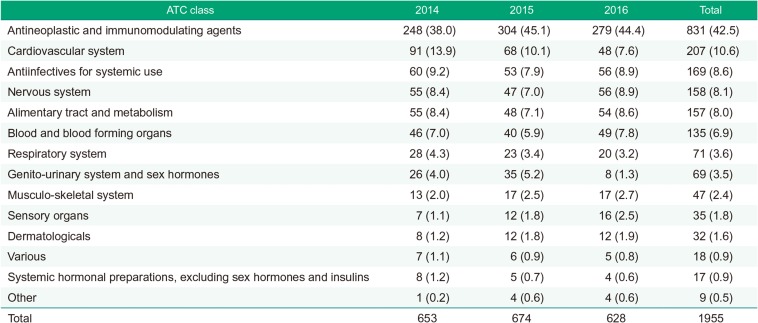
Summary of clinical trials by therapeutic area

The number of trials in Antineoplastic and immunomodulating agents area was the greatest during 2014–2016. The number of trials in Cardiovascular system area was the second largest during 2014 and 2015, but in 2016 Antiinfectives for systemic use and Nervous system were the common second place. The number of trials in Cardiovascular system area decreased continuously during 2014–2016, while that of Sensory organs area increased continuously. The number of trials in Genito-urinary system and sex hormones area peaked in 2015, followed 0.25-fold decrease in 2016 (Fig. 1, Table 1).

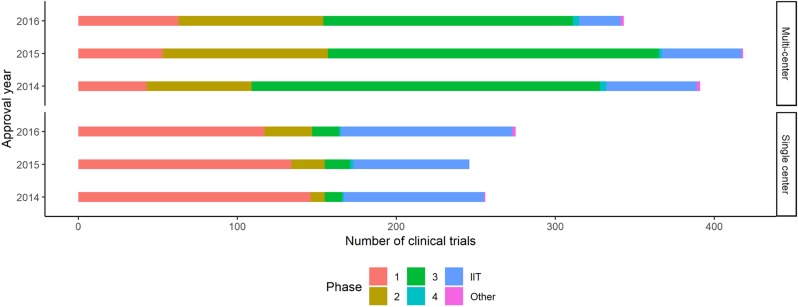
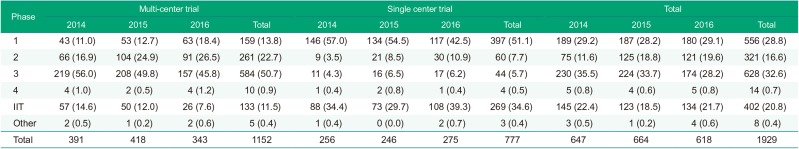
Summary of clinical trials by study phase

The total number of clinical trials was the greatest in 2015 and the least in 2016. The number of phase 3 clinical trials was decreased continuously while early phase trials (phase 1 and 2) increased. The number of multi-center early phase 1 clinical trials generally increased while that of multi-center phase 3 clinical trials decreased. The proportion of phase 3 clinical trials was the greatest in 2014 and 2015, while in 2016 that of phase 1 was the greatest. Investigator-initiated trials accounted for about one fifth of the total clinical trials in general (Fig. 2, Table 2).

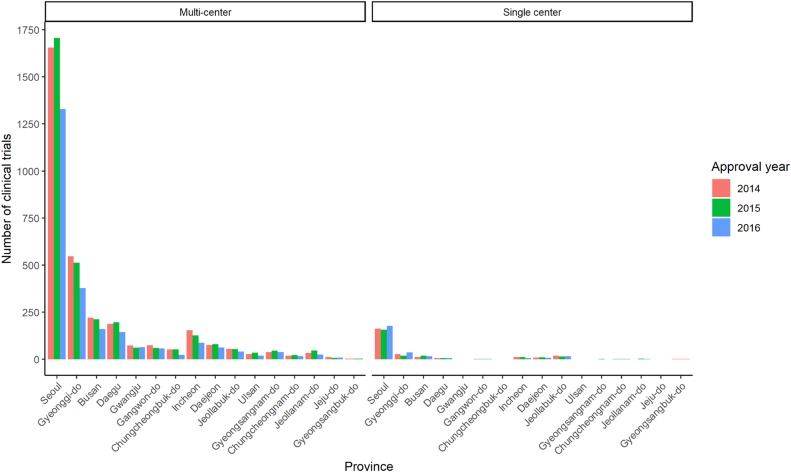
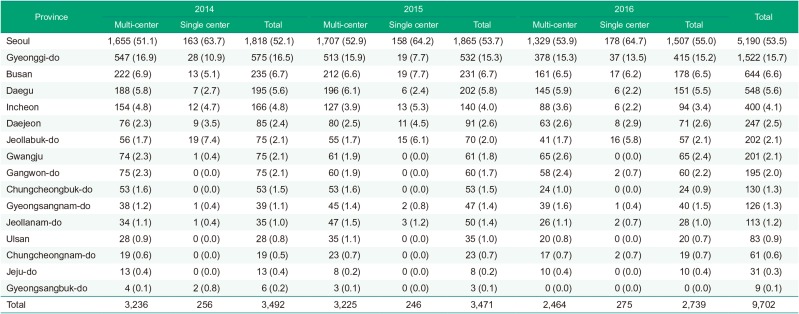
Summary of clinical trials by province

Seoul accounted for more than half of the entire clinical trial in all times and proportion increased annually. Proportion of Gyeonggi-do was the second greatest. The number of clinical trials in metropolitan area (Seoul, Gyeonggi-do and Incheon) accounted for about three fourths of the whole trials. Other than Seoul and Gyeonggi-do, Busan was the most frequently conducted province (Fig. 3, Table 3).

Discussion

According to ClinicalTrials.gov database, the number of clinical trial shrank about 30.1% in 2016 compared to the previous year. Although decrease in number of clinical trials in Korea was noted in the same period, the decrease was smaller than global shrinkage.
During the study period, marked increase in early phase clinical trials was noted. Due to aggravating productivity of drug development process, rapid decision based on early phase clinical trial has been emphasized.[5] Increase in early phase clinical trials in Korea is consistent with current drug development trends.
Our study revealed geographical inequalities in conduct of clinical trials. The proportion of Seoul was reported to increase continuously, in both multi-center and single center clinical trials, which lead to inefficient allocation of clinical trial resource. Considering the aspect of clinical trial to provide opportunity for access to novel therapeutics, conduct of clinical trials in nonmetropolitan areas need to be supported.
Our study had some limitations. Because some drugs under development were not assigned ATC code yet, classification of therapeutic area needed to be extrapolated based on mechanism of action and indication. Furthermore, allocation of therapeutic area in clinical trials of multiple therapeutic area, for example, drug interaction studies with oral hypoglycemic drugs and antihypertensive drugs, had subjective feature, which could lead to different results. Nevertheless, overall trend in therapeutic area was not significantly affected by the ambiguity.

Acknowledgments

None.

Notes

Reviewer: This article reviewed by peer experts who are not TCP editors.

Conflict of interest: - Authors: Nothing to declare

- Reviewers: Nothing to declare

- Editors: Nothing to declare

References

1. Hopewell S, Loudon K, Clarke MJ, Oxman AD, Dickersin K. Publication bias in clinical trials due to significance of trial results. Cochrane Database Syst Rev. 2009; MR000006. DOI: 10.1002/14651858.MR000006.pub3. PMID: 19160345.
2. Zarin DA, Ide NC, Tse T, Harlan WR, West JC, Lindberg DA. Issues in the registration of clinical trials. JAMA. 2007; 297:2112–2120. PMID: 17507347.
crossref
3. Zarin DA, Tse T, Williams RJ, Califf RM, Ide NC. The ClinicalTrials.gov results database-update and key issues. N Engl J Med. 2011; 364:852–860. PMID: 21366476.
4. Viergever RF, Li K. Trends in global clinical trial registration: an analysis of numbers of registered clinical trials in different parts of the world from 2004 to 2013. BMJ Open. 2015; 5:e008932. DOI: 10.1136/bmjopen-2015-008932.
crossref
5. Paul SM, Mytelka DS, Dunwiddie CT, Persinger CC, Munos BH, Lindborg SR, et al. How to improve R&D productivity: the pharmaceutical industry’s grand challenge. Nat Rev Drug Discov. 2010; 9:203–214. DOI: 10.1038/nrd3078. PMID: 20168317.
Figure 1

Trends in clinical trials during 2014–2016 by therapeutic area (ATC class).

tcp-26-172-g001
Figure 2

Trends in clinical trials during 2014–2016 by study phase. IIT refers to investigator-initiated trial.

tcp-26-172-g002
Figure 3

Trends in clinical trials during 2014–2016 by province.

tcp-26-172-g003
Table 1

Total number of clinical trials during 2014–2016 by therapeutic area

tcp-26-172-i001
ATC class 2014 2015 2016 Total
Antineoplastic and immunomodulating agents 248 (38.0) 304 (45.1) 279 (44.4) 831 (42.5)
Cardiovascular system 91 (13.9) 68 (10.1) 48 (7.6) 207 (10.6)
Antiinfectives for systemic use 60 (9.2) 53 (7.9) 56 (8.9) 169 (8.6)
Nervous system 55 (8.4) 47 (7.0) 56 (8.9) 158 (8.1)
Alimentary tract and metabolism 55 (8.4) 48 (7.1) 54 (8.6) 157 (8.0)
Blood and blood forming organs 46 (7.0) 40 (5.9) 49 (7.8) 135 (6.9)
Respiratory system 28 (4.3) 23 (3.4) 20 (3.2) 71 (3.6)
Genito-urinary system and sex hormones 26 (4.0) 35 (5.2) 8 (1.3) 69 (3.5)
Musculo-skeletal system 13 (2.0) 17 (2.5) 17 (2.7) 47 (2.4)
Sensory organs 7 (1.1) 12 (1.8) 16 (2.5) 35 (1.8)
Dermatologicals 8 (1.2) 12 (1.8) 12 (1.9) 32 (1.6)
Various 7 (1.1) 6 (0.9) 5 (0.8) 18 (0.9)
Systemic hormonal preparations, excluding sex hormones and insulins 8 (1.2) 5 (0.7) 4 (0.6) 17 (0.9)
Other 1 (0.2) 4 (0.6) 4 (0.6) 9 (0.5)
Total 653 674 628 1955

Note: Results were displayed as the number of clinical trials (percentage).

Table 2

Number of clinical trials during 2014–2016 by study phase and the number of participating centers

tcp-26-172-i002
Phase Multi-center trial Single center trial Total
2014 2015 2016 Total 2014 2015 2016 Total 2014 2015 2016 Total
1 43 (11.0) 53 (12.7) 63 (18.4) 159 (13.8) 146 (57.0) 134 (54.5) 117 (42.5) 397 (51.1) 189 (29.2) 187 (28.2) 180 (29.1) 556 (28.8)
2 66 (16.9) 104 (24.9) 91 (26.5) 261 (22.7) 9 (3.5) 21 (8.5) 30 (10.9) 60 (7.7) 75 (11.6) 125 (18.8) 121 (19.6) 321 (16.6)
3 219 (56.0) 208 (49.8) 157 (45.8) 584 (50.7) 11 (4.3) 16 (6.5) 17 (6.2) 44 (5.7) 230 (35.5) 224 (33.7) 174 (28.2) 628 (32.6)
4 4 (1.0) 2 (0.5) 4 (1.2) 10 (0.9) 1 (0.4) 2 (0.8) 1 (0.4) 4 (0.5) 5 (0.8) 4 (0.6) 5 (0.8) 14 (0.7)
IIT 57 (14.6) 50 (12.0) 26 (7.6) 133 (11.5) 88 (34.4) 73 (29.7) 108 (39.3) 269 (34.6) 145 (22.4) 123 (18.5) 134 (21.7) 402 (20.8)
Other 2 (0.5) 1 (0.2) 2 (0.6) 5 (0.4) 1 (0.4) 0 (0.0) 2 (0.7) 3 (0.4) 3 (0.5) 1 (0.2) 4 (0.6) 8 (0.4)
Total 391 418 343 1152 256 246 275 777 647 664 618 1929

Note: Results were displayed as the number of clinical trials (percentage). Clinical trials without information of participating centers were omitted.

Table 3

Number of clinical trials during 2014–2016 by province and the number of participating centers

tcp-26-172-i003
Province 2014 2015 2016 Total
Multi-center Single center Total Multi-center Single center Total Multi-center Single center Total
Seoul 1,655 (51.1) 163 (63.7) 1,818 (52.1) 1,707 (52.9) 158 (64.2) 1,865 (53.7) 1,329 (53.9) 178 (64.7) 1,507 (55.0) 5,190 (53.5)
Gyeonggi-do 547 (16.9) 28 (10.9) 575 (16.5) 513 (15.9) 19 (7.7) 532 (15.3) 378 (15.3) 37 (13.5) 415 (15.2) 1,522 (15.7)
Busan 222 (6.9) 13 (5.1) 235 (6.7) 212 (6.6) 19 (7.7) 231 (6.7) 161 (6.5) 17 (6.2) 178 (6.5) 644 (6.6)
Daegu 188 (5.8) 7 (2.7) 195 (5.6) 196 (6.1) 6 (2.4) 202 (5.8) 145 (5.9) 6 (2.2) 151 (5.5) 548 (5.6)
Incheon 154 (4.8) 12 (4.7) 166 (4.8) 127 (3.9) 13 (5.3) 140 (4.0) 88 (3.6) 6 (2.2) 94 (3.4) 400 (4.1)
Daejeon 76 (2.3) 9 (3.5) 85 (2.4) 80 (2.5) 11 (4.5) 91 (2.6) 63 (2.6) 8 (2.9) 71 (2.6) 247 (2.5)
Jeollabuk-do 56 (1.7) 19 (7.4) 75 (2.1) 55 (1.7) 15 (6.1) 70 (2.0) 41 (1.7) 16 (5.8) 57 (2.1) 202 (2.1)
Gwangju 74 (2.3) 1 (0.4) 75 (2.1) 61 (1.9) 0 (0.0) 61 (1.8) 65 (2.6) 0 (0.0) 65 (2.4) 201 (2.1)
Gangwon-do 75 (2.3) 0 (0.0) 75 (2.1) 60 (1.9) 0 (0.0) 60 (1.7) 58 (2.4) 2 (0.7) 60 (2.2) 195 (2.0)
Chungcheongbuk-do 53 (1.6) 0 (0.0) 53 (1.5) 53 (1.6) 0 (0.0) 53 (1.5) 24 (1.0) 0 (0.0) 24 (0.9) 130 (1.3)
Gyeongsangnam-do 38 (1.2) 1 (0.4) 39 (1.1) 45 (1.4) 2 (0.8) 47 (1.4) 39 (1.6) 1 (0.4) 40 (1.5) 126 (1.3)
Jeollanam-do 34 (1.1) 1 (0.4) 35 (1.0) 47 (1.5) 3 (1.2) 50 (1.4) 26 (1.1) 2 (0.7) 28 (1.0) 113 (1.2)
Ulsan 28 (0.9) 0 (0.0) 28 (0.8) 35 (1.1) 0 (0.0) 35 (1.0) 20 (0.8) 0 (0.0) 20 (0.7) 83 (0.9)
Chungcheongnam-do 19 (0.6) 0 (0.0) 19 (0.5) 23 (0.7) 0 (0.0) 23 (0.7) 17 (0.7) 2 (0.7) 19 (0.7) 61 (0.6)
Jeju-do 13 (0.4) 0 (0.0) 13 (0.4) 8 (0.2) 0 (0.0) 8 (0.2) 10 (0.4) 0 (0.0) 10 (0.4) 31 (0.3)
Gyeongsangbuk-do 4 (0.1) 2 (0.8) 6 (0.2) 3 (0.1) 0 (0.0) 3 (0.1) 0 (0.0) 0 (0.0) 0 (0.0) 9 (0.1)
Total 3,236 256 3,492 3,225 246 3,471 2,464 275 2,739 9,702

Note: Results were displayed as the number of clinical trials (percentage). Clinical trials without information of participating centers were omitted.

TOOLS
Similar articles