

 PDF
PDF ePub
ePub Citation
 Print
Print


Introduction
Cilostazol is indicated for the treatment of intermittent claudication, ulceration, and pain.[123] It is also used for the treatment of intracranial atherosclerosis and to prevent cardioembolic stroke in patients undergoing antiplatelet therapy.[4]
Cilostazol increases cAMP by inhibiting phosphodiesterase. Accordingly, it increases the active form of protein kinase A (PKA) and finally inhibits platelet aggregation. Moreover, it increases nitric oxide synthesis in vascular smooth muscle cells and causes vasodilation.[5]
The pharmacokinetics (PK) of cilostazol is generally well known and its PK after oral administration has been reported to follow a two-compartment model with first order absorption and elimination.[678] It is known that the plasma concentration of cilostazol reaches steady state in 4 days.[9] The half-life of cilostazol is governed by “flip-flop” kinetics with the absorption rate constant slower than the elimination rate constant.[910] Cilostazol is extensively bound primarily to albumin.[9] Food significantly increases the bioavailability of cilostazol[10] but age and gender have no effect on cilostazol PK.[89]
Cilostazol was reported to exhibit diurnal variation, which is characterized by the peak concentration that is higher after the morning dose than after the evening dose.[810] and the trough concentration that is higher before the morning dose than before the evening dose.[8910]
The pharmacodynamics (PD) of cilostazol in Korean populations has been assessed by the inhibition of platelet aggregation,[1112] which is based on Light Transmittance Aggregometry (LTA). Although LTA has been considered to be the gold standard assay for the assessment of platelet functions, it has problems such that the technique is affected by pre-analytical and procedural conditions and highly skillful and experienced laboratory staff is needed.[13] On the other hand, Platelet Function Analyzer (PFA-100), which was introduced in 1994 and used closure time (CT) as a PD marker,[14] has been increasingly used due to assay results compatible with LTA and additional benefits.[13] One of the benefits is that PFA can be used as a screening tool for existing tests and has a highly negative predictive value; when the CT result is normal in a suspected platelet disease, a further platelet function test does not need to be performed. However, no work has been reported on cilostazol's effect on CT in a Korean population.
In the present study, using CT as a PD endpoint, we aimed to develop a population PD model of cilostazol to investigate characteristics and factors influencing cilostazol's CT prolongation effects in a Korean population.
Methods
Study design and data
CT data used for PD analysis of cilostazol in this work were obtained from a previous study conducted in healthy volunteers in 2009 at Severance Hospital to compare PK and PD of a test drug of cilostazol slow-release formulation (PP-101; Pacificpharma Corporation, Seoul, Korea) with a reference drug of cilostazol immediate-release formulation (Pletal; Otsuka Pharmaceutical Co, Ltd, Tokyo, Japan).[10] Note, however, that, in the cited work, only PK was reported as PD was not the main objective of the study.
In that study, 40 subjects received 200 mg of test drug orally once a day and 100 mg of reference drug orally twice a day for 8 consecutive days in a crossover fashion. After first dosing on Day 8, blood samples were collected at 0 (predose), 1, 2, 3, 4, 6, 8, 10, 12, 13, 14, 15, 16, 18, 20, 22, 24, 36, 48, and 72 hours for PK. In the case of PD, blood samples were collected at 0 hour (baseline) on Day 1 and 0 (predose), 3, 6, 8, 10, 12, 15, 18, 20, 22, 24, 36, 48 and 72 hours after first dosing on Day 8. Among the 40 subjects who participated in the study, 29 completed sampling, and their PD data up to 24 hours for the reference drug was used in this analysis.
Bioanalysis
Blood samples for CT analysis were collected into 3.2% (0.105 M) sodium citrate tubes. Blood volume per sample was 3mL, except for 3, 6, 8, 15, 18, 20 hours where 6mL per sample was collected. The reason was that the maximum CT was expected to occur at one of these sampling times and it was necessary to collect the larger volume per sample to avoid possible hemolysis or partial coagulation.
PFA is composed of a capillary tube, a sample repository, and a membrane coated with epinephrine and collagen for platelets to contact, and the analysis is based on platelets property to adhere upon shear stress conditions and aggregate as a result of agonists present in the system.[1314] When the blood sample mixed with an anticoagulant is drawn through the capillary tube, platelets are rapidly exposed and contact the membrane, resulting in platelet activation. While the blood sample is aspired through an aperture in the membrane, platelets adhere to the circumference, which continues until a stable plug forms and occlude the aperture. CT is obtained as the time taken for the blood sample to stop passing through the membrane aperture.
PK model
The PK model used in this study was adopted from the previous work,[8] which is a two-compartment model with first order absorption for parent drug linked with a two-compartment model for its metabolite (OPC-13015), where the absorption rate constant was influenced by diurnal and seasonable variations and systemic clearance by seasonal variation. Details of the model are found in the cited work.
PD model
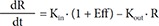
The initial examination of cilostazol data for PK-PD relationships revealed a time delay between concentration and effect profiles as shown in Figure 1. To describe a time delay between PK and PD, firstly, an effect compartment model was attempted as follows:
In Eq. (1), C is the plasma concentration, and Ce the effect compartment concentration. The relation between drug effects and drug concentrations was then investigated using linear (Eq. (2)), log-linear (Eq. (3)), Emax (Eq. (4)) and sigmoid Emax models (Eq. (5)) as follows:


In Eq. (2)–(5), Eff is the drug effect, S a scale factor for the drug effect, Emax the maximum drug effect, EC50 the Ce at 50% of Emax and γ the Hill coefficient for sigmoidicity. Then, the drug effect was related to the closure time (CT) as follows:

In Eq. (6), R is the CT, and BASE the baseline R at 0 hour on Day 1.
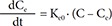
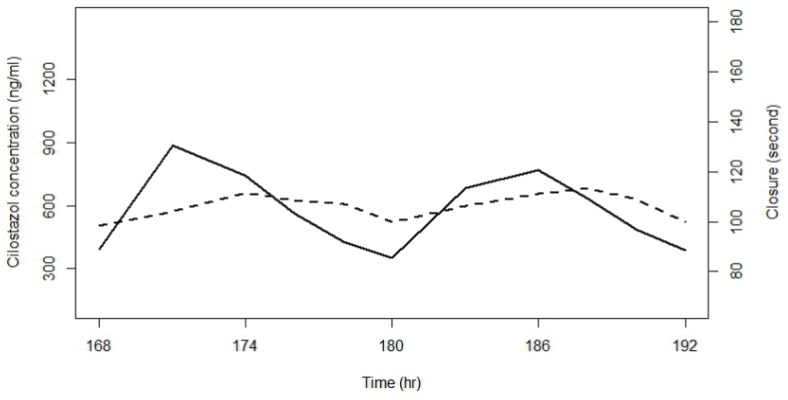
Also, to describe a time delay, a turnover model[1516] was attempted as follows, either as stimulating the production (Eq. (7)) or as inhibiting the loss (Eq. (8)):
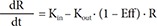

In Eq. (7)–(9), Kin is the turnover rate and Kout the fractional turnover rate constant, R the CT, BASE the baseline R, and Eff the drug effect, which was modeled using linear, log-linear, Emax, and sigmoid Emax models defined in Eq. (2)–(5), with Ce replaced by C.
The inter-individual variability of PD parameters was modeled using an exponential error model and the residual variability using a proportional error model.
Covariate analysis
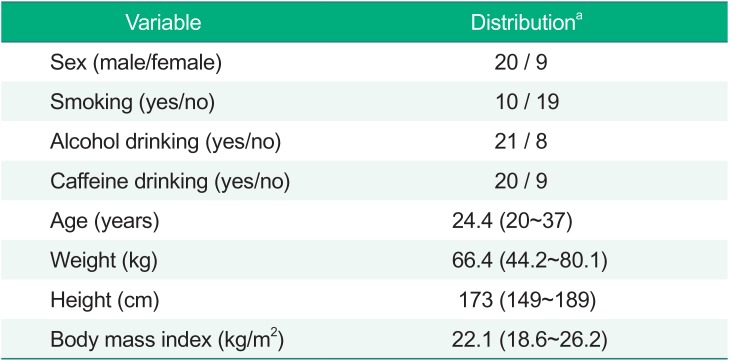
After the basic PD model was chosen, the covariate screening was performed using visual exploration (parameter covariate scatterplots) and GAM (generalized additive modeling) implemented in Xpose (version 4.5.3). Continuous covariates were centered to median values and were examined using linear, power, and exponential functions. The covariates tested included all factors reported in Table 1, including sex, age, weight (WT), height (HT), body mass index (BMI), smoking status (SMK), alcohol drinking status (ALC), and caffeine drinking status (CAF). Covariate selection was performed using stepwise covariate modeling with significance levels of P < 0.05 (ΔOFV>3.84, Δdf=1) for forward addition and P < 0.01 (ΔOFV>6.63, Δdf=1) for backward deletion.
Model evaluation
The model was diagnosed based on criteria including an objective function value (OFV) for nested models, Akaike's Information Criterion (AIC) for un-nested models, parameter precision, goodness of fit plots, and physiologic plausibility. The final PD model was then evaluated based on the visual predictive check (VPC) by comparing 5th, median, and 95th percentiles of observations with those of prediction percentiles for 1000 simulated datasets.
Results
Among several models attempted, best 3 models based on OFV(AIC) were a turnover model with the fractional turnover rate constant inhibited by a sigmoid Emax model (Eq. (5) and (8)), a turnover model with the turnover rate stimulated by a sigmoid Emax model (Eq. (5) and (7)), and a sigmoid Emax model with a time delay described by an effect compartment model (Eq. (1) and (5)), which yielded OFV(AIC) of 2128.47(2142.47), 2128.94(2142.94), and 2130.89(2144.89), respectively. As a result, a turnover model with the fractional turnover rate constant inhibited by a sigmoid Emax model (Eq. (5) and (8)) was selected as the basic PD model. The inter-individual variances of Kout, Emax and EC50 were estimated to be not significantly different from 0. Accordingly, they were fixed to 0.
For covariate modeling, sex and CAF were added in forward addition and were not deleted in backward deletion, thereby being selected as the covariates (p<0.01).
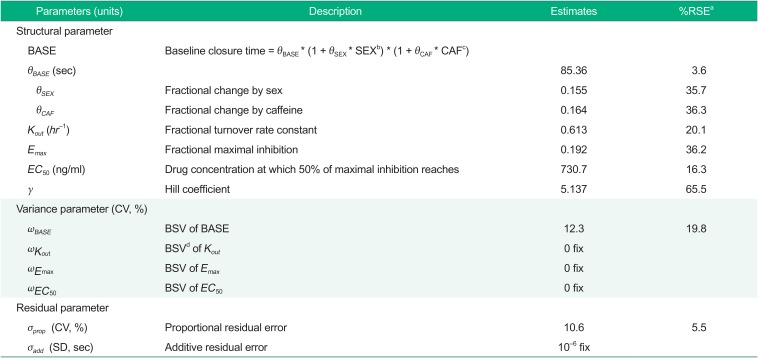
Parameter estimates of the final model thus obtained were 85.36 seconds for BASE in male non-caffeine drinkers, 0.155 for a fractional increase in BASE in females, 0.164 for a fractional increase in BASE in caffeine drinkers, 0.613 hr−1 for Kout, 0.192 for Emax, 731 ng/ml for EC50 and 5.137 for γ. Parameter estimates of the final PD model are shown in Table 2.
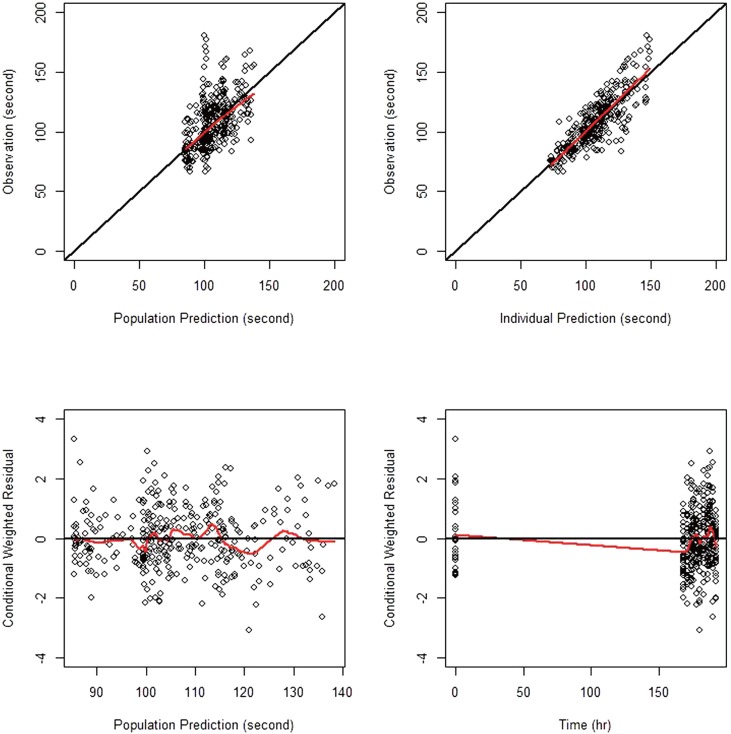
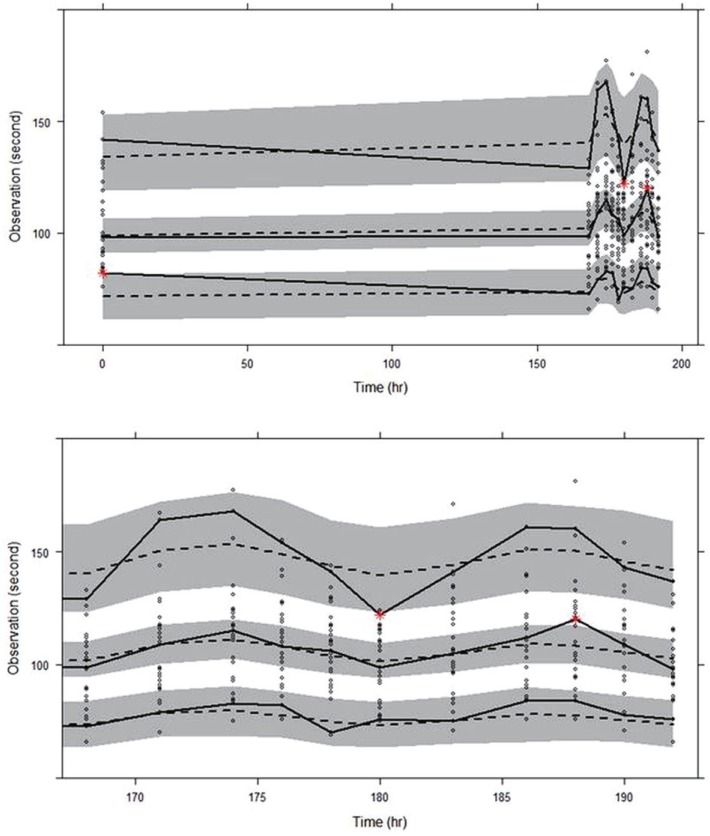
The goodness-of-fit plots for the final model are shown in Figure 2, indicating no noticeable trend, except for the overestimation near 168 hr seen in the conditional weighted residual (CWRES) versus time plot. The VPC for model performance on Day 8 shown in the lower panel of Figure 3 indicates that the model prediction generally agreed well with observation.
Discussion
This study aimed to develop a population PD model for cilostazol's CT prolongation effect based on a PK model developed in a previous study. A turnover model with Kout inhibited by cilostazol drug effect, which was described as a sigmoid Emax model, best described the data. As measured by RSE, the parameter precision of the final model was reasonable, with the largest RSE being 65.6% for γ (Table 2), which is usually difficult to precisely estimate. Although Emax model is often used for describing drug effects, it was not significantly better than linear and log-linear models (data not shown). When we tried Emax models, correlation coefficient between Emax and EC50 was close to 1 or values of Emax and EC50 were very large. On the other hand, when we tried sigmoid Emax models, the OFV significantly decreased and all parameters were well estimated.
For model parameter estimates, BASE was within the normal range of CT, which was reported to be about 60~100 sec.[1718] Emax was estimated to be 0.192, which means that CT can increase by 1.238 times the baseline at the maximum. EC50 was estimated to be 730 ng/ml, which was within the concentration range predicted by the PK model.[8] γ was estimated to be as large as 5.137, which means a sudden increase in drug effect near EC50 and a concentration-response relationship close to all-or-nothing effect.[16] However, as seen from the high RSE value of 65.6%, the precise estimation of the Hill coefficient is difficult and the result should be interpreted with a caution.
For covariate analyses, we found that caffeine ingestion and sex were significant covariates in BASE, producing a 16.4% and a 15.5% increase in BASE, respectively (Table 2), indicating that the baseline closure time in caffeine drinkers is 1.164 times longer than in non-caffeine drinkers and that in females is 1.155 times longer than in males. This result was consistent with previous reports; caffeine inhibited platelet aggregation by up-regulating adenosine A2A receptor,[19] and chronic coffee drinking decreased platelet aggregation.[20] For the influence of sex, previous studies in Caucasians reported that baseline platelet aggregation in females was higher than that in males,[212223] whereas in a study conducted in a healthy Korean population CTs were reported to be significantly longer in females.[17] Although one possible reason for this inconsistency would be a race difference (Caucasian versus Asian), more studies will be needed to better understand the influence of sex on CT.
In our study, age was not a significant covariate. However, in the healthy population study, CTs were reported to be significantly affected by age (<40 years versus >40 years), which was contrary to our result.[17] The reason for the discrepancy in the effect of age is conjectured to be that the entire age range of adults were used in the cited work, whereas only young adults were used in our work.
For the goodness-of-fit plots reported in Figure 2, the overestimation near 168 hr was seen in the CWRES versus time plot. This overestimation was conjectured to be caused by CT values at 168 hr, which, on the contrary to the expected drug effect of cilostazol, were observed lower than those at the baseline, as can be seen in the upper panel of Figure 3. One potential reason for such drop in CT values at 168 hr could be so-called admission effect, which arises from a psychological effect associated with hospital admission. We observed the similar phenomenon in a repeated-dose study of telmisartan, where blood pressure was elevated and pulse rate was depressed when observed immediately after patient admittance into clinical trial center.[24] However, other possible reasons also need to be investigated.
There are some limitations with the final PD model. For example, the study population consisting of a limited number of subjects was not diverse enough, not including the whole age group, and the estimation precision of some model parameter was low.
Despite the above-mentioned limitations, this work is the first population PD study of cilostazol in a Korean population. A study with more subjects would help acquire more reliable CT characteristics of cilostazol.
 XML Download