

 PDF
PDF ePub
ePub Citation
 Print
Print


Introduction
Metformin is an oral hypoglycemic agent belonging to biguanide class and is one of the most widely used treatments for type 2 diabetes mellitus (T2DM).[1] It is a strong hydrophilic base that exists largely in its cationic form at physiological pH; thus, passive diffusion of metformin through the cell membrane is limited. Metformin shows saturable oral bioavailability and primarily undergoes renal elimination.[2] Various drug transporters such as organic cation transporters (OCTs), multidrug and toxin extrusion transporter (MATE), and plasma membrane monoamine transporter (PMAT) have been implicated in metformin disposition.[3]
The associations between the genetic variants of these transporters and metformin's clinical pharmacokinetics or efficacy have been investigated in many previous studies. OCT2, MATE1, and MATE2-K play important roles in renal elimination of metformin.[2456] A single nucleotide polymorphism (SNP) in OCT2 (rs316019) is associated with reduced renal and secretory clearance of metformin.[578] Associations between metformin pharmacokinetics and an intronic variant of MATE1 (rs2289669) and promotor variants of MATE-2K (rs34834489, rs12943590) have also been reported in several previous studies.[6910]
The role of PMAT in metformin disposition and efficacy has recently drawn attention. PMAT is localized in the luminal side of enterocytes of the small intestine and renal tubule and likely plays a role in metformin's oral absorption or renal tubular reabsorption.[1112] In a previous pharmacogenomics study, five SNPs in PMAT (i.e., rs2685753, rs3889348, rs4720572, rs4299914, and rs6971788) showed no significant associations with the steady-state metformin concentration in Danish T2DM patients.[13] The minor allele frequencies of these variants were not rare in Danish patients (23.5%, 31.4%, 31.9%, 49.7%, and 20.8%, respectively). However, the variants were in the non-coding region of PMAT gene and the study results have not been reproduced in human studies.
In this study, we aimed to evaluate the role of PMAT genetic variations in the pharmacokinetic characteristics of metformin in a Korean population.
Methods
Study design and subjects
Pharmacokinetic data from subjects who participated in 4 previous metformin pharmacokinetic studies (studies 1–4) were retrospectively analyzed in this study. In each metformin pharmacokinetic study, written informed consent for participation was obtained from all participants before study enrollment, and healthy subjects evaluated by physical examinations and laboratory tests were enrolled in the studies. The subjects were administered two oral doses of metformin (Diabex Tab; Daewoong Pharmaceutical Co., Seoul, Korea) at a 12-hours interval. For subjects who participated in studies 1 and 2, the first dose (metformin 1,000 mg) was administered in the evening on the admission day, while the second dose (metformin 750 mg) was administered the following morning (Day 1). For subjects who participated in studies 3 and 4, the first and second doses administered were 750 and 500 mg, respectively, in the evening and next morning. Serial blood and timed urine samples were collected up to 12 hours after the second dose to evaluate the pharmacokinetics of metformin.
Determination of metformin concentrations
Metformin concentrations in the plasma and urine were determined by the highly specific and sensitive method of liquid chromatography–tandem mass spectrometry (Agilent 1260 HPLC system and Agilent 6490 Triple Quadrupole; Agilent Technologies, Santa Clara, CA, USA) in all 4 studies. To prepare the samples for analysis, an aliquot of the plasma or urine specimen was mixed with acetonitrile in the presence or absence of the internal standard (phenformin; Sigma-Aldrich, St. Louis, MO, USA). The mixture was vortexed for 5 min and then centrifuged for 5 min at 10,000 rpm. An aliquot of the supernatant was transferred to an autosampler vial, and 1 µL was injected into the column (Kinetex HILIC, 50 × 2.1 mm, 5 µm; Phenomenex, Torrance, CA, USA) at 10℃. The mobile phase consisted of 100% acetonitrile and 5 mM ammonium formate. Detection of the precursor to product ion transition was achieved by electrospray ionization in positive ion mode along with multiple reaction monitoring. The precursor-to-product ion pairs at the mass-to-charge ratio (m/z) were 130.1–71.1 for metformin and 206.2–60.1 for phenformin. The calibration curves were linear over the range of 10–5,000 µg/L for the plasma samples and 100–25,000 µg/L for the urine samples.
Genotyping of PMAT, OCT2, MATE1, and MATE2-K
Five SNPs in PMAT (c.883-522A>G, rs2685753; c.883-144A>G, rs3889348; c.1450+1047T>C, rs4720572; c.1451-858A>G, rs4299914; c.*313T>A, rs6971788) were genotyped, as they were found to be associated with metformin concentration in a previous study.[13] Furthermore, an SNP in OCT2 (c.808G>T, rs316019) and 3 SNPs in MATE1 and MATE2-K (c.922-158G>A, rs2289669; c.-396C>T, rs34834489; c.-130C>T, rs12943590) were genotyped to confirm the reliability of this study, as these variants are well-known to affect metformin's renal elimination. Genotyping analysis was conducted by the PharmacoGenomics Research Center (Inje University College of Medicine, Busan, Korea). Genomic DNA was extracted from peripheral whole blood and used to genotype the above-mentioned SNPs using an ABI PRISM® genetic analyzer and its GeneMapper® software according to the protocol of the SNaPshot® Multiplex kit from Applied Biosystems (Foster City, CA, USA).
Pharmacokinetic data analysis
Pharmacokinetic parameters were calculated by non-compartmental analysis using Phoenix® WinNonlin® software version 1.3 (Certara, St. Louis, MO, USA). The areas under the plasma metformin concentration-time curves from 0 to the last observed plasma concentration (AUC0-last) were calculated by the linear up, log down trapezoidal method. Renal clearance (CLR) of metformin was calculated as the total amount of metformin excreted through the urine during the 12-hour period divided by the AUC0-last and administered dose of metformin. The maximum plasma concentration of metformin (Cmax) was directly read from the concentration-time data.
Statistical analysis
All individual pharmacokinetic parameters were presented as the arithmetic mean and standard deviation. Kruskal-Wallis tests were used to compare pharmacokinetic parameters between the genotype groups. Statistical significance was determined when the P-value was less than 0.05. Statistical analyses were performed using SAS software, version 9.3 (SAS Institute, Inc., Cary, NC, USA).
Results
Frequency of the five SNPs in PMAT in Koreans
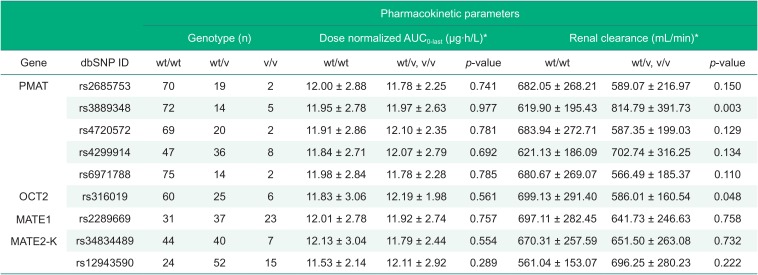
A total of 91 Korean subjects were genotyped, and the minor allele frequency of the five SNPs in PMAT was 12.6%, 13.2%, 13.2%, 28.6%, and 9.9% for rs2685753, rs3889348, rs4720572, rs4299914, and rs6971788, respectively (Table 1). The minor allele frequencies observed in this study were lower than those in dbSNP (22.0%, 26.1%, 22.0%, 40.4%, and 15.5%, respectively; http://www.ncbi.nlm.nih.gov/SNP) or in a previous study performed in Danish populations.[13]
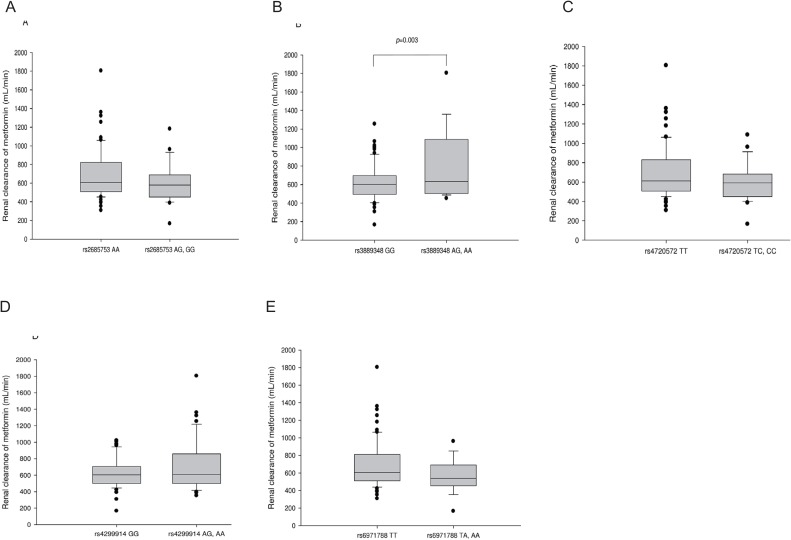
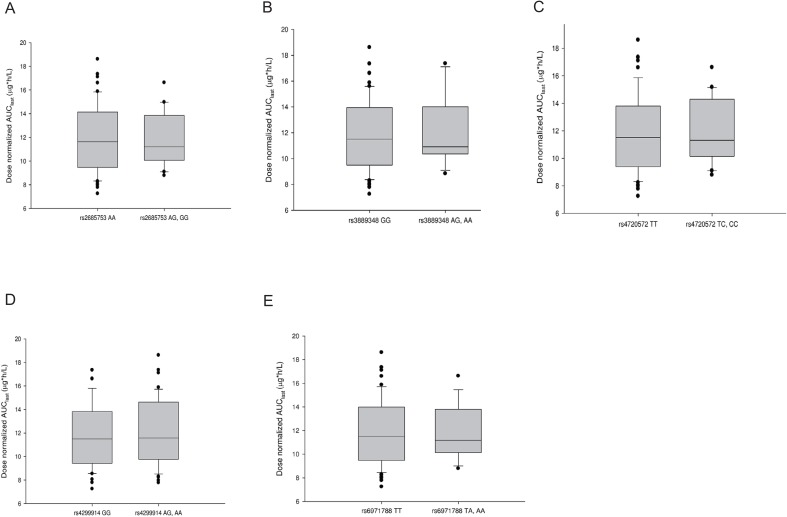
Effect of five SNPs in PMAT on the pharmacokinetics of metformin
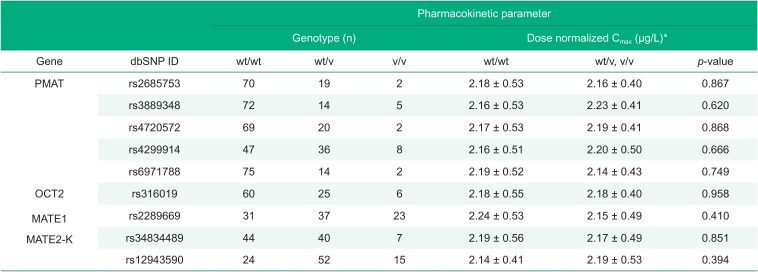
Subjects with more than one allele of c.883-144A>G SNP in PMAT (rs3889348) showed increased renal clearance of metformin compared to wild-type subjects (814.79 ± 391.73 vs. 619.90 ± 195.43 mL/min, respectively; Fig. 1 and Table 1). However, for all five PMAT SNPs investigated in this study, the dose-adjusted AUC0-last was not significantly different between the variant subjects and wild-type subjects (Fig. 2 and Table 1). None of the five PMAT SNPs affected the Cmax of metformin (Table 2). Demographic characteristics such as age, height, and weight did not differ between PMAT rs3889348 variant subjects and wildtype subjects (data not shown, p = 0.374, p = 0.619, p = 0.506 for age, height, and weight, respectively).
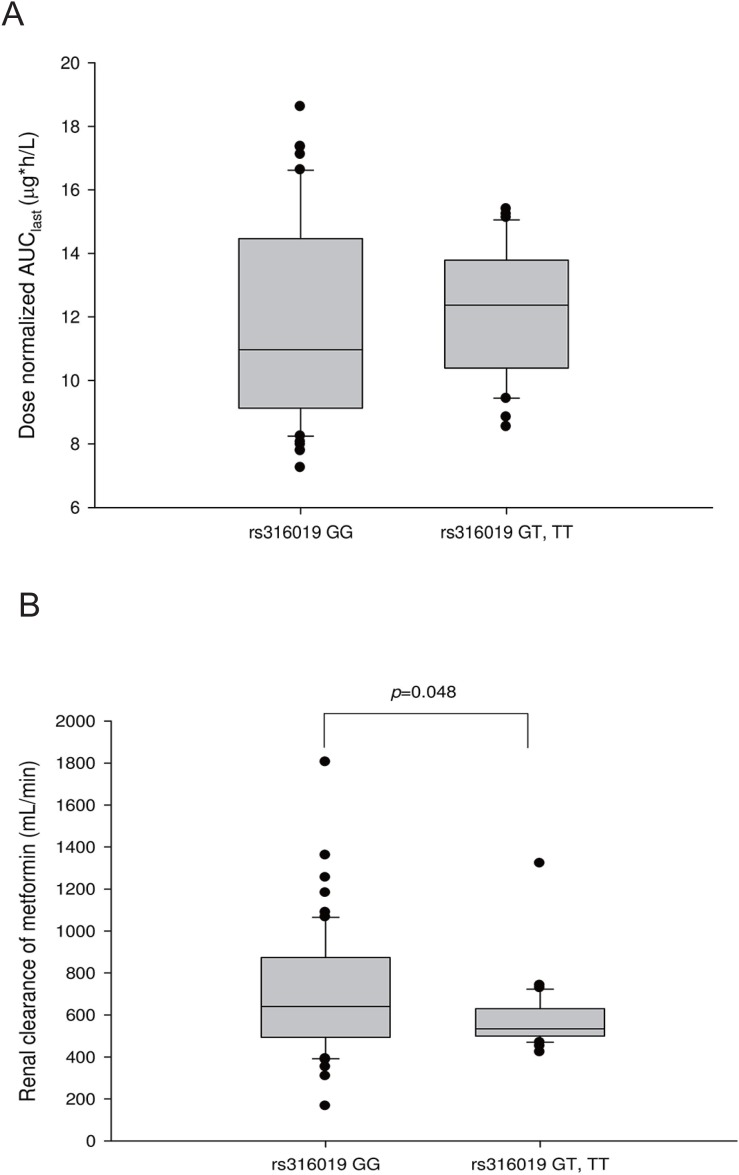
Effect of OCT2, MATE1, and MATE2-K SNPs on the pharmacokinetics of metformin
Subjects with more than one allele of c.808G>T SNP in OCT2 (rs316019) showed decreased renal clearance of metformin compared to wild-type subjects (586.01 ± 160.54 vs. 699.13 ± 291.40 mL/min, respectively; Fig. 3 and Table 1). For the 3 SNPs in MATE1 or MATE2-K investigated in this study, neither the renal clearance nor the dose-adjusted AUC0-last significantly differed between the variant subjects and wild-type subjects (Supplement Fig. 1 and Table 1); additionally, the Cmax of metformin did not differ (Table 2).
To detect interactions between the c.883-144A>G SNP in PMAT and the c.808G>T SNP in OCT2, two-way analysis of variance was conducted; no significant interaction effect by these two SNPs was observed on the renal clearance of metformin (p = 0.235).
Discussion
In this study, the renal clearance of metformin was significantly higher in subjects with the c.883-144AG or c.883-144GG genotype than in those with the c.883-144AA genotype (Fig. 1, Table 1). However, metformin exposure, presented as the dose-normalized AUC0-last, and maximum plasma concentration of metformin, presented as the dose-normalized Cmax, were not significantly different between genotype groups (Fig. 2, Table 1, Table 2).
PMAT is localized in the human intestine and renal tubule, and a decreased oral bioavailability or renal tubular reabsorption of metformin is expected if its function is decreased because of genetic variation. The increased renal clearance of metformin observed in this study supports decreased renal reabsorption of metformin from the renal tubule. Although the c.883-144A>G SNP is in the intron region of PMAT gene, it can also affect protein function through various steps of gene expression.[1415] However, the results also showed that this increased renal clearance does not affect the overall exposure or concentration of metformin in the plasma, and this was similar to the results previously reported in Danish patients.[13] This may be because the amount of metformin reabsorbed in the renal tubules does not account for a large proportion of the total metformin exposure. Another less likely explanation is that an unknown compensatory mechanism exists to decrease renal reabsorption. Our study result supports the role of PMAT genetic polymorphism in metformin pharmacokinetics, but further in vitro and in vivo studies are needed to confirm this.
For OCT2, subjects with the c.808GT or c.808TT genotype showed significantly lower renal clearance of metformin than subjects with the c.808GG genotype (Fig. 3, Table 1). These results are similar to those of Song et. al.[5] and Wang et. al.[7] enabling assessment of the reliability of our study. We found no differences in pharmacokinetic parameters between the MATE1 or MATE2-K genotype groups (Supplement fig. 1 and Table 1). However, these variants were in the intronic and promotor regions of MATE1 or MATE2-K and because its functional role is controversial, this result requires further evaluation.[1013] The functions of MATE1 and MATE2-K are still in debate and contradictory evidence is found in literature.[691013] Additionally, there appeared to be no interaction effect between the c.883-144A>G SNP of PMAT and c.808G>T SNP of OCT2; while the former SNP variant appeared to increase the renal clearance of metformin, the latter SNP variant showed decreased renal clearance. Although the small sample size limits evaluation of the interaction effect analysis, this finding can be evaluated in further in vivo studies.
The present study had some limitations. First, although T2DM patients have different physiologic status from healthy subjects with respect to insulin sensitivity and glucagon regulation, our study was conducted in healthy subjects to minimize con founding factors.[1617] However, we assumed that the effect of PMAT genetic polymorphism on the pharmacokinetics of metformin varies minimally between subject groups if the transporter is not affected by the disease state. This may not be true in some cases since our study had used two different doses doses of metformin; the pharmacokinetic saturation of metformin could have been affected by different genotypes that administered different metformin doses. Second, this study was a retrospective analysis of previous metformin pharmacokinetic studies and the number of subjects was not evenly distributed between genotype groups. This uneven distribution of subjects and the small number of sample size may have influenced our results to be different from those of previous studies. However, the allele frequencies of PMAT SNPs in the Korean population were unknown, and this study could not be performed with a prospective pharmacogenomics study design. A well-designed prospective study is needed to evaluate the clinical significance of this genetic polymorphism. Furthermore, there was an outlier present in our study (Fig. 1) which may have affected the statistical analysis results. Further analysis of variance omitting this outlier resulted in the loss of statistical significance in the OCT2 SNP (data not shown, p=0.644). However, because our results correspond to previously published results, our study may be reproducible with an adequate sample size.
In conclusion, we evaluated the role of PMAT genetic variations in metformin's pharmacokinetic characteristics in a Korean population. The renal clearance of metformin was significantly increased in subjects with the c.883-144A>G SNP in PMAT; decreased renal tubular reabsorption of metformin may explain this finding. Further studies including a balanced prospective clinical study are needed to investigate the impact of the c.883-144A>G variant on PMAT activity.
 XML Download