

 PDF
PDF ePub
ePub Citation
 Print
Print


Objectives
Describe the difference between pharmacokinetic and physiokinetic models for delayed drug response
Be able to describe the reasons for delayed response to thiopental, digoxin and warfarin
Understand why drug responses can be markedly delayed
Appreciate when cumulative responses are important for clinical outcome
Learn the concept of schedule dependence
Delayed drug effects
In reality all drug effects are delayed in relation to plasma drug concentrations. There are several mechanisms which can explain delayed effects:
It takes time for drug to distribute to the site of action. After reaching the receptor the process of binding to the receptor may be slow and contribute to delay in response. It then takes time for the drug action to change physiological intermediate substances before the drug response is observed. The processes that follow pharmacokinetic distribution can be described as binding and physio-kinetic processes.
While in principle it is possible to distinguish all three mechanisms it is most common to identify only one delay process. If the delays are short (minutes) then the mechanism is probably a distribution process whereas if the delay is long (hours or longer) then the mechanism is more likely to be physiological.
Distribution to effect site
Distributional delays are readily understood in terms of anatomy. It takes time for a drug molecule to get from the blood to a target tissue because of delays in perfusion of tissues and diffusion across blood vessel walls and through extracellular spaces.
The rapidly mixing central blood volume is the driving force compartment for the delivery of drug to the tissues.
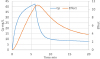
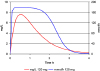
Thiopental is used for the rapid induction of anaesthesia. Figure 1 shows the time course of measured thiopental concen trations (black symbols) compared with the effect on the EEG.
Thiopental slows the frequency of EEG electrical activity. The EEG scale is inverted (right hand axis scale) so that slowing of the EEG causes the EEG curve to move up and down in parallel with plasma concentration. Note the delay in the effect curve in relation to plasma concentration.
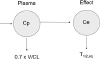
Because it is usually difficult or impossible to measure drug concentration at the site of action the time course of distribution can be described empirically by proposing an effect compartment. The time course of observed drug effect is then used to deduce the time course of drug concentration at the site of action.
The simplest model for an effect compartment is very similar to a one compartment model for pharmacokinetics. The time needed to reach steady state in a pharmacokinetic system receiving a constant rate input is determined by the elimination half-life from the plasma compartment. If drug concentrations in the plasma are constant then the rate of input to the effect compartment will also be constant and the time to steady state in the effect compartment will be simply determined by the equilibration half-life.
More complex pharmacokinetic systems are readily described by the effect compartment model (Fig. 2) in the same way that plasma concentrations from complex inputs can be predicted with a pharmacokinetic model.
The effect compartment half-life is also known as the equilibration half-life because it describes the time course of equilibration between the plasma and effect compartments. The elimination half-life of a pharmacokinetic system is determined by the volume of distribution and clearance. The volume and clearance of the effect compartment determine the equilibration half-life.
Thiopental reaches the brain quickly and is washed out rapidly because of the high blood flow to the brain which determines the high effect compartment clearance. It is the rapid washout of thiopental that leads to a short equilibration half-life of about a minute.
After distribution to the site of action a drug binds to its receptor. This process is usually quite rapid and does not contribute in a noticeable way to the delayed drug effect.
Binding to Receptor
Some drugs dissociate slowly from their receptor and this can be the main factor determining the delay in drug effect. Very potent drugs typically dissociate slowly. Examples include digoxin (effects on heart) and ergotamine (effects on uterus and blood vessels).
The time course of drug concentration in plasma can be used to predict the average concentration in all the other tissues of the body. Note that this average tissue concentration is not specific for any particular organ or tissue so it usually does not closely reflect the distribution and equilibration at the site of action.
For digoxin effects on cardiac contractility the effect compartment reaches a peak before the average tissue concentration in part because of the more rapid perfusion of the heart compared with other tissues such as fat.
Despite rapid perfusion of the heart the equilibration half-life of digoxin is quite slow. This is because extensive binding of digoxin to Na+K+ATPase in the heart takes a long time to reach binding equilibrium as a consequence of its long dissociation half-life [2]. The slow dissociation is part of the explanation why digoxin is such a potent drug (it is effective at nanomolar concentrations). Equilibrium receptor binding is determined by the ratio of the association half-life to the dissociation half-life. A long dissociation half-life means the concentration producing 50% of full receptor binding at equilibrium will be small and thus the potency of the drug will be high.
Physiological intermediate
Warfarin is an anticoagulant used to treat conditions such as deep vein thrombosis or to prevent blood clots and emboli associated with atrial fibrillation. It acts by inhibiting the recycling of vitamin K in the liver. The effect of lowering the supply of vitamin K is a decrease in the synthesis rate of clotting factors. The observable response is an increase in the time taken for blood to clot e.g. as measured by the international normalized ratio (INR).
The time course of change in prothrombin complex is determined by the half-life of the proteins e.g. Factor VII, IX, X, which are involved in blood coagulation. The slow elimination of the prothrombin complex clotting factors eventually leads to a new steady state with an associated change in INR.
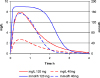
Figure 3 illustrates the INR response to a loading dose and maintenance dose of warfarin. The average concentration of warfarin is 1.5 mg/L which is close to the C50 for warfarin inhibition of Vitamin K recycling. Three INR profiles are shown with different C50 values. The steady state INR is higher when the C50 is low and the INR is lower when the C50 is high. However, the time to reach a new steady state INR is not affected by the C50 because it is only determined by the half-life of the clotting factors.
The prothrombin complex of clotting factors has an average elimination half-life of about 14 hours. This means it typically takes 2 to 3 days to reach a new steady state INR value.
Many drugs have delayed effects due to physiological turnover. Angiotensin converting enzyme inhibitors (e.g. enalapril) have a slow effect on blood pressure related to slow loss of sodium and subsequent decrease in plasma volume. Sodium turnover takes about a week to reach a new steady state so it may take 2 to 3 weeks for blood pressure changes to stabilize.
Cumulative drug responses
Many clinical outcome benefits and adverse effects are a consequence of cumulative drug action. The time course of drug action can be used to predict cumulative responses and explain phenomena such as schedule dependence.
The major symptoms of congestive heart failure are associated with excess fluid in the body. Removal of the excess fluid can help relieve symptoms of breathlessness and ankle swelling.
Diuretics are commonly used to make the kidneys retain less sodium and thus encourage a loss of fluid.
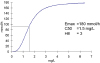
Furosemide has a rapidly reversible action on the sodium transporter in the proximal tubule. The relationship between plasma concentration of furosemide and the excretion rate of sodium can be described by a sigmoid Emax model. The maximum excretion rate of sodium is 180 mmol/h (Fig. 4). Compare this maximum rate with the 140 mmol of sodium per liter of plasma. The maximum effect of furosemide is equivalent to losing more than a liter of plasma per hour which can have dramatic effects on blood pressure.
The time course of furosemide effect is illustrated with a large oral dose (120 mg) in Figure 5.
The effect starts quickly and reaches a plateau for nearly 2 hours then drops away quite rapidly. The loss of effect is quicker than the plasma concentration of furosemide disappears. This is a consequence of the steep concentration effect relationship with a Hill exponent of 3.
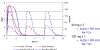
Compare the concentrations and effects from a large dose (120 mg) and a small dose (40 mg) of furosemide (Fig. 6). The concentrations from the smaller dose are always exactly 1/3 of those seen at the same time with the larger dose.
In contrast the maximum effect of the smaller dose is nearly as big as the maximum effect of the larger dose. This is because the peak concentration (around 2.5 mg/L) can achieve nearly 80% of Emax.
The cumulative sodium excretion can be calculated from the area under time versus sodium excretion curve (AUCe). The AUCe over a 12 hour interval has been calculated following the same total dose given either as a single dose of 120 mg or 3 doses of 40 mg given every 4 hours (Fig. 7). The cumulative response is predicted by the AUCe. Giving smaller doses more frequently can increase the overall response by 50%. Note that exposure measured by cumulative dose or by cumulative AUC (furosemide concentrations) is the same for both methods of dosing.
The total loss of sodium and water (reflected in AUCe) and the effect on edema in congestive heart failure depends on the dosing schedule not just the total dose. This is the phenomenon of schedule dependence. It is commonly seen with drugs whose outcome depends on the cumulative response to a drug effect which approaches its maximum after each dose.
Drugs which bind irreversibly do not show schedule dependence. Many anti-cancer agents are in this category e.g. cisplatin, cyclophosphamide, busulfan. The cumulative effect of treatment with these drugs depends on the total dose administered not on the rate or frequency of administration.
 XML Download