

 PDF
PDF ePub
ePub Citation
 Print
Print


Introduction
Cardiovascular disease is a leading cause of mortality worldwide. Dyslipidemia is one of the major modifiable risk factors of cardiovascular disease. Lowering low-density lipoprotein cholesterol (LDL-C) level plays a major role in prevention of cardiovascular disease.[1] Rosuvastatin is a member of statins, a class of drugs that inhibit 3-hydroxy-3-methylglutaryl coenzyme (HMG-CoA) reductase which is an essential enzyme involved in the synthesis of cholesterol. Patients receiving rosuvastatin show statistically significant improvement in LDL-C, triglyceride and total cholesterol level compared with those rceiving other statins.[2] The GALAXY studies have shown that rosuvastatin is well tolerated with similar safety profile to other statins.[3]
Statins including rosuvastatin are widely used as primary therapeutic option in lowering LDL-C.[1] However, still a significant portion of patients do not achieve LDL-C target level with statin therapy alone.[4] Increasing dose of statin has limitation in those patients since incidence of adverse reactions such as myopathy may also rise. Therefore, in order to further reduce LDL-C level without increasing adverse reactions, combining additional drug with different mechanism of action is necessary. Ezetimibe is a selective inhibitor of intestinal cholesterol absorption that blocks Niemann-Pick C1-Like 1 (NPC1L1) protein, cholesterol transporter expressed in brush border of enterocytes.[5] Ezetimibe can be administered alone (monotherapy) or with other lipid-regulating drugs (combination therapy). Monotherapy of ezetimibe 10 mg tablet is known to lower LDL-C for about 18%.[6] Previous studies have shown increased efficacy of statin/ezetimibe combination therapy in comparison with monotherapy. In IMPROVE-IT study, addition of ezetimibe to statin therapy lowered LDL-C by about 24%. Moreover, the combination therapy also resulted in lowered risk of cardiovascular events compared to statin alone.[7] Since fixed-dose combination (FDC) tablet is known to reduce non-compliance by reducing pill burden, especially in chronic disease,[8] there are currently 27 FDCs of rosuvastatin and ezetimibe in the Republic of Korea.
This study aimed to compare the single-dose pharmacokinetic (PK) profiles of FDC tablet of rosuvastatin 20 mg and ezetimibe 10 mg with those of the co-administration of individual rosuvastatin 20 mg and ezetimibe 10 mg tablets in healthy subjects.
Methods
Study subjects
Healthy male volunteers aged between 19 and 55 years with body mass index (BMI) between 17.5 and 30.5 kg/m2, were eligible for inclusion in the study. Subjects with history of gastrointestinal disorder which may affect drug absorption, or liver function test abnormality defined as aspartate aminotransferase (AST) or alanine aminotransferase (ALT) level > 2.0 × upper limit of normal range were excluded from the study. Other major reasons for exclusion were the followings: clinically significant abnormalities in medical history, vital sign measurements, physical examination, clinical laboratory tests (hematology, biochemistry and urinalysis) and 12-lead electrocardiogram, known allergy or hypersensitivity to components of investigational drug (rosuvastatin, ezetimibe), diagnosis of myopathy, and concurrent cyclosporine administration. Based on previous comparative PK studies of rosuvastatin and ezetimibe, the within-subject coefficient of variation for the PK parameters was assumed as 35%.[910] A total of 50 subjects were required to detect a difference of 20% or more in the PK parameters between the treatments at a significance level of 0.05 and a power of 80%. Dropout rate was assumed as 24% to estimate a total of 66 subject to be enrolled. The protocol was approved by the institutional review board of Chonbuk National University Hospital (Jeonju, South Korea) and the Ministry of Food and Drug Safety (South Korea), and all study subjects gave written informed consent before screening procedure.
Study design
This was a randomized, open label, single-dose PK study with two-way crossover design. Subjects were hospitalized in the Chonbuk National University Hospital on the evening before drug administration and were allocated to two groups in a 1:1 ratio according to a predesigned randomized table.
After overnight fasting, each subject received one of the two treatments (either the test formulation or the reference formulation) with 240 mL of water. The test formulation was FDC of rosuvastatin 20 mg / ezetimibe 10 mg (DP-R207, Alvogen Korea Co., Ltd., Republic of Korea), and reference formulation was concurrent administration of rosuvastatin 20 mg tablet (Crestor, AstraZeneca Co., Ltd., Seoul, Republic of Korea) and ezetimibe 10 mg tablet (Ezetrol, MSD Korea Co., Ltd., Seoul, Republic of Korea). To minimize food effect on ezetimibe absorption, all subjects were served a low-fat meal (about 700 kcal) approximately 4 hours after dosing. After 2 weeks of washout period, subjects received the other treatment.
Blood sample collection
Blood samples for PK analysis of rosuvastatin, ezetimibe and total ezetimibe (ezetimibe + ezetimibe glucuronide) were collected via saline-locked angiocatheter into the EDTA-containing tubes at 0 (pre-dose), 0.5, 1, 1.5, 2, 2.5, 3, 4, 4.5, 5, 5.5, 6, 6.5, 7, 8, 10, 12, 24, 48 and 72 hours post-dose in each period. Blood sampling schedule was based on reported PK parameters of rosuvastatin and ezetimibe.[1112] Blood samples were centrifuged within 60 minutes of collection at 3,000 rpm for 10 minutes at 4℃. Aliquots of plasma were placed in polypropylene tube (in case of plasma for rosuvastatin concentration analysis, sodium acetate buffer (pH 4.0, 0.2 M) 0.25 mL was added to each 0.75 mL of plasma. All plasma samples were immediately stored in -70℃ freezer until they were shipped to the central laboratory for analysis.
Plasma concentration of rosuvastatin, ezetimibe and total ezetimibe
Plasma concentrations of rosuvastatin and ezetimibe were analyzed by liquid chromatography with tandem mass spectrometry (LC-MS/MS) (LC: Shimadzu UFLC/Shimadzu Prominence LC, Shimadzu, Japan. MS: API5000, AB SCIEX, USA). Rosuvastatin (m/z 482.1 à 258.1), ezetimibe (m/z 408.2 à 271.2) and internal standards, rosuvastatin-d6 (m/z 488.1 à 264.1) and ezetimibe-d6 (m/z 412.2 à 275.2) were detected using positive ion (rosuvastatin) and negative ion (ezetimibe) by multiple reaction monitoring mode. The linear calibration ranges were 0.1-100 ug/L for rosuvastatin, 20-20,000 ng/L for ezetimibe, and 0.25-250 ng/mL for total ezetimibe. The coefficients of variation which represent overall precision of rosuvastatin and ezetimibe assay were all within the acceptance criteria of <15% (<20% at lower limit of quantification level).
Pharmacokinetic data analysis
Phoenix® WinNonlin® version 6.3 software (Pharsight, CA, USA) was used to calculate following PK parameters by non-compartmental methods. Actual time of PK sampling were used for PK analysis. The maximum concentration (Cmax) and the time to reach Cmax (Tmax) were directly obtained from observed data. The area under the plasma concentration-time curve from 0 hour to the last measurable time (AUClast) was determined using the linear trapezoidal method. The area under the plasma concentration versus time curve from 0 hour to infinity (AUCinf) was calculated as AUClast + Ct / λz, where Ct was the last measured concentration and λz was the elimination rate constant calculated using linear regression of the log-linear portion of the plasma concentration-time curve. The t1/2 was calculated as ln (2) / λz. The apparent total clearance (CL/F) was calculated using the equation CL/F=dose/AUCinf.
Safety and tolerability assessment
Data from all the subjects who received study drug at least once were included for safety and tolerability assessment. Adverse events (AEs), physical examinations, vital signs, clinical laboratory tests (hematology, chemistry and urinalysis) and 12-lead electrocardiograms were performed for each subject during the entire study period including end-of-study visit.
Statistical analysis
All statistical analyses were performed using SAS 9.4 (SAS Institute, Cary, NC, USA). For primary PK parameters, the geometric mean ratio (GMR) and the 90% confidence interval (90% CI) were calculated from the analyses of variance model, including sequence, period, and treatment effect as fixed effects, and subject nested within sequence as a random effect. The 90% CIs were analyzed for containment within conventional bioequivalence limits (0.8, 1.25). Secondary PK parameters were summarized using descriptive statistics. A p-value < 0.05 was considered statistically significant. The adverse events data were analyzed using chi-square test or Fisher's exact test to compare between two treatments.
Results
Subject Disposition and Baseline Characteristics
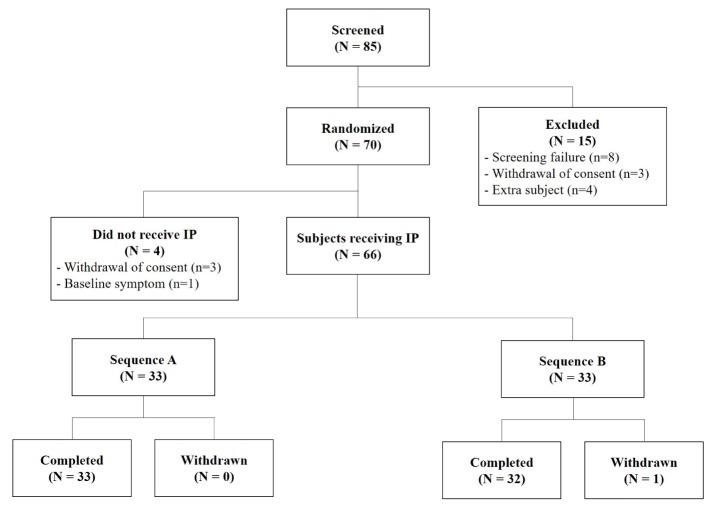
As shown in Figure 1, out of the 85 screened subjects, 70 subjects were randomly assigned to the study sequences and 66 received study treatments. Among the total of 66 subjects who were enrolled, 65 subjects completed the study and were included in the PK analysis. One subject in sequence B discontinued due to unwillingness to participate one day before period 2 treatment. Overall, mean age, weight and BMI of the subjects were 23.4 years (range 20–26 years), 71.5 kg (range 55.7–102.9 kg) and 23.6 kg/m2 (range 18.0–30.4 kg/m2). Demographic characteristics including age, height, weight, and body mass index showed no statistically significant difference between the two sequence groups (all P-values were above 0.05 by Wilcoxon rank sum test, independent t test, chi-square test).
Pharmacokinetics
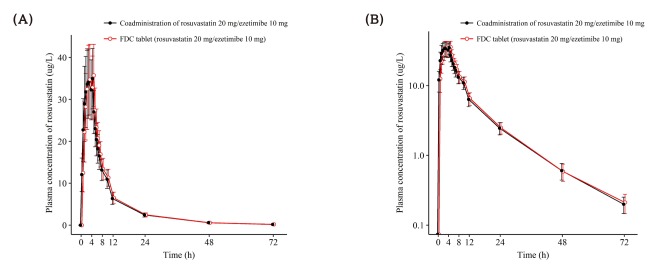
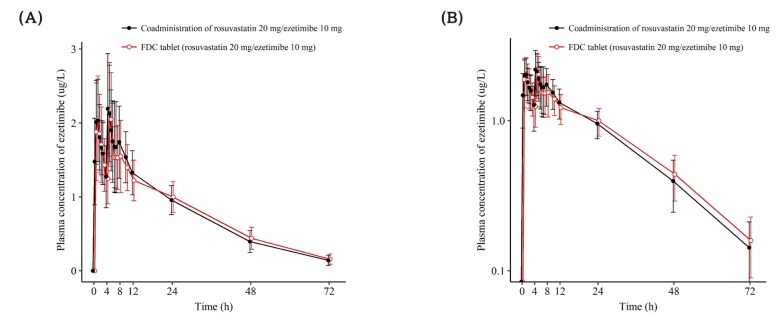
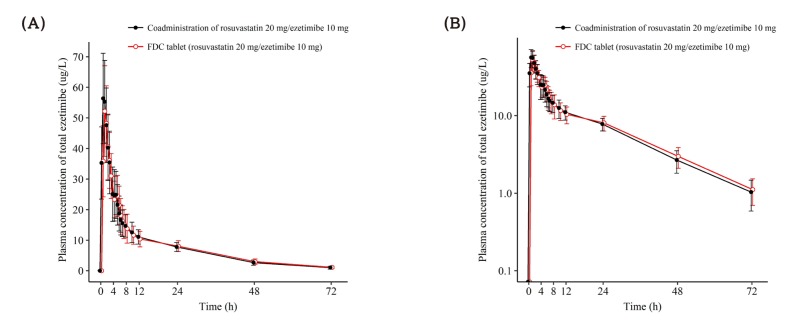
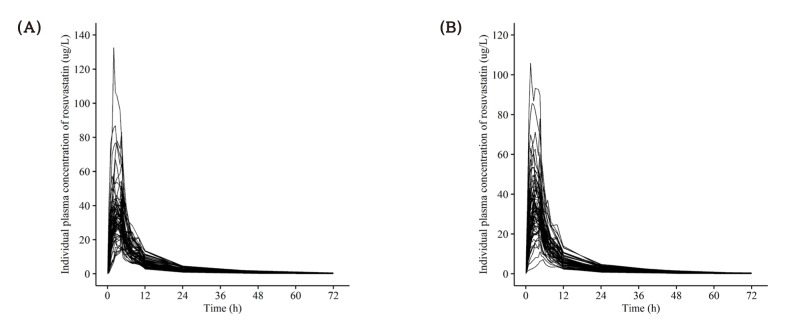
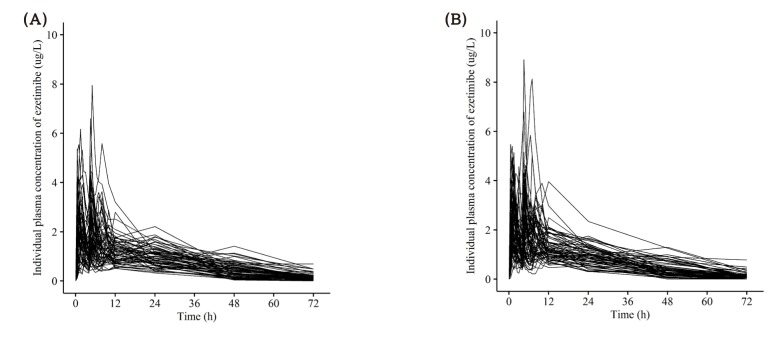
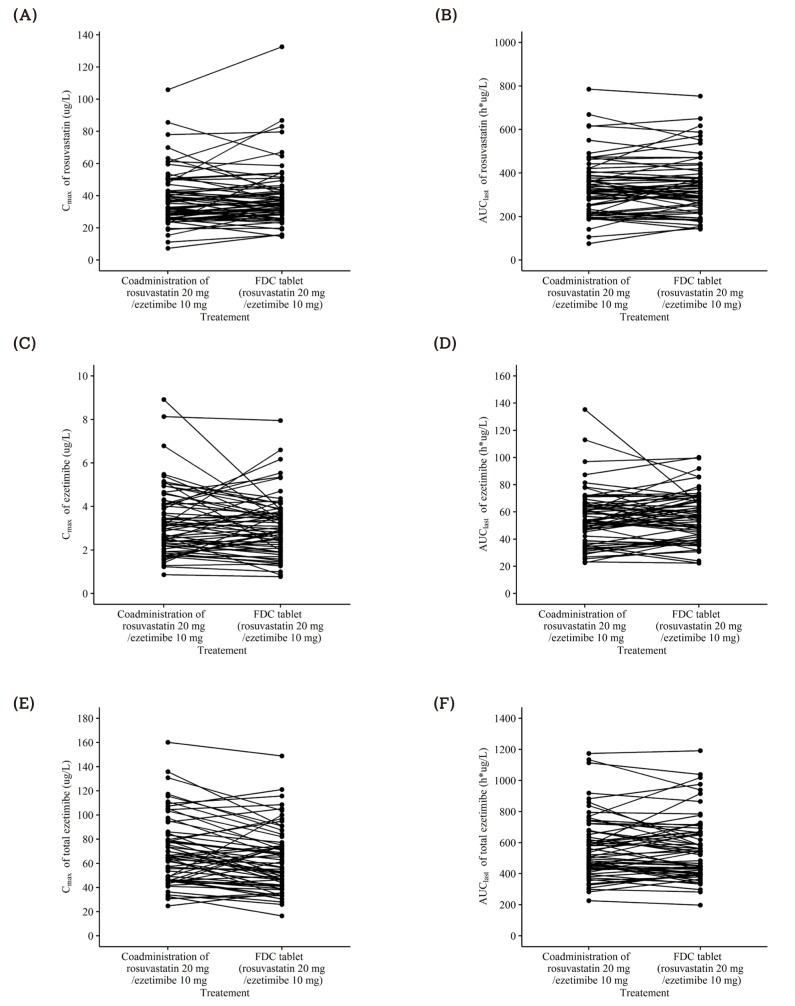
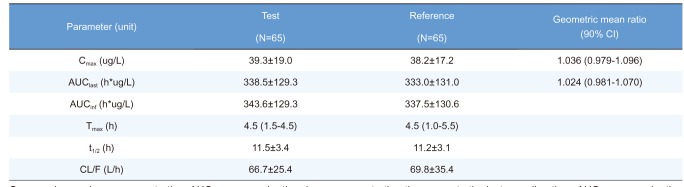
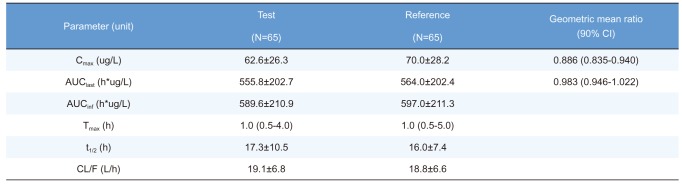
A total of 65 subjects completed scheduled PK sampling as planned and were included in PK analysis. As illustrated in Figure 2, Figure 3, and Figure 4, mean plasma concentration-time profile of rosuvastatin, ezetimibe and total ezetimibe following administration of FDC tablet of rosuvastatin 20 mg / ezetimibe 10 mg and those in response to the individual products were similar. Individual concentration-time profiles of rosuvastatin and ezetimibe are shown in Figure 5 and Figure 6. Corresponding PK parameters for rosuvastatin, ezetimibe and total ezetimibe listed in Table 1, Table 2, and Table 3 were also comparable between two treatments. The GMR of Cmax and AUClast (90% CI) for rosuvastatin, ezetimibe, and total ezetimibe are summarized in Table 1, Table 2, and Table 3. GMRs and 90% CIs for Cmax and AUClast of all analytes were contained within conventional bioequivalence limits (0.8, 1.25). Individual PK parameters of rosuvastatin, ezetimibe and total ezetimibe are shown in Figure 7.
Safety and tolerability
A total of 66 subjects who received study treatment at least once were assessed for safety and tolerability. During treatment with FDC of rosuvastatin 20 mg / ezetimibe 10 mg, 6 subjects reported 6 AEs, while 11 subjects reported 13 AEs after concurrent administration of individual tablets. All AEs were mild in severity. No serious AEs were reported. Most common AEs were laboratory abnormalities: increased blood creatinine phosphokinase and positive WBC in urine. The former abnormality was reported in 2 cases after FDC administration and in 5 cases after individual tablet administration, while the latter was reported in 3 cases in FDC and in 4 cases after concurrent administration, respectively. No clinically significant change was observed in laboratory test, electrocardiogram, vital signs and physical examinations during the study. Overall, both formulations were safe and well tolerated, with no apparent difference in AE profile. No statistically significant difference was observed between number of AEs occurred while treatment with two formulations (all P-values were above 0.05 by Chi-square test and Fisher's exact test).
Discussion
Dyslipidemia is one of the major risk factors of cardiovascular disease. For patients with very high LDL-C level or statin intolerance, various combinations of statin and lipid-lowering agents are currently used to achieve target LDL-C level. Among them, co-administration of statin and ezetimibe is recommended therapeutic option in terms of both efficacy and safety.[13] There is no known significant PK drug interaction between rosuvastatin and ezetimibe.[14] FDCs are known to improve compliance in those patients with chronic disease.[8] Primary objective of the study was to compare PK profile between two formulations: FDC of rosuvastatin 20 mg / ezetimibe 10 mg and concurrent administration of corresponding individual tablets. PK profiles of rosuvastatin, ezetimibe and total ezetimibe were comparable after administration of two formulations. Mean concentration-time profiles were similar in rosuvastatin, ezetimibe and total ezetimibe. The 90% CI for Cmax and AUClast of rosuvastatin, ezetimibe and total ezetimibe were all contained within (0.80, 1.25).
Orally administered ezetimibe undergoes extensive glucuronidation at intestinal mucosa before entering systemic circulation where ezetimibe glucuronide constitutes approximately 90% of total plasma ezetimibe.[5] Ezetimibe and ezetimibe glucuronide are then delivered to the liver and secreted to intestinal lumen via bile on stimulation of food intake.[15] Ezetimibe glucuronide is formed through presystemic metabolism and is a pharmacologically active metabolite, which significantly contributes to safety and efficacy profile of the drug. Therefore, FDA guidance indicates PK parameters (Cmax and AUC) of total ezetimibe as well as parent ezetimibe to be considered as primary endpoint in the evaluation of bioequivalence.[516]
Individual concentration-time profile of ezetimibe shows multiple peaks (Figure 6) Previous studies have suggested enterohepatic recirculation as a mechanism for multiple peaks shown in ezetimibe profile.[1718] Therefore, enterohepatic recirculation might be a contributing factor to multiple peaks shown in concentration-time profile of ezetimibe.
For dosage of rosuvastatin, 20 mg was selected since it is the highest dose in most dyslipidemia patients owing to increasing incidence of dose-related adverse events such as myopathy in patients receiving 40 mg.[11] Dosage of ezetimibe was set to 10 mg as generally indicated dose for dyslipidemia.[12] In this study, both FDC tablet and concurrent administration of individual tablets of rosuvastatin 20 mg and ezetimibe 10 mg were tolerable with no apparent difference in AE profiles.
Current study has shown similarity in PK profiles between FDC tablet and concurrent administration of individual tablets of rosuvastatin 20 mg and ezetimibe 10 mg. Since the effect of FDC in improving compliance was shown in meta-analysis, [8] development of rosuvastatin/ezetimibe FDC tablet may contribute to better clinical outcome in patients with dyslipidemia.
The administration of FDC of rosuvastatin 20 mg / ezetimibe 10 mg was bioequivalent to concurrent administration of the corresponding individual tablets as GMR with 90% CI of Cmax and AUClast of rosuvastatin, ezetimibe and total ezetimibe were contained within conventionally accepted bioequivalence criteria.

 XML Download