

 PDF
PDF ePub
ePub Citation
 Print
Print


Introduction
The aim of pharmacokinetic (PK) studies is to examine the kinetics of a drug with regard to absorption, distribution, metabolism and elimination in the body. PK data analysis consists of noncompartmental analysis (NCA) and nonlinear regression analysis.[12] NCA uses the trapezoidal rule for measurement of area under the concentration-time curve (AUC), and requires fewer assumptions than model-based analysis.[2] NCA allows for estimation of various PK parameters such as AUC, peak observed drug concentration (Cmax), time of peak concentration (Tmax), and elimination half-life. Particularly, AUC and Cmax are often accepted as the criteria for approval of bioequivalent drugs.
R, a widely-used computer language, is a suite of libraries of statistical and mathematical computations.[3] Despite its relatively small base system compared with other commercial softwares for NCA such as WinNonlin®[4] and Kinetica,[5] R has robust functions for scientific computation and numerous add-in packages for use in various fields.[6] Therefore, many efforts are being made to replace commercial softwares with R packages.
In this article, we introduce two newly-developed R packages, NonCompart and ncar, that are compatible with SDTM (Study Data Tabulation Model)-formatted dataset of CDISC (Clinical Data Interchange Standards Consortium), which is the standard of documentation submitted to regulatory authorities,[7] while providing a practical method for producing complete NCA reports.
Methods
R packages (NonCompart and ncar)
Two R packages (NonCompart and ncar) for NCA were developed in the open-source R programming language in order to allow free public use. R packages can be installed and loaded using the following scripts.
R code
install.packages(c("NonCompart","ncar"))library(NonCompart)
library(ncar)
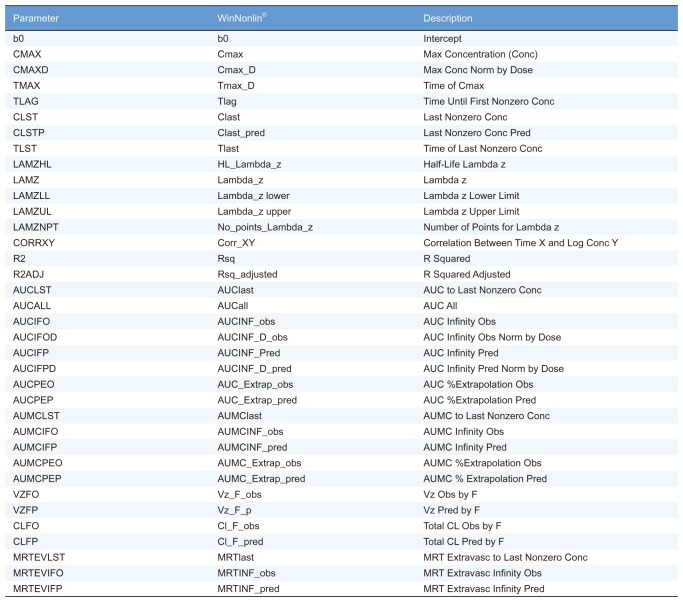
Detailed documentation and examples for each package can be found on the online user manual in the CRAN repository (http://cran.r-project.org/web/packages/NonCompart/index.html, http://cran.r-project.org/web/packages/ncar/index.html) or directly within the R console by entering ?function (e.g.?NonCompart,?ncar). These two packages are implemented in R and can accept a set of input arguments that allow for generation of NCA output. The names of most NCA metrics estimated by the function of these packages are consistent with those used in WinNonlin® (Table 1).
Software
WinNonlin® (Pharsight, Mountain View, CA, USA)[4] in Microsoft-Windows 7 (64 bit) was used for the computation. R 3.4.2 in Microsoft-Windows 7 (64 bit) was used for the comparison of calculated values.
Dataset
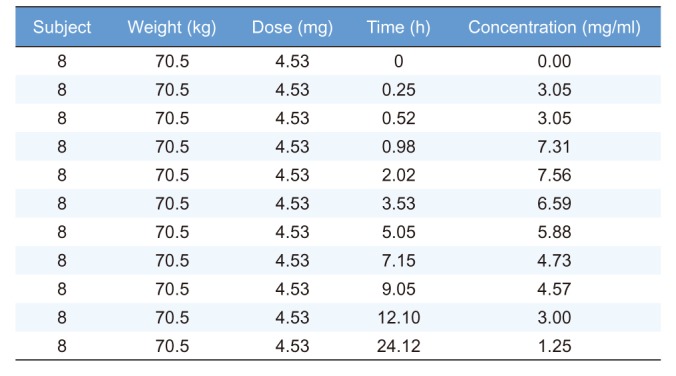
To compare the outputs generated by R packages and WinNonlin®, we used Theoph dataset obtained from the R software. The Theoph dataset has 132 observations from 12 subjects. A portion of the Theoph dataset (subject ID = 8) is shown in Table 2.
Results
NonCompart package: performance of NCA
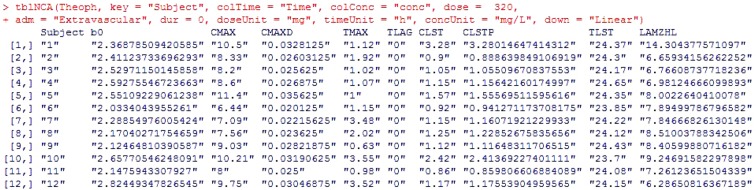
This package conducts NCA as similarly as possible to the most widely used commercial PK analysis software. The NonCompart package has two main functions, tblNCA and sNCA, for use in multiple subjects and one subject, respectively. Figure 1 shows an example of output by tblNCA. The input data for tblNCA( ) should be in a long format as exemplified by the Theoph dataset.
It is possible to input several keys such as subject demographics and information regarding dose, period, or sequence; the result of tblNCA( ) will print the key columns and the carried keys can be further used for additional statistical analysis (i.e. descriptive statistics, bioequivalence test, t-test, or ANOVA). The adm argument can be 'Extravascular', 'Bolus', or 'Infusion' and the down argument can be either 'Linear' or 'Log'. The greatest advantage of this package is that the outputs produced by this package are compatible with those of pharmacokinetic parameter (PP) TESTCD of CDISC SDTM.
R code
tblNCA(Theoph, key = "Subject", colTime ="Time", colConc = "conc", dose = 320, adm = "Extravascular", dur = 0, doseUnit = "mg", timeUnit = "h", concUnit = "mg/L", down = "Linear")
IntAUC( ) function calculates interval (partial) AUC (from t1 and t2) with the given series of time and concentration. The interval AUC (0.5–11 hour) of the subject 8 can be calculated using the Theoph dataset with the following R script.
R code
Time = Theoph[Theoph$Subject == 8, "Time"]
Concentration = Theoph[Theoph$Subject == 8, "conc"]
Res =sNCA(Time, Concentration, dose = 320, concUnit = "mg/L")
IntAUC(Time, Concentration, t1 = 0.5, t2 = 11, Res)
[1] 58.26022
ncar package: generation of NCA reports
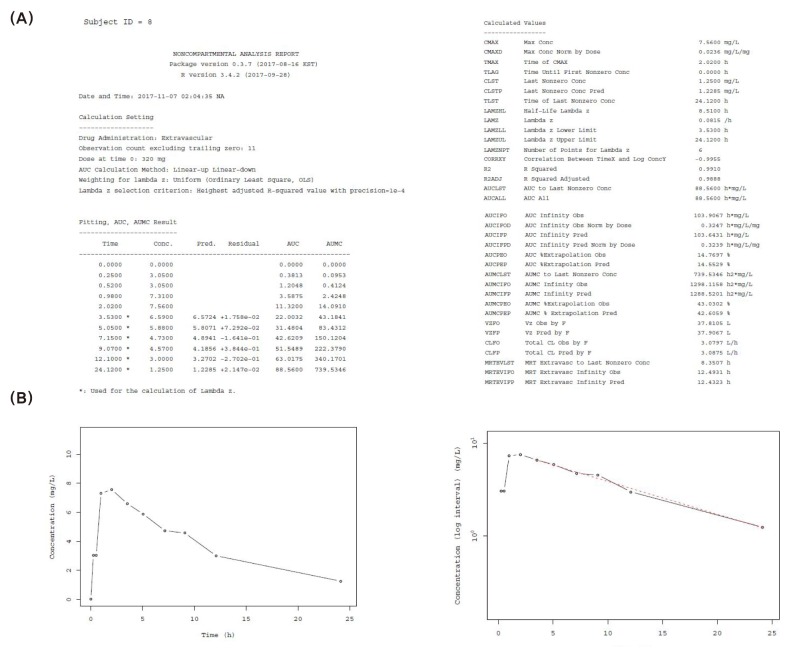
This package generates complete NCA reports including plots with both linear and logarithmic scale. Its two main functions are pdfNCA and rtfNCA, which produce pdf file format and rtf file format, respectively. The generated reports are similar to those generated from commercial softwares, but like NonCompart, this package has the advantage of using PPTESTCD of CDISC SDTM. ncar produces NCA reports through NonCompart and converts them into Microsoft Word format when using rtfNCA( ), which is convenient for editing. Reports generated by pdfNCA( )function show individual plots with trend lines that joins the dots used for calculating terminal slopes. Figure 2 shows an example of an NCA report in pdf format and an individual concentration-time plot.
R code
pdfNCA(fileName = "pdfNCA-Theoph.pdf", Theoph, colSubj = "Subject", colTime = "Time", colConc = "conc", dose = 320, doseUnit = "mg", timeUnit = "h", concU nit = "mg/L", down = "Linear")
Validation of NCA results between R packages and WinNonlin®
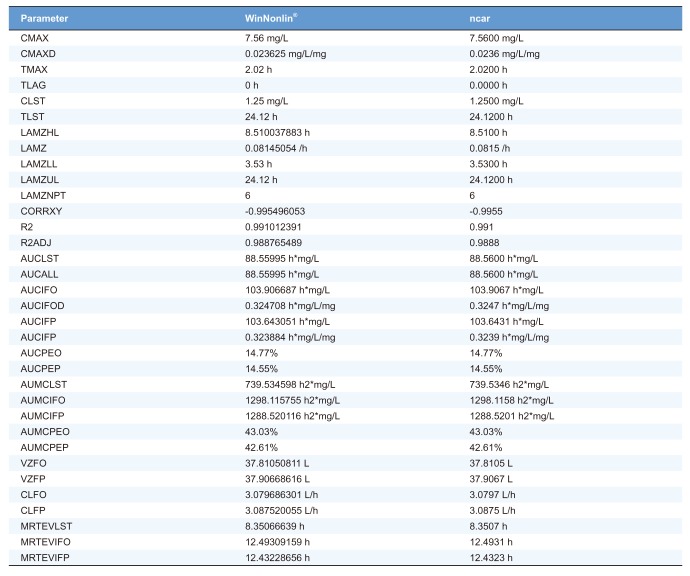
To demonstrate the accordance of outputs by ncar package and WinNonlin®, we performed NCA using Theoph dataset obtained from the R software. For comparison of the NCA results, we selected the following conditions: extravascular, linear-up linear-down, and best fit. We found no discrepancy between the two results as shown in Table 3 (a randomized subject, Subject ID = 8).
In order to further validate these packages, we compared NCA results using Indometh, another available dataset of the R software as well as other datasets of a number of subjects from several phase 1 clinical trials with different dosing routes such as infusion, bolus, and oral route. As a result, we could not find any discrepancy between outputs generated by the R packages and WinNonlin®.
Discussion
We developed two R packages—NonCompart and ncar for NCA. Through these packages, we aimed to implement the following functionalities for performing NCA: 1) CDISC SDTM terms; 2) automatic slope selection with the same criterion of WinNonlin®; 3) supporting both ‘linear-up linear-down’ and ‘linear-up log-down’ method; and 4) interval (partial) AUCs with ‘linear’ or ‘log’ interpolation method. These packages are convenient and efficient because they enable preparation of data and NCA as well as generation of reports including plots together in R software. As shown in Figure 2B, the NCA plot allows for automatic slope selection, however, it is not possible to manually choose the points used for calculating terminal slope. In addition, any error or change can easily be fixed, and users may choose calculation methods between linear and logarithmic, which support ‘linear-up linear-down’ and ‘linear-up log-down’ method, respectively. Our results showed that our R packages meet the aforementioned objectives.
Since the PPTESTCD of SDTM is used in the R packages, it is helpful to construct PP domain. In the present practice, one has to change variables from WinNonlin® one by one, which is an especially difficult task for those without specific knowledge on SDTM. A number of packages can perform NCA, but no package—even commercial softwares—can give outputs in the format of SDTM or receive SDTM-formatted input data. It is important to ensure that the reports are legible to sponsors and regulatory bodies by generating a consistent and systematic result, as well as the exact results of NCA.
As shown in Table 3, comparison of NCA results obtained by WinNonlin® and ncar package (including another package) showed no significant discrepancies. These two R packages are fast and easy-to-use tool-set that can successfully perform NCA with concentration–time data. Specifically, the ncar package can produce a comprehensive set of graphical and tabular outputs that summarize the NCA results, which is a complete report in pdf or rtf format. Our two newly-developed packages are free and open-source, so they can be used to develop other useful packages as well. We hope that NonCompart and ncar packages will enable researchers to easily perform NCA, and contribute to facilitation of drug discovery process.
 XML Download