Journal List > Transl Clin Pharmacol > v.25(4) > 1082666

Jin, Kim, Lee, Lee, Kwack, and Yim: Screening study for genetic polymorphisms affecting pharmacokinetics of talniflumate

Abstract

Talniflumate is a phthalidyl ester of niflumic acid, which has potent analgesic and anti-inflammatory effects and is widely used to treat inflammatory disorders, such as rheumatoid arthritis. To screen the possible genetic factors affecting the pharmacokinetics (PK) of talniflumate, 23 male Korean volunteers were enrolled from two separate bioequivalence studies. All subjects received 740 mg (two tablets) talniflumate in a standard 2×2 cross-over model in a randomized order. For the genetic study, PK parameters of the reference drug were used. We used Illumina Human610Quad v1.0 DNA Analysis BeadChip for whole genome single nucleotide polymorphism (SNP) analysis and whole genome genotyping data were processed by linear regression analysis for PK parameters. Whole genome analysis revealed 1498 significant SNPs (P < 0.0001) for Cmax, 65 significant SNPs (P < 0.0001) for Tmax, and 1491 significant SNPs (P < 0.0001) for AUCinf. For clinical pharmacological purposes, we selected SNPs from drug metabolizing enzymes and transporters, and analyzed the PK parameters of various genotypes. Two SNPs (rs11165069 from ABCA4 (p=0.00002); rs17847036 from CYP2C9 (p=0.000001)) showed significant associations with talniflumate Cmax. In the Tmax group, two SNPs (rs3787555 from CYP24A1 (p=0.00035); rs2275034 from ABCA4 (p=0.000587)) showed significant associations with talniflumate Tmax. In the AUCinf group, two SNPs (rs11165069 from ABCA4 (p=0.00002); rs12461006 from SLC1A6 (p=0.00008)) exhibited significant associations with talniflumate absorption. These results show that genetic factors could affect the PK parameters, and provide information that may be used in the development of personalized talniflumate therapy.

Introduction

Talniflumate, 3-pyridinecarboxylic acid 2-{[(3-trifluoromethyl) phenyl]amino}-1,3-dihydro-3-oxo-1-soenzofuranyl ester, is a phthalidyl ester of niflumic acid and is currently used to treat osteoarthritis and rheumatoid arthritis.[12] Niflumic acid shows rapid absorption followed by extensive metabolism, involving hydroxylation or glucuronidation.[3] However, the occurrence of side effects such as gastrointestinal irritation has been reported both in experimental animals and in clinical use. In order to lower ulcergenic activity, talniflumate was synthesized by esterification of the carboxyl group of niflumic acid.[4] Many genetic and non-genetic factors such as age, sex, life style, organ function, concomitant therapy, and the nature of the disease influence the effects of medications.[5] Following the Human Genome Project, it is understood that genetic factors can influence the response of an individual to a drug.[6] In clinical pharmacogenomics, drug-metabolizing enzymes.[78] drug transporters.[9] and other genes have been known to influence the individual differences in drug response.
Single nucleotide polymorphisms (SNPs) are the most common type of genetic variation, and are proven to significantly affect drug absorption, distribution, biotransformation, and excretion.[10] Our previous studies showed that the pharmacokinetics (PK) of simvastatin and pioglitazone are affected by the genotype of each individual.[1112]
The purpose of this study was to screen possible candidate genes affecting the PK of talniflumate. A total of 23 male Korean volunteers were recruited from two bioequivalence studies after approval by the Institutional Review Board (IRB) of Kyung Hee University Hospital. In this study, DNA from each subject was analyzed using Illumina Human610Quad v1.0 DNA Analysis BeadChip. Linear regression analysis was performed for significant SNPs affecting PK parameters, such as maximum measured plasma concentration (Cmax), time of the maximum measured plasma concentration (Tmax), and area under the plasma concentration-time curve from zero to infinity (AUCinf). For clinical pharmacological purposes, further analysis was performed on significant SNPs encoding phase I and II drug metabolizing enzymes to examine their effect on the PK of talniflumate.

Methods

Subjects

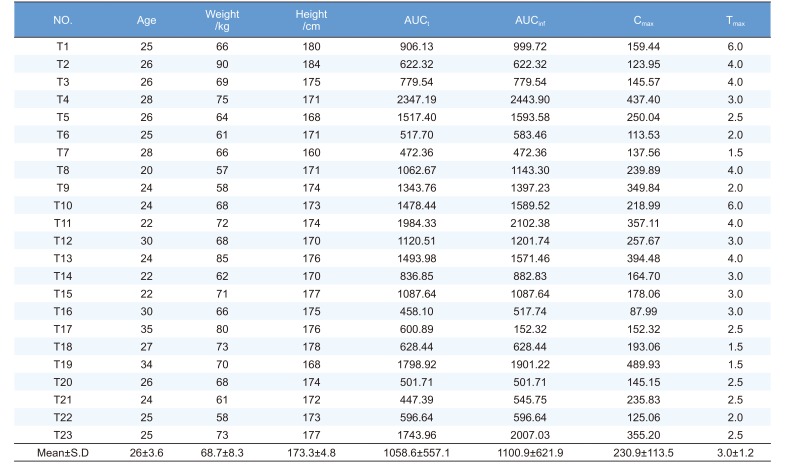
Volunteers were healthy Korean males who participated in two talniflumate bioequivalence tests at Kyung Hee Clinical Medical Research Institute of Kyung Hee University Hospital. The clinical protocol was approved by the IRB of Kyung Hee University Hospital and volunteers were recruited by direct call. Twenty-three out of 60 subjects from these previous tests participated in this pharmacogenetics study after providing written informed consent. The demographic characteristics of the volunteers are summarized in Table 1. Subjects ranged in age from 20 to 35 years (26 ± 3.6 years), in weight from 57.0 to 90.0 kg (68.7 ± 8.3 kg), and in height from 160.0 to 184.0 cm (173.3 ± 4.8 cm) (Table 1).

Previous bioequivalence studies

Previous studies were based on two talniflumate bioequivalence tests. Each bioequivalence study of two 370 mg talniflumate formulations (reference drug, Somalgen tablet 370 mg, Kunhwa Co., Ltd.) was conducted in healthy male Korean volunteers after a single dose administration in a randomized cross-over study with a washout period of at least one week. The subjects were hospitalized (Kyung Hee University Hospital, Seoul, Korea) and fasted overnight (10 h) and for 4 h after each drug administration. The doses were administered at 8.00 a.m. of each dosing day along with 240 ml of tap water. No food was allowed until 4 h after dose administration. Approximately 7 ml of blood for talniflumate and active metabolite assays were drawn into heparinized tubes through indwelling cannula before (0 h) and at 0.5, 1, 1.5, 2, 2.5, 3, 4, 6, 9, 12, 15 h after dosing. Blood samples were centrifuged at 3,000 rpm for 10 min; plasma was separated and kept frozen at −70℃ until assayed. Plasma was analyzed for talniflumate concentration using a validated high-performance liquid chromatography method.

Pharmacokinetics analysis

PK parameters (Cmax, Tmax, AUCt and AUCinf) were calculated by noncompartmental models in WinNonlin v5.2 (Table 1).

DNA extraction

DNA extraction was performed as previously described.[11] From May to August 2008, blood samples were obtained from 23 participants. After obtaining informed consent, approximately 10 ml of whole blood was collected from each participant. Blood samples were drawn into sterile tubes containing ethylenediaminetetraacetic acid (EDTA) and stored at −70℃ until the isolation of genomic DNA by a standard phenol chloroform extraction method.

Genotyping

SNPs of 23 healthy male volunteers were analyzed by Standard Illumina procedures using Illumina BeadStation 500G (Illumina Human610Quad v1.0 DNA Analysis BeadChip) as previously described.[1112] Intensity files (*.idat) were processed by BeadStudio GT module 3.3.4 with default analysis settings. Each SNP was analyzed independently to cluster and identify genotypes. Genotype calls were generated by comparing experimental data with those in the supplied cluster file (*.egt). The SNP set was filtered on the basis of genotype call rates (≥ 95%), and minor allele frequency (MAF ≥ 0.05).

Statistical analysis & data analysis

Statistical analysis was performed as previously described.[1112] Hardy Weinberg equilibrium (HWE) was calculated for individual SNPs using an exact test. All of the SNPs reported in this manuscript have HWE P-values > 0.001. To calculate the degree (Beta), 95% confidence intervals (CI) and P-value while controlling for age, height and weight as covariants in a linear regression analysis with significant SNPs on individual PK parameters of talniflumate, unadjusted genotypic association with additive, dominant and recessive models were tested by calculating the Beta and P-value using PLINK version 1.06 (Shaun Purcell, USA). When the additive model was used, each genotype was independently coded as 0, 1, or 2 and analyzed. In the dominant model, a homozygote major allele and another two genotypes were coded as 0 and 1 and analyzed. In the recessive model, a homozygote minor allele and another two genotypes were coded a 0 and 1 and analyzed. After filtering, SNPs were analyzed on chromosome 1 through chromosome 22 for each group.
Significant SNPs were identified from each PK parameter (Cmax, Tmax and AUCinf). These included SNPs of phase I and II drug metabolizing enzymes, which were selected to further analyze their effect on the PK parameters (two SNPs in Cmax, two SNPs in Tmax and two SNPs in AUCinf).

Results

Pharmacokinetics analysis

The PK parameters of talniflumate are shown in Table 1. Cmax is 230.9 ± 113.5 µg/L, Tmax is 3.0 ± 1.2 h, AUCt is 1058.6 ± 557.1 µg·h/L, and AUCinf is 1100 ± 621.9 µg/L. These data were used for linear regression analysis.

SNP analysis

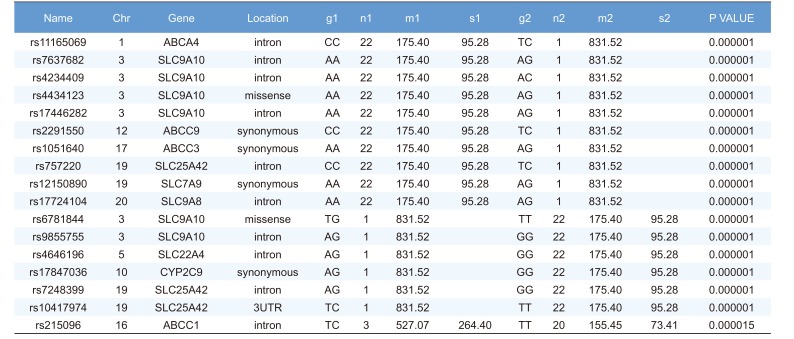
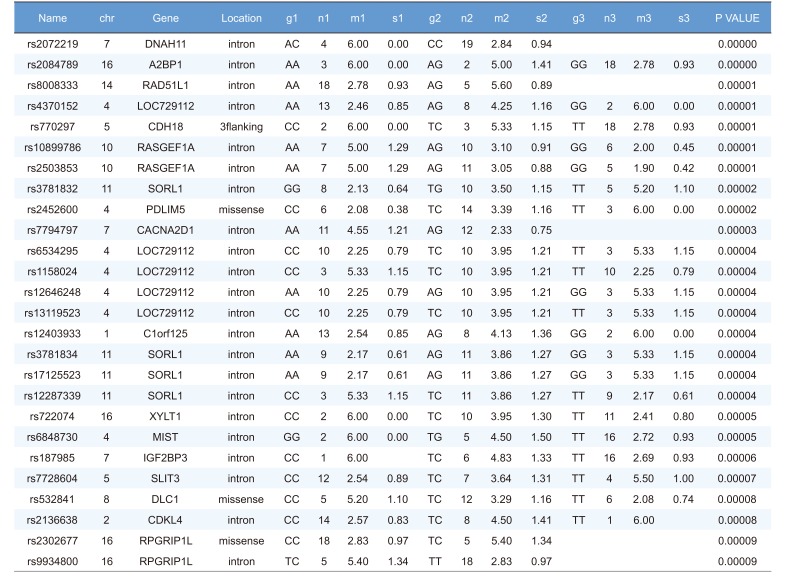
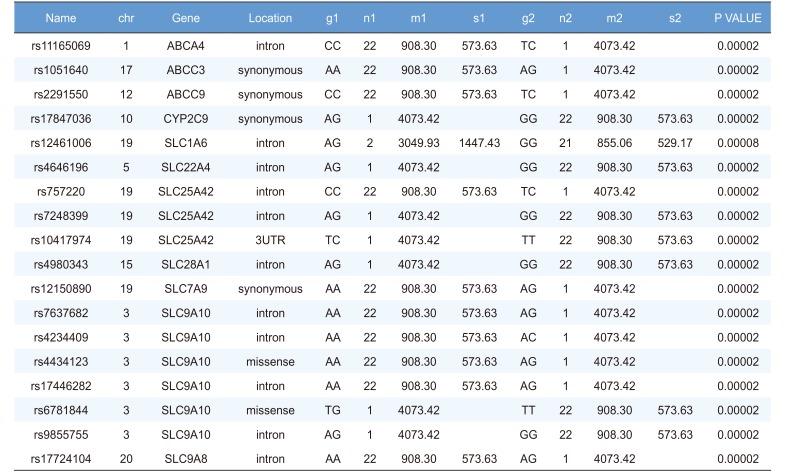
Linear regression analysis was performed on the PK parameters of talniflumate (Cmax, Tmax, and AUCinf). In this analysis, 25,361 significant SNPs in the Cmax group, 24,067 significant SNPs in the Tmax group, and 23,604 significant SNPs in the AUCinf group showed significant associations (P<0.05). Among those significant SNPs, 1,498 SNPs from the Cmax group, 65 SNPs from the Tmax group, and 1,491 SNPs from the AUCinf group showed highly significant associations with each parameter (Table 2, 3 and 4, P<0.0001). All data were adjusted for age, height, and weight. For clinical pharmacological purposes, significant SNPs encoding phase I and II drug metabolizing enzymes were selected for further analysis.
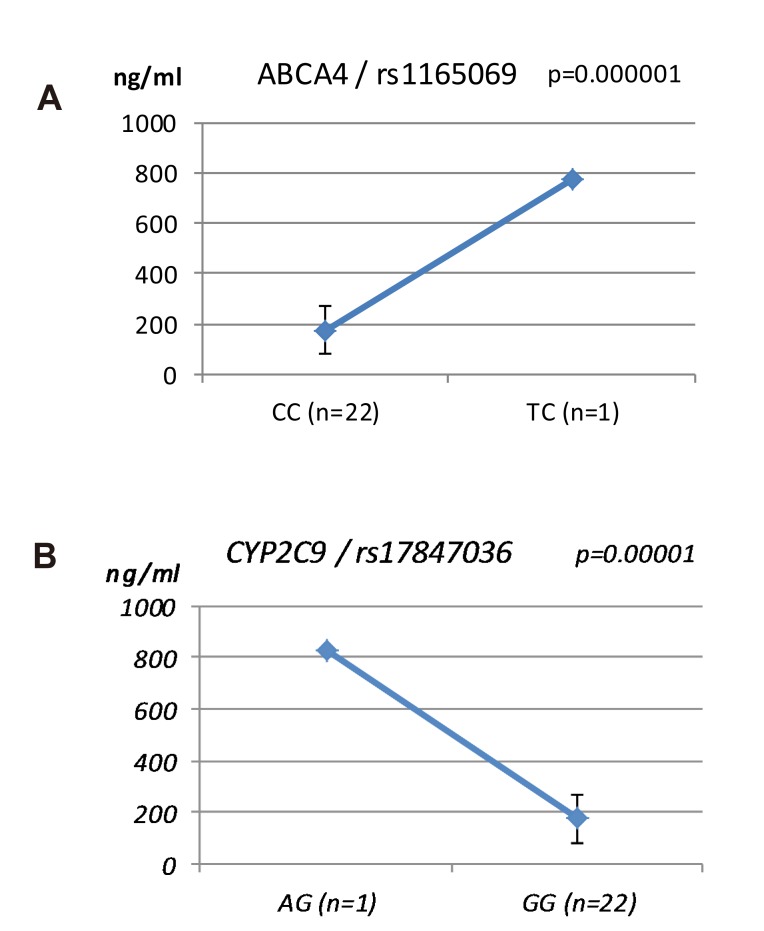
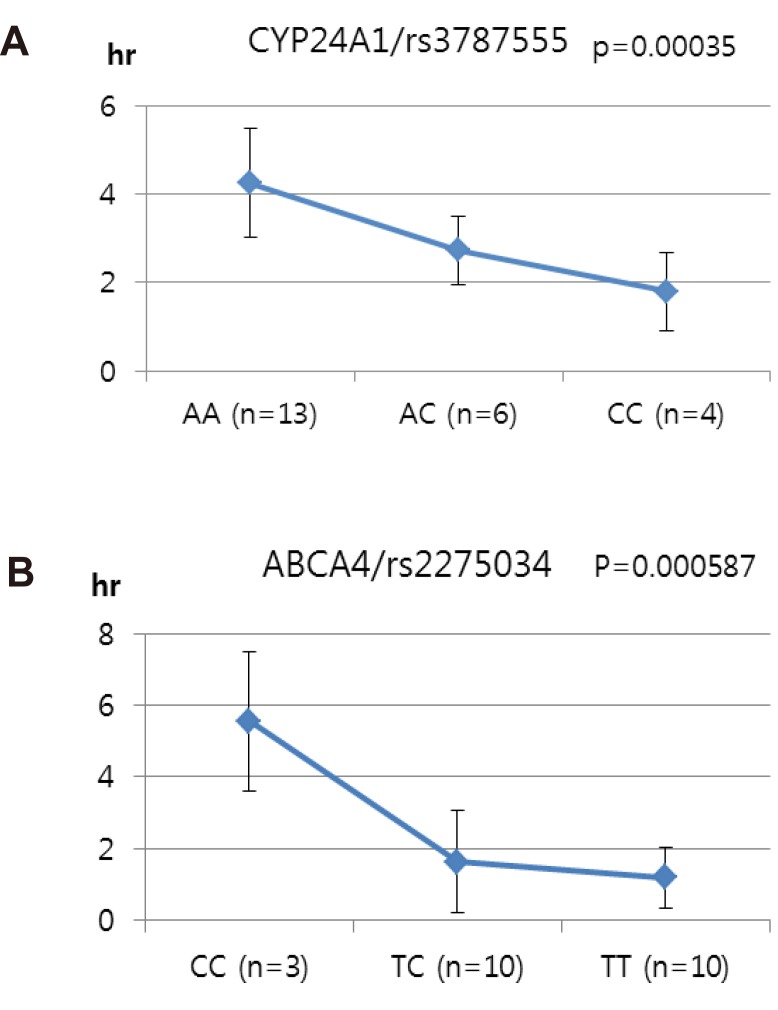
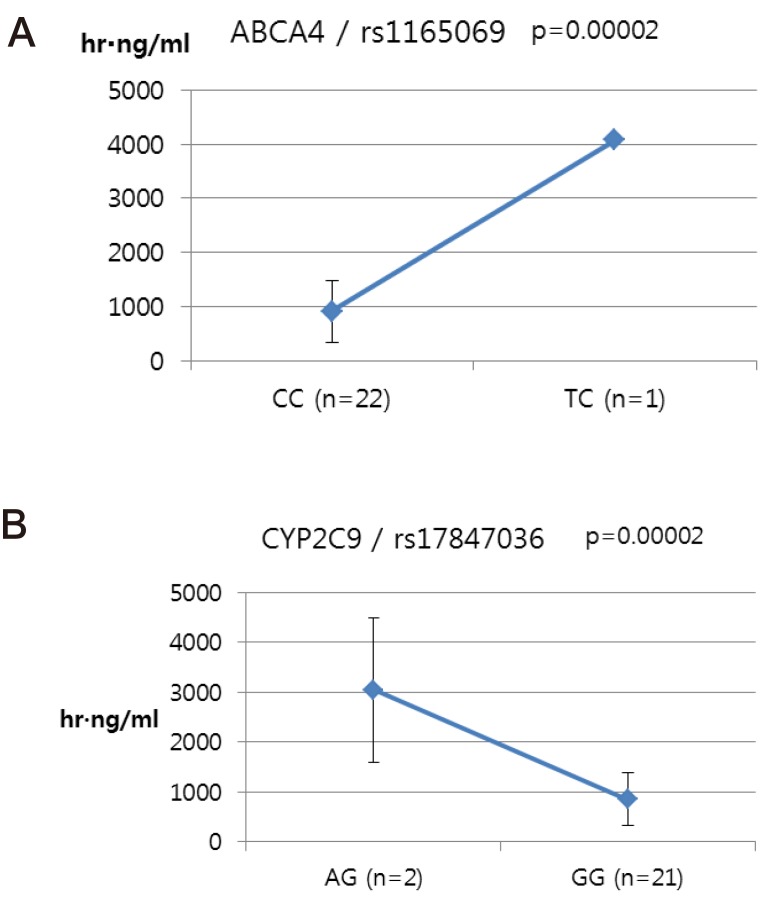
We selected two SNPs for further analysis from the Cmax group (rs11165069 from ABCA4; rs17847036 from CYP2C9 Table 2), the Tmax group (rs3787555 from CYP24A1; rs2275034 from ABCA4, Table 3), and the AUCinf group (rs11165069 from ABCA4; rs12461006 from SLC1A6, Table 4).
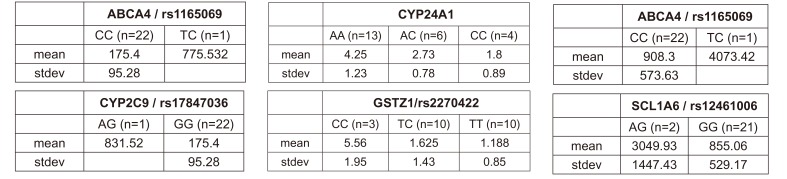
ABCA4 (rs11165069, P = 0.000001 in Cmax group; rs2275034, P = 0.000587 in the Tmax group; rs11165069, P = 0.00002 in AUCinf group) showed statistically significant changes by genotype (Fig. 1, 2, and 3 and Table 5). ABCA4 gene polymorphisms affect talniflumate PK parameters. These data show that genetic polymorphism of ABCA4 has a profound effect on the PK of talniflumate.
In the Cmax group, CYP2C9 rs17847036 showed statistically significant changes according to genotype; the AG genotype exhibited a greater Cmax value (Fig. 1 and Table 5).
In the Tmax group, CYP24A1 rs37875551 with an AA genotype showed more than 2-fold increase in Tmax than the CC genotype. ABCA4 rs2275034, with a CC genotype showed a 2-fold increase in Tmax compared to the TT genotype (Fig. 2 and Table 5).
In the AUCinf group, ABCA4 rs11165069 with a TC genotype showed a greater than 4-fold increase in AUCinf than the CC genotype. SLC1A6 rs12461006 with an AG genotype showed a 3-fold increase in AUCinf group compared to the GG genotype (Fig. 3 and Table 5).

Discussion

Many factors affect talniflumate blood concentration, such as diet, age, liver function and disease condition. The genes involved in the process of drug absorption, distribution, metabolism and excretion may affect the PK of talniflumate [101314] but the effect of pharmacogenetics factors has yet to be investigated. In this study, we performed whole genome association studies and regression analysis to investigate the genetic factors influencing the PK of talniflumate.
Regression analysis of significant SNPs and SNPs of candidate genes revealed several SNPs which significantly affect the PK of talniflumate. Interestingly, although SNPs of ABCA4 have low frequency, their effect was significant, resulting in increases in Cmax, Tmax and AUCinf. Although these results were only obtained via screening studies, they are the first data concerning the influence of genes, including those responsible for metabolizing enzymes and transporters, on the PK of talniflumate.
We identified the significant association of SNP rs11165069 (P=0.000001) (Fig. 1A) in intron 24 of the transporter gene ABCA4 with the Cmax and AUCinf of talniflumate. In our study, ABCA4 (rs1165069) with a TC increased the absorption of talniflumate by approximately four times compared to the CC genotype. Therefore, the TC genotype resulted in greater Cmax (0.000001) and AUCinf (P=0.00002) values. However, because of the low frequency of the TC genotype of ABCA4 rs11165069, further analysis is required. Furthermore, subjects in the Tmax group with the minor C allele of the intron 37 SNP rs2275034 (P=0.00058) (Fig. 2B) of ABCA4 showed a more than 2-fold delayed Tmax. From the result, it can be assumed that ABCA4 can affect the absorption of talniflumate and it is possible that the PK parameters can vary according to genotype.
Subjects with the minor A allele of the synonymous exon 2 SNP rs17847036 (P=0.000001) of the phase I enzyme gene CYP2C9 showed an increase in Cmax (Fig. 1B). It is well understood that CYP2C9 influences the metabolism of drug types [15] and these results indicate that the genotype of CYP2C9 could influence talniflumate plasma concentration.
Other genes, such as CYP24A1 (rs3787555) and SLC1A6 (rs12461006), showed significant associations with the PK of talniflumate, influencing Tmax and AUCinf, respectively.
To the best of our knowledge, this is the first whole genome association study regarding the PK of talniflumate. However, the limitations of this study must be acknowledged. As this was a screening study, we performed only univariate analysis between genotypes and PK parameters. Therefore, further confirmative study on the PK of talniflumate with subgroup analysis according to genotypes is required. In conclusion, this study is useful in explaining why the PK of talniflumate may vary depending on the individual. As several additional drugs and enzymes may also influence talniflumate metabolism, we propose that genetic differences are major contributing factors in the PK of this drug.

Acknowledgements

None.

Notes

Conflicts of interests: -Authors: The authors declare no conflict of interest.

-Reviewers: Nothing to declare

-Editors: Nothing to declare

Reviewer: This article was reviewed by peer experts who are not TCP editors. Because the manuscript was authored by one of editors of TCP, he was not involved in any of the editorial process according to the transparency policies of TCP.

References

1. Lee HW, Won KJ, Cho SH, Ha YH, Park WS, Yim HT, et al. Quantitation of niflumic acid in human plasma by high-performance liquid chromatography with ultraviolet absorbance detection and its application to a bioequivalence study of talniflumate tablets. J Chromatogr B Analyt Technol Biomed Life Sci. 2005; 821:215–220.
crossref
2. Knight D. Talniflumate (Genaera). Curr Opin Investig Drugs. 2004; 5:557–562.
3. Lan SJ, Chando TJ, Weliky I, Schreiber EC. Metabolism of niflumic acid-14C: absorption, excretion and biotransformation by human and dog. J Pharmacol Exp Ther. 1973; 186:323–330. PMID: 4719785.
4. Los M, Boned JE, Piccininali C. New esters of substituted anilinonicotinic and phenylanthranilic acids. Farmaco Sci. 1981; 36:372–385. PMID: 7238853.
5. Evans WE, McLeod HL. Pharmacogenomics--drug disposition, drug targets, and side effects. N Engl J Med. 2003; 348:538–549. PMID: 12571262.
6. Voisey J, Morris CP. SNP technologies for drug discovery: a current review. Curr Drug Discov Technol. 2008; 5:230–235. PMID: 18690891.
crossref
7. Gardiner SJ, Begg EJ. Pharmacogenetics, drug-metabolizing enzymes, and clinical practice. Pharmacol Rev. 2006; 58:521–590. PMID: 16968950.
crossref
8. Iyer KR, Sinz MW. Characterization of Phase I and Phase II hepatic drug metabolism activities in a panel of human liver preparations. Chem Biol Interact. 1999; 118:151–169. PMID: 10359459.
crossref
9. McLean C, Wilson A, Kim RB. Impact of Transporter Polymorphisms on Drug Development: Is It Clinically Significant? J Clin Pharmacol. 2016; 56(Suppl 7):S40–S58. DOI: 10.1002/jcph.691. PMID: 27385178.
crossref
10. Daly TM, Dumaual CM, Miao X, Farmen MW, Njau RK, Fu DJ, et al. Multiplex assay for comprehensive genotyping of genes involved in drug metabolism, excretion, and transport. Clin Chem. 2007; 53:1222–1230. PMID: 17510302.
crossref
11. Im S, Kim BH, Lee K, Kwack K, Yim SV. Screening study for genetic polymorphisms affecting pharmacokinetics of simvastatin. Transl Clin Pharmacol. 2016; 24:43–54.
crossref
12. Yun JY, Kim BH, Lee JH, Lee K, Kwack K, Yim SV. Screening study for genetic polymorphisms affecting pharmacokinetics of pioglitazone. Transl Clin Pharmacol. 2016; 24:194–202.
crossref
13. Mizuno N, Niwa T, Yotsumoto Y, Sugiyama Y. Impact of drug transporter studies on drug discovery and development. Pharmacol Rev. 2003; 55:425–461. PMID: 12869659.
crossref
14. Müller M. Pharmacogenomics and drug response. Int J Clin Pharmacol Ther. 2003; 41:231–240. PMID: 12816175.
crossref
15. Topić E, Stefanović M, Samardzija M. Association between the CYP2C9 polymorphism and the drug metabolism phenotype. Clin Chem Lab Med. 2004; 42:72–78. PMID: 15061384.
crossref
Figure 1

Results of regression analysis of Cmax group.

tcp-25-166-g001
Figure 2

Results of regression analysis of Tmax group.

tcp-25-166-g002
Figure 3

Results of regression analysis of AUCinf group.

tcp-25-166-g003
Table 1

Demographic characteristics and reference talniflumate pharmacokinetic parameters of volunteers

tcp-25-166-i001
NO. Age Weight/kg Height/cm AUCt AUCinf Cmax Tmax
T1 25 66 180 906.13 999.72 159.44 6.0
T2 26 90 184 622.32 622.32 123.95 4.0
T3 26 69 175 779.54 779.54 145.57 4.0
T4 28 75 171 2347.19 2443.90 437.40 3.0
T5 26 64 168 1517.40 1593.58 250.04 2.5
T6 25 61 171 517.70 583.46 113.53 2.0
T7 28 66 160 472.36 472.36 137.56 1.5
T8 20 57 171 1062.67 1143.30 239.89 4.0
T9 24 58 174 1343.76 1397.23 349.84 2.0
T10 24 68 173 1478.44 1589.52 218.99 6.0
T11 22 72 174 1984.33 2102.38 357.11 4.0
T12 30 68 170 1120.51 1201.74 257.67 3.0
T13 24 85 176 1493.98 1571.46 394.48 4.0
T14 22 62 170 836.85 882.83 164.70 3.0
T15 22 71 177 1087.64 1087.64 178.06 3.0
T16 30 66 175 458.10 517.74 87.99 3.0
T17 35 80 176 600.89 152.32 152.32 2.5
T18 27 73 178 628.44 628.44 193.06 1.5
T19 34 70 168 1798.92 1901.22 489.93 1.5
T20 26 68 174 501.71 501.71 145.15 2.5
T21 24 61 172 447.39 545.75 235.83 2.5
T22 25 58 173 596.64 596.64 125.06 2.0
T23 25 73 177 1743.96 2007.03 355.20 2.5
Mean±S.D 26±3.6 68.7±8.3 173.3±4.8 1058.6±557.1 1100.9±621.9 230.9±113.5 3.0±1.2

Abbreviations: Cmax, maximum measured plasma concentration; Tmax, time of the maximum measured plasma concentration; AUCt, area under the plasma concentration-time curve from time zero to time of last measurable concentration; AUCinf, area under the plasma concentration-time curve from zero to infinity; SD, standard deviation.

Table 2

Highly significant SNPs identified in Cmax group following regression analysis (P<0.0001)

tcp-25-166-i002
Name Chr Gene Location g1 n1 m1 s1 g2 n2 m2 s2 P VALUE
rs11165069 1 ABCA4 intron CC 22 175.40 95.28 TC 1 831.52 0.000001
rs7637682 3 SLC9A10 intron AA 22 175.40 95.28 AG 1 831.52 0.000001
rs4234409 3 SLC9A10 intron AA 22 175.40 95.28 AC 1 831.52 0.000001
rs4434123 3 SLC9A10 missense AA 22 175.40 95.28 AG 1 831.52 0.000001
rs17446282 3 SLC9A10 intron AA 22 175.40 95.28 AG 1 831.52 0.000001
rs2291550 12 ABCC9 synonymous CC 22 175.40 95.28 TC 1 831.52 0.000001
rs1051640 17 ABCC3 synonymous AA 22 175.40 95.28 AG 1 831.52 0.000001
rs757220 19 SLC25A42 intron CC 22 175.40 95.28 TC 1 831.52 0.000001
rs12150890 19 SLC7A9 synonymous AA 22 175.40 95.28 AG 1 831.52 0.000001
rs17724104 20 SLC9A8 intron AA 22 175.40 95.28 AG 1 831.52 0.000001
rs6781844 3 SLC9A10 missense TG 1 831.52 TT 22 175.40 95.28 0.000001
rs9855755 3 SLC9A10 intron AG 1 831.52 GG 22 175.40 95.28 0.000001
rs4646196 5 SLC22A4 intron AG 1 831.52 GG 22 175.40 95.28 0.000001
rs17847036 10 CYP2C9 synonymous AG 1 831.52 GG 22 175.40 95.28 0.000001
rs7248399 19 SLC25A42 intron AG 1 831.52 GG 22 175.40 95.28 0.000001
rs10417974 19 SLC25A42 3UTR TC 1 831.52 TT 22 175.40 95.28 0.000001
rs215096 16 ABCC1 intron TC 3 527.07 264.40 TT 20 155.45 73.41 0.000015

Abbreviations: Chr, chromosome; N, number; g1, genotype 1; n1, number 1; s1, standard deviation 1; g2, genotype 2; n2, number 2; s2, standard deviation 2. *Table only shows several significant SNPs from a total of 1498 highly significant SNPs.

Table 3

Highly significant SNPs identified in Tmax group following regression analysis (P<0.0001)

tcp-25-166-i003
Name chr Gene Location g1 n1 m1 s1 g2 n2 m2 s2 g3 n3 m3 s3 P VALUE
rs2072219 7 DNAH11 intron AC 4 6.00 0.00 CC 19 2.84 0.94 0.00000
rs2084789 16 A2BP1 intron AA 3 6.00 0.00 AG 2 5.00 1.41 GG 18 2.78 0.93 0.00000
rs8008333 14 RAD51L1 intron AA 18 2.78 0.93 AG 5 5.60 0.89 0.00001
rs4370152 4 LOC729112 intron AA 13 2.46 0.85 AG 8 4.25 1.16 GG 2 6.00 0.00 0.00001
rs770297 5 CDH18 3flanking CC 2 6.00 0.00 TC 3 5.33 1.15 TT 18 2.78 0.93 0.00001
rs10899786 10 RASGEF1A intron AA 7 5.00 1.29 AG 10 3.10 0.91 GG 6 2.00 0.45 0.00001
rs2503853 10 RASGEF1A intron AA 7 5.00 1.29 AG 11 3.05 0.88 GG 5 1.90 0.42 0.00001
rs3781832 11 SORL1 intron GG 8 2.13 0.64 TG 10 3.50 1.15 TT 5 5.20 1.10 0.00002
rs2452600 4 PDLIM5 missense CC 6 2.08 0.38 TC 14 3.39 1.16 TT 3 6.00 0.00 0.00002
rs7794797 7 CACNA2D1 intron AA 11 4.55 1.21 AG 12 2.33 0.75 0.00003
rs6534295 4 LOC729112 intron CC 10 2.25 0.79 TC 10 3.95 1.21 TT 3 5.33 1.15 0.00004
rs1158024 4 LOC729112 intron CC 3 5.33 1.15 TC 10 3.95 1.21 TT 10 2.25 0.79 0.00004
rs12646248 4 LOC729112 intron AA 10 2.25 0.79 AG 10 3.95 1.21 GG 3 5.33 1.15 0.00004
rs13119523 4 LOC729112 intron CC 10 2.25 0.79 TC 10 3.95 1.21 TT 3 5.33 1.15 0.00004
rs12403933 1 C1orf125 intron AA 13 2.54 0.85 AG 8 4.13 1.36 GG 2 6.00 0.00 0.00004
rs3781834 11 SORL1 intron AA 9 2.17 0.61 AG 11 3.86 1.27 GG 3 5.33 1.15 0.00004
rs17125523 11 SORL1 intron AA 9 2.17 0.61 AG 11 3.86 1.27 GG 3 5.33 1.15 0.00004
rs12287339 11 SORL1 intron CC 3 5.33 1.15 TC 11 3.86 1.27 TT 9 2.17 0.61 0.00004
rs722074 16 XYLT1 intron CC 2 6.00 0.00 TC 10 3.95 1.30 TT 11 2.41 0.80 0.00005
rs6848730 4 MIST intron GG 2 6.00 0.00 TG 5 4.50 1.50 TT 16 2.72 0.93 0.00005
rs187985 7 IGF2BP3 intron CC 1 6.00 TC 6 4.83 1.33 TT 16 2.69 0.93 0.00006
rs7728604 5 SLIT3 intron CC 12 2.54 0.89 TC 7 3.64 1.31 TT 4 5.50 1.00 0.00007
rs532841 8 DLC1 missense CC 5 5.20 1.10 TC 12 3.29 1.16 TT 6 2.08 0.74 0.00008
rs2136638 2 CDKL4 intron CC 14 2.57 0.83 TC 8 4.50 1.41 TT 1 6.00 0.00008
rs2302677 16 RPGRIP1L missense CC 18 2.83 0.97 TC 5 5.40 1.34 0.00009
rs9934800 16 RPGRIP1L intron TC 5 5.40 1.34 TT 18 2.83 0.97 0.00009

Abbreviations: Chr, chromosome; N, number; g1, genotype 1; n1, number 1; s1, standard deviation 1; g2, genotype 2; n2, number 2; s2, standard deviation 2; g3, genotype 3; n3, number 3; s3; standard deviation. 3 *Table only shows several SNPs from a total of 65 highly significant SNPs.

Table 4

Highly significant SNPs identified in AUCinf group following regression analysis (P<0.0001)

tcp-25-166-i004
Name chr Gene Location g1 n1 m1 s1 g2 n2 m2 s2 P VALUE
rs11165069 1 ABCA4 intron CC 22 908.30 573.63 TC 1 4073.42 0.00002
rs1051640 17 ABCC3 synonymous AA 22 908.30 573.63 AG 1 4073.42 0.00002
rs2291550 12 ABCC9 synonymous CC 22 908.30 573.63 TC 1 4073.42 0.00002
rs17847036 10 CYP2C9 synonymous AG 1 4073.42 GG 22 908.30 573.63 0.00002
rs12461006 19 SLC1A6 intron AG 2 3049.93 1447.43 GG 21 855.06 529.17 0.00008
rs4646196 5 SLC22A4 intron AG 1 4073.42 GG 22 908.30 573.63 0.00002
rs757220 19 SLC25A42 intron CC 22 908.30 573.63 TC 1 4073.42 0.00002
rs7248399 19 SLC25A42 intron AG 1 4073.42 GG 22 908.30 573.63 0.00002
rs10417974 19 SLC25A42 3UTR TC 1 4073.42 TT 22 908.30 573.63 0.00002
rs4980343 15 SLC28A1 intron AG 1 4073.42 GG 22 908.30 573.63 0.00002
rs12150890 19 SLC7A9 synonymous AA 22 908.30 573.63 AG 1 4073.42 0.00002
rs7637682 3 SLC9A10 intron AA 22 908.30 573.63 AG 1 4073.42 0.00002
rs4234409 3 SLC9A10 intron AA 22 908.30 573.63 AC 1 4073.42 0.00002
rs4434123 3 SLC9A10 missense AA 22 908.30 573.63 AG 1 4073.42 0.00002
rs17446282 3 SLC9A10 intron AA 22 908.30 573.63 AG 1 4073.42 0.00002
rs6781844 3 SLC9A10 missense TG 1 4073.42 TT 22 908.30 573.63 0.00002
rs9855755 3 SLC9A10 intron AG 1 4073.42 GG 22 908.30 573.63 0.00002
rs17724104 20 SLC9A8 intron AA 22 908.30 573.63 AG 1 4073.42 0.00002

Abbreviations: Chr, chromosome; N, number, g1, genotype 1, n1, number 1; s1, standard deviation 1; g2, genotype 2; n2, number 2; s2, standard deviation 2 *Table only shows several SNPs from a total of 1498 highly significant SNPs.

Table 5

Summary of regression Analysis

tcp-25-166-i005
A. Results of Cmax group (ng/ml) B. Results of Tmax group (Hhr) C. Results of AUCinf group (hr·ng/ml)
ABCA4 / rs1165069 CYP24A1 ABCA4 / rs1165069
CC (n=22) TC (n=1) AA (n=13) AC (n=6) CC (n=4) CC (n=22) TC (n=1)
mean 175.4 775.532 mean 4.25 2.73 1.8 mean 908.3 4073.42
stdev 95.28 stdev 1.23 0.78 0.89 stdev 573.63
CYP2C9 / rs17847036 GSTZ1/rs2270422 SCL1A6 / rs12461006
AG (n=1) GG (n=22) CC (n=3) TC (n=10) TT (n=10) AG (n=2) GG (n=21)
mean 831.52 175.4 mean 5.56 1.625 1.188 mean 3049.93 855.06
stdev 95.28 stdev 1.95 1.43 0.85 stdev 1447.43 529.17
TOOLS
Similar articles