

 PDF
PDF ePub
ePub Citation
 Print
Print


Introduction
Chronic obstructive pulmonary disease (COPD) is a type of progressive, obstructive lung disease characterized by long-term poor airflow due to pulmonary and systemic inflammation. Common signs and symptoms of COPD include mucinous cough, shortness of breath, wheezing, and chest tightness. The cause of COPD is usually the long term exposure to lung irritants that damage the lungs and the airways such as cigarette smoke. COPD is currently ranked as the 4th leading cause of mortality worldwide and projected to be the 3rd leading cause of death by the year 2020.[1]
There is no definite cure for COPD, but the symptoms are treatable and its progression could be delayed by using inhaled drugs. Orally inhaled fluticasone (FTS), salmeterol (SM), and tiotropium (TTP) are widely used to relieve the symptoms of COPD. FTS, an inhaled corticosteroid, prevents COPD exacerbation through its anti-inflammatory action. SM and TTP, which are a long-acting β2 adrenergic receptor agonist and a long-acting antimuscarinic bronchodilator, respectively, inhibit parasympathetic activity, which is followed by bronchial smooth muscle relaxation and a decrease in the release of mucus into the airway lumen.[23]
Many different combinations among FTS, SM, and TTP have been studied lately. In particular, The Canadian Optimal Therapy of COPD trial undertaken in 2004 revealed better improvements in lung function, quality of life, and hospitalization rate in moderate to severe COPD patients treated with a three drug combination (FTS + SM + TTP) than the improvements in patients treated with a two-drug combination (TTP + SM or TTP + placebo). Consequently, a combination of TTP and a drug formulation combining FTS and SM is commonly used to treat COPD in clinical situations.[3]
Although diverse pharmacokinetic (PK) data for FTS, SM, and TTP have been reported, there are no PK data after concurrent inhalation of those three drugs. In this study, we aimed to investigate the PK characteristics of FTS, SM, and TTP after concomitant inhalation of TTP (18 µg) and a combination formulation of FTS/SM (250/50 µg).
Methods
Study design and subjects
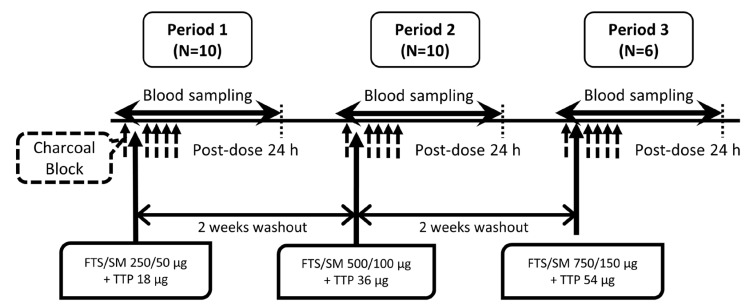
The present study was designed as an open-label, single-arm, three-period, single ascending dose study. Korean male volunteers were eligible for the study if they were 19-45 years of age, weighed at least 55 kg, and had a body mass index of 18.0–27.0 kg/m2. Subjects were excluded if they had a history of or current clinically significant abnormalities based on medical history, physical examination, and clinical laboratory tests. In addition, subjects who smoked within the 6 months before the first dose were also excluded. The study protocol was reviewed and approved by the Institutional Review Board of Seoul National University Hospital (ClinicalTrials.gov registry number: NCT02441114). Written informed consent was obtained from subjects before any study-related procedure was performed, and the study was conducted according to the ethical principles of the Declaration of Helsinki and the Korean Good Clinical Practice Guidelines.
The subjects who met the screening criteria were admitted to the Clinical Trials Center at Seoul National University Hospital for 3 days in each treatment period, with a 14-day washout between periods. The study drugs were Seretide 250 Diskus® (GlaxoSmithKline, South Korea) which is a combination formulation of FTS/SM 250/50 µg (72.5 µg as salmeterol xinafoate), and Spiriva® HandiHaler® (Boehringer Ingelheim, South Korea) which contains 18 µg TTP (22.5 µg as tiotropium bromide). Singles dose of Seretide (FTS/SM 250/50 µg) and Spiriva (TTP 18 µg) were concomitantly inhaled in treatment period 1, and the dose of each drug was escalated by two-fold (FTS/SM 500/100 µg and TTP 36 µg) and three-fold (FTS/SM 750/150 µg and TTP 54 µg) in periods 2 and 3, respectively. The time taken for total inhalation was less than 2 min. In addition, Charcodote® (activated charcoal /sorbitol 50/140 g per 250 mL, Pharmascience, Canada) was orally administered to block the gastrointestinal absorption of the inhaled drugs as previously described: 5 g of Charcodote was administered at 2 min before and after inhalation, and a further 10 g was given at 1, 2, and 3 h after inhalation.[4] Blood samples for PK assessments were collected at 0, 0.03, 0.08, 0.17, 0.33, 0.5, 0.75, 1, 1.5, 2, 3, 4, 6, 8, 10, 12, and 24 h after inhalation (Fig. 1).
Quantification of plasma fluticasone, salmeterol, and tiotropium
Plasma concentrations of FTS, SM, and TTP were determined by using liquid chromatography with tandem mass spectrometry (LC/MS-MS): Shimadzu Prominence LC API 5000 (Shimadzu, Japan) coupled with TA5500, 5500 QTRAP MS (AB SCIEX, USA) for FTS and SM; Prominence UFLC XR (Shimadzu, Japan) coupled with 5500QTRAP, TQ5500 MS (AB SCIEX, USA) for TTP.
The internal standard material (IS) of FTS was fluticasone propionate-d3. The LC column was C18 (2.1 mm i.d. × 50 mm; particle size 1.7 µm) and ion mode of MS/MS was APCI (atmospheric pressure chemical ionization; positive ion mode). The IS of SM was salmeterol-d3. The LC column was C18 (2.1 mm i.d. × 100 mm; particle size 3 µm) and the MS/MS condition was ESI (electrospray; positive ion mode). The FTS or SM sample (500 µL) along with IS standard solution (10 µL; 50 ng/mL) and ethyl ether (3 mL) were placed in a polypropylene tube. After vortexing for 5 min, the mixture was centrifuged at 3,000 rpm for 5 min. When the organic layer was fully dried, it was dissolved by adding 150 µL of 50% acetonitrile solution and then centrifuged at 13,000 rpm for 5 min. Product ion m/z for FTS was selected as 293.25 and that for SM was 380.4.
The IS for TTP was tiotropium-d3 bromide. The LC column was phenyl (2.1 mm i.d. × 100 mm; particle size 1.8 µm) and the MS/MS condition was ESI (positive ion mode). The TTP sample (400 µL) along with IS standard solution (10 µL; 10 ng/mL) and acetonitrile (1.2 mL) were added to a polypropylene tube. After mixing for 1 min, the mixture was centrifuged at 3,000 rpm for 5 min. The upper layer was separated by adding 2 mL of dichloromethane followed by 1 min of mixing and centrifuging at 4,000 rpm for 5 min. When the organic layer was fully dried, it was dissolved by adding 100 µL of 50% acetonitrile and then centrifuged at 13,000 rpm for 5 min. Product ion m/z for TTP was selected as 155.1.
Calibration curves showed linearity from the lower limit of quantification (LLOQ) to the upper limit of quantification in all three drugs: 2–200 pg/mL for FTS and SM; and 1–100 pg/mL for TTP. Coefficients of variation (CV) for precision and accuracy of quality control samples were below 15%, while that of the quantification control samples was below 20% for the LLOQ. These results indicate that the bioanalytical method was accurate and precise.
PK analysis
The PK parameters were calculated by using Phoenix® Win-Nonlin® (Version 6.3; Pharsight, Mountain View, CA, USA) with the non-compartmental method. Maximum plasma concentration (Cmax) and the time to reach Cmax (Tmax) were obtained directly from the observed values. Area under the plasma concentration versus time curve from dosing to the last quantifiable concentration (AUClast) was calculated using the linear trapezoidal method for ascending concentrations and the log trapezoidal method for descending concentrations. Extrapolation beyond the last plasma concentration was performed to gain AUC from the time zero to infinity (AUCinf). For additional information on the early phase exposure of TTP, the AUC from the time zero to 30 min (AUC0-30min) was calculated. The elimination half-life (t1/2) was calculated as the natural logarithm of 2 divided by λz, where λz is the terminal elimination rate constant estimated from a regression line of log-transformed plasma concentrations versus time over the terminal log-linear portion. Apparent clearance (CL/F) was calculated as dose divided by AUCinf. In addition, dose-normalized Cmax (i.e., Cmax/Dose) and AUC (i.e., AUClast/Dose for FTS and SM, and AUC0-30min/Dose for TTP) were calculated and compared among doses in each drug.
Safety and tolerability assessments
Safety and tolerability was assessed for all subjects who underwent test drug administration at least once. The frequency and aspect of adverse events (AEs) were reviewed generally by integrating the physical examination, vital sign, electrocardiogram, and laboratory test results. Furthermore, the severity of AEs and their relationship to the test drugs were assessed.
Statistical analysis
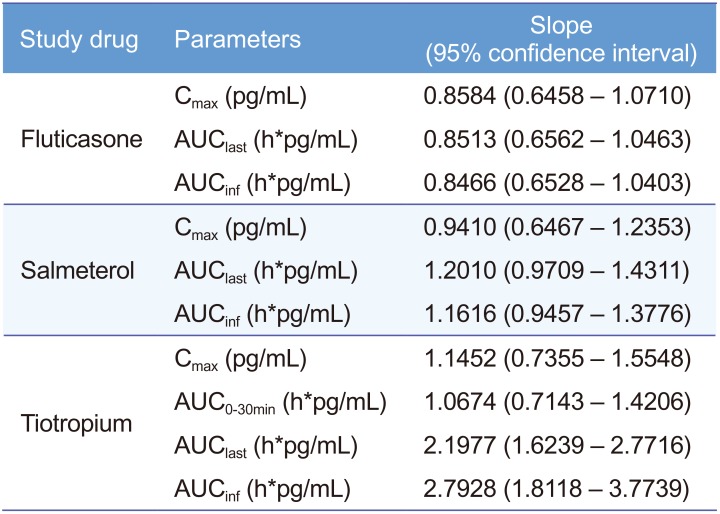
Statistical analyses were performed by using the SAS program (Version 9.4; SAS Institute, Cary, NC, USA). Dose proportionality analysis on Cmax, AUClast, AUCinf, and AUC0-30min were carried out by performing log-transformed data regressions (linear regression using a power model).[5] When the 95% confidence interval (CI) for the slope of the graph included 1, the drug was considered to have dose-proportional PK characteristics.[6]
Results
Subjects
Sixteen healthy Korean male volunteers were screened, and 10 subjects were enrolled in the study. Subject age ranged from 21 to 38 years, and mean height and weight ranges were 162.3–185.2 cm and 55.5–87.7 kg, respectively. Four subjects withdrew consent before admission to the third dosing period for private reasons; the other six subjects completed the study as per protocol. Consequently, the PK analysis was conducted for total 10 subjects for period 1 (FTS/SM 250/50 µg + TTP 18 µg) and period 2 (FTS/SM 500/100 µg + TTP 36 µg), whereas 6 subjects were included in the analysis for period 3 (FTS/SM 750/150 µg + TTP 54 µg).
PK results
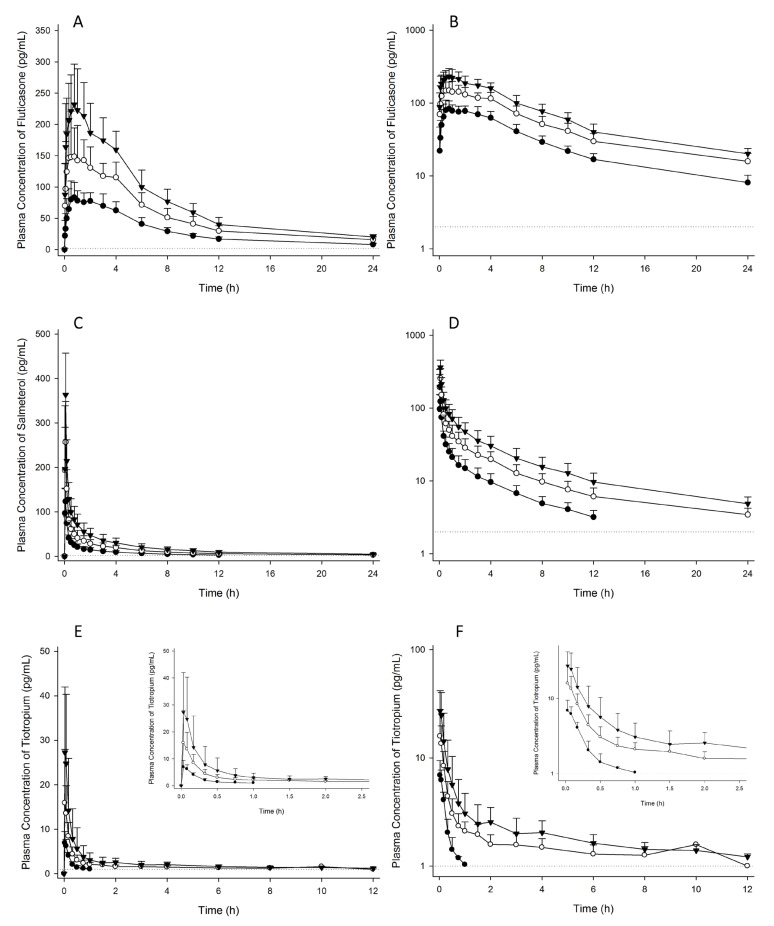
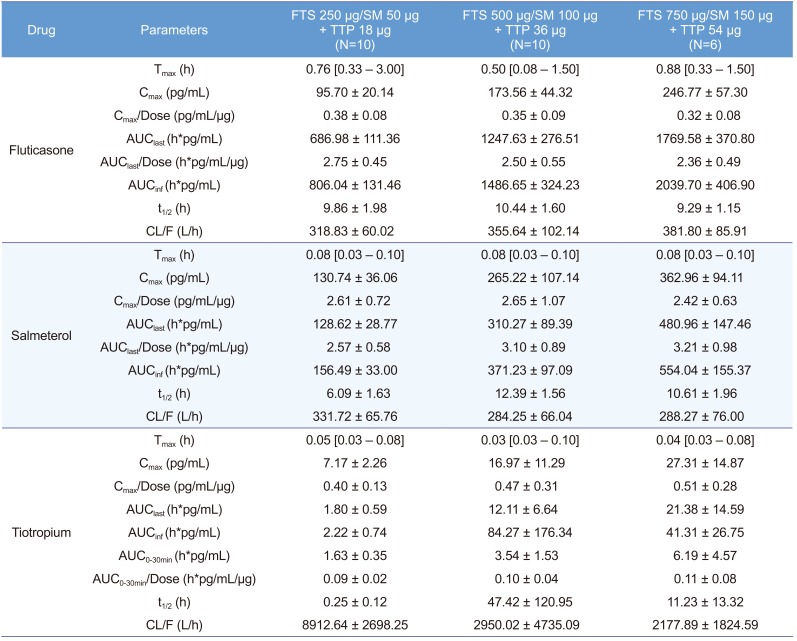
Concentrations of FTS, SM, and TTP were detectable in plasma within 2 min after concomitant inhalation (Fig. 2). FTS was rapidly absorbed resulting in a Tmax of 0.08–3.00 h and a mean t1/2 ranged of 9.29–10.44 h, which were similar for each dose. The plasma concentrations of SM increased rapidly with a Tmax of 0.03–0.10 h followed by a decline in a multi-phasic manner with a mean t1/2 of 6.09–12.39 h for each dose (Table 1). The Tmax of TTP was achieved within 0.03-0.05 h after inhalation and the plasma concentrations declined rapidly, resulting in a level below the LLOQ at 24 h in all dosages. Especially for the first dose (18 µg), plasma concentrations of TTP was lower than LLOQ in all subjects after 1.5 h.
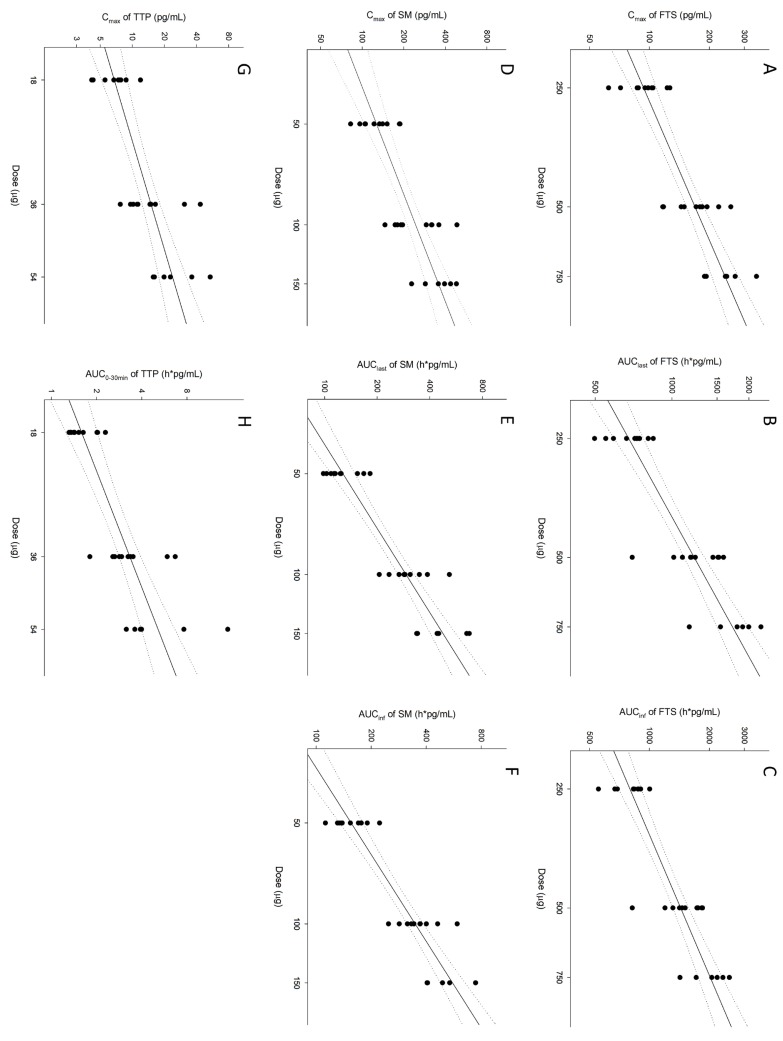
For FTS and SM, systemic exposure levels (i.e., Cmax and AUC) via pulmonary absorption increased in dose-proportional manners as the inhaled dose increased from 250 to 750 µg for FTS and 50-150 µg for SM, respectively (Fig. 3). The estimates of curve slopes in the power model for Cmax and AUC were not significantly different from 1 for both FTS and SM (Table 2). For TTP, however, AUClast and AUCinf did not satisfy the dose-proportionality criteria. Nevertheless, TTP exposure in the early phase showed a dose-proportional increase in dose range of 18-54 µg, which was confirmed by the 95% CI of slope in power model for Cmax and AUC0-30min including 1. In addition, dose-normalized PK parameters were similar among doses (Table 1 and Supplementary Fig. 1).
Safety profiles and tolerability
There were 37 reports of AEs among the 10 subjects, and all AEs were assessed as not being-related to the test drug. The most common AE was diarrhea (i.e., 27 cases among the 10 subjects), and those AE were assessed to be related to the sorbitol that was contained in the Charcodote®. There was no clinically significant abnormality in physical examinations, vital signs, electrocardiograms or laboratory test results during the study.
Discussion
Although there are many reports on studies comparing the effects of FTS, SM, and TTP,[789] there are no reports assessing PK characteristics when all three drugs are administered concurrently. To describe the pharmacokinetic-pharmacodynamic relationship of drug, PK studies need to be performed. This study is the first pilot study to evaluate PK characteristics via lung absorption when FTS, SM, and TTP were inhaled concomitantly. In this study, the plasma concentrations of drugs were measurable allowing estimation of lung exposure through systemic exposures.
One of the main characteristics of COPD is chronic lung inflammation and airway remodeling,[10] and it has recently been shown that airway inflammation resides not only in the larger airways but also in the peripheral airways.[11] Therefore, elucidating the local effects of drugs in the lung are important in the treatment of COPD. For the accurate estimation of local effects of drugs, there is a need to evaluate the pulmonary exposure of the drug. However, there is no appropriate method for evaluating pulmonary exposure directly. Regardless, systemic exposure of orally inhaled drug is probably related to the drug passing through the alveolar-capillary interface and into the mucosal and submucosal vessels.[2] Thus, systemic exposure could reflect pulmonary exposure, and it is appropriate to evaluate pulmonary exposure by measuring plasma concentrations. Orally inhaled drugs can also be absorbed by the gastrointestinal (GI) tract. In this study, to block GI tract absorption of drugs, we coadministered activated charcoal. In general, charcoal co-administration is important if the objective of a trial is to evaluate the relative contributions of oral and pulmonary absorption to the total systemic exposure of a drug.[12] Therefore, concomitant administration of activated charcoal was an appropriate method to block the GI tract absorption of the test drugs in this study.
The results of this study revealed a TTP t1/2 of up to 47.4 h, which is notably shorter than the previous reported TTP t1/2 of 5–6 days.[1314] However, the previous reported t1/2 was estimated from the calculated geometric mean TTP concentrations which were standardized to dose of 10 µg assuming dose-proportional PK of TTP. Although the LLOQ was lowered in this study (i.e., 1 pg/mL) compared to that of previous study (i.e., 4.8 pg/ml), the concentrations of TTP after 12 h in all subjects were below the LLOQ resulting in a lack of information about the elimination phase. Therefore, further assessment with a lower LLOQ is required to investigate more accurate elimination characteristics of TTP.
The PK characteristics of FTS, SM and TTP could have some differences in COPD patients. Systemic availability of FTS is reported to be substantially lower in moderate to severe asthma patients than in healthy controls.[15] When COPD patients inhaled 500 µg of FTS, its t1/2 was shorter and Tmax was larger than those in this study. Furthermore, when COPD patients inhaled 50 µg of SM, t1/2 was longer and Tmax was larger than those observed in the present study.[716] Based on these results, direct extrapolation of this study to COPD patients may have limitations. Nonetheless, it is important to evaluate the inherent PK characteristics in healthy subjects, an approach that excludes drug-drug interactions with concomitant medications taken by patients. Although FTS, SM, and TTP were concomitantly used in this pilot study, there was no control group for each drug, which makes it difficult to evaluate the exact drug-drug interactions.
In conclusion, PK evaluation of systemic drug exposure was possible when FTS, SM, and TTP were orally inhaled concurrently. FTS and SM showed dose-proportional PK profiles between 250-750 µg and 50-150 µg, respectively. In addition, TTP exhibited dose-proportionality in early phase exposure (i.e., AUC0-30min) between 18-54 µg.
 XML Download