

 PDF
PDF ePub
ePub Citation
 Print
Print


Introduction
The role of pharmacokinetic (PK) and pharmacodynamic (PD) modeling and simulation is expanding in almost all drug development processes, from non-clinical to different phases of clinical trials.[1] The number of regulatory decisions, including new drug approval and labeling, that were effected by pharmacometric analysis increased from 45 submissions between 2000 and 2004 to 87 submissions between 2007 and 2008.[23] The population approach or pharmacometric analysis based on computational methods is being applied to bridging studies, proof of concept studies for go/no-go decision, simulation for dose selection or study design, and extension to other indications (drug repositioning), among many others.[1] PK/PD modeling and simulation is also used for individualized pharmacotherapy based on relevant demographic factors including race, age, sex, weight, height and genotype.[45]
Pharmacometric analysis usually relies on non-linear mixed effect models to explain and quantify time-varying PK/PD parameters, disease progression, and their relationships based on population data. Pharmacokinetic models describe the change of drug concentration over time and pharmacodynamic models quantify the relationship between concentration and effect. PK/ PD models link PK models to PD models using direct effect models, effect compartment models, or indirect response models.[67] This mathematical method is also used for constructing disease progression models comprising the natural history of a disease and drug effect.[8] Emax models play important roles in describing excitatory or inhibitory exposure-response relationship. Sigmoid Emax models, also known as Hill equations, have successfully explained pharmacodynamics of many drugs with Hill coefficients determining sigmoidicity or sensitivity between exposure and response.[9] However, drug exposure often does not cover the higher range of values required to estimate maximum effect (Emax) since higher concentrations can either result in toxicity or the testing doses in dose escalation study have little information on dose-response surface. This leads to potentially biased or imprecise PD parameter estimates or overly-simplified models such as linear or log-linear models that are not useful for extrapolation.
The purpose of this simulation study is to explore the limitation of the population PK/PD analysis using data from a clinical study and to help to construct an appropriate PK/PD design that enable precise and unbiased estimation of both fixed and random PD parameters in PK/PD analysis under different doses and Hill coefficients.
Methods
PK/PD Simulation and Estimation
In this simulation study, seven doses of virtual drugs with equal potency and efficacy but different Hill coefficients were used for generality of interpretation and comparison among virtual drugs and for easy application to PK/PD modeling and simulation of various drugs in clinical use or development. The seven doses were 12.5, 25, 50, 100, 200, 400, and 800 mg, where each succeeding dose was double the preceding dose. The Hill coefficients were 0.5, 1, 2, 5 and 10. Single and multiple-dose studies were simulated with each of the doses and Hill coefficients. A total of 70 (=7 x 5 x 2) scenarios each with 100 subjects were simulated and then estimated 100 times using SSE (Stochastic simulation and estimation) of PSN (Perl-speaks-NONMEM, version 3.7.6, http://psn.sourceforge.net) and first order conditional estimation with interaction (FOCE-I) method in NONMEM (version 7.2, ICON Development Solutions, Ellicott City, MD, USA). Pharmacokinetic and pharmacodynamic data were simultaneously simulated and estimated using the same model. A one-compartment model with first-order absorption and elimination was used as the PK simulation model. The true values (θ) of the structural PK parameters for ka, CL/F and V/ F were: θka = 1 hr-1, θCL/F = 5 L/hr, θV/F = 100 L, where ka, CL/F and V/F was absorption rate constant, clearance and volume of distribution, respectively.
where C is drug concentration, ke is elimination rate constant, obtained by CL over V, F is bioavailability and D is dose, respectively. The approximate values of the Tmax (the time at which the maximum concentration was observed) for single- and multiple-dose study were 3.15 and 2.78 h, respectively and the half-life was around 13.9 h. The blood sampling time points for dense sampling schedules were 0 (predose), 0.25, 0.5, 0.75, 1, 2, 3, 4, 5, 6, 8, 12, 24, and 48 h after drug administration. The samples at 24 and 48 h were not included for multiple-dose scenarios. The PD measurement time points were equal to those of PK.
A sigmoid Emax model was used for PD simulation based on an assumption that plasma concentration is directly linked to the drug effects, as below. where E is drug effect. The true values (θ) of PD parameters for baseline (E0), efficacy (Emax), potency (EC50) and Hill coefficients (γ) were: θE0 = 1000, θEmax = 10000, θEC50 = 1000 ng/mL, and θγ = 0.5, 1, 2, 5 or 10, respectively. The coefficient of variation (CV%) of random effect for inter-individual variability (IIV) and residual variability (RV) were set at 30% for all PK/PD parameters and 20% for PK/PD observations, respectively. An exponential error model for IIV and RV was applied as follows:
where θi is the ith individual PK/PD parameter, θ is the population mean value, ηi is an instance of a normally distributed random variable η with mean zero and variance of ω2 which represent IIV, γij is the observed concentrations or effect for the ith subjects at time j, is the individual predicted observations for the for the ith subjects at time j,  and ɛij is an instance of a normally distributed random variable ɛ with mean zero and variance of σ2 which represents RV.
 and ɛij is an instance of a normally distributed random variable ɛ with mean zero and variance of σ2 which represents RV.
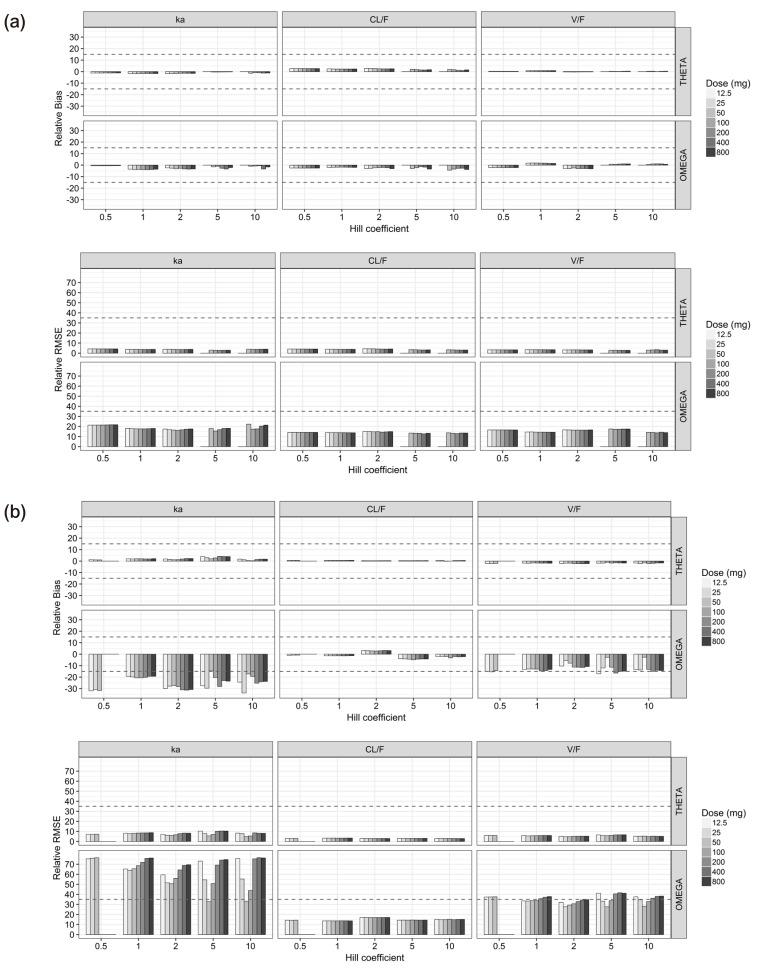
The simulated effect versus concentration plots were used to explore the relationship between concentration and EC50 and whether Emax was attained in each study or not. Simulated concentrations were normalized by true EC50 (=1000 ng/mL) to identify the generalized exposure-response relationship and then “EC50” was used as a unit to express normalized concentra-tions.[1011]
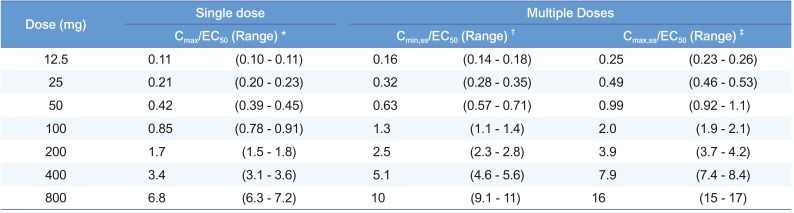
To evaluate the estimation performance for PD parameters at each dosing scenario, the median values and ranges of normalized maximum concentration (Cmax) (normalized by EC50) for single-dose study and normalized steady-state minimum concentration (Cmin,ss) and Cmax,ss for multiple-dose study at each dose level at all values of γ were obtained using individual predicted values, which were calculated from the parameter estimates from 100 simulated subjects and the simulation time points in each scenario.
To evaluate the estimation performance for PD parameters at each dose, the following statistics were obtained using individual predicted values.
1) Median values and range of normalized maximum concentration (Cmax) (normalization using EC50) for single-dose studies
2) Normalized steady-state minimum concentration and Cmax,ss for multiple-dose studies at each dose level at all values of gamma.
Individual predicted values were calculated from the parameter estimates from 100 simulated subjects and simulated time points in each scenario.
Results
Eight scenarios out of total seventy scenarios failed stochastic simulation and estimation (SSE), in spite of numerous attempts. The failed scenarios were: four scenarios of 12.5 and 25 mg at high Hill coefficients (γ = 5, 10) in single-dose study and four scenarios of 100, 200, 400 and 800 mg at low Hill coefficients (γ = 0.5) in multiple-dose study. Among the remaining sixty two scenarios which were successful, one scenario in single-dose studies had 1 failure and eight scenarios in multiple-dose studies had 1 to 3 failure(s) during 100 simulations and estimations for each scenario.
PK simulation and estimation
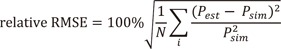
For the single-dose studies, all the PK parameters (θ and ω2) for ka, CL/F and V/F were unbiased and precise (Fig. 1a), while ωka2 was considerably biased and imprecise for the multiple-dose studies (Fig. 1b). The CL/F was estimated at best and V/ F was the next in the multiple-dose scenarios (Fig. 1b). The relative bias and RMSE of σ2 for the PK observations were less than 0.8% and 5% for single-dose study and 1.4% and 5.1% for multiple-dose study, respectively.
The median ratios of the individual predicted Cmax and Cmax,ss to EC50 represented, respectively, near two-fold increases from 0.11 to 6.8 EC50 units for the single-dose studies and from 0.25 to 16 EC50 units for the multiple-dose studies with the increase in doses. The median ratio of the individual predicted Cmin,ss to EC50 for the multiple-dose studies also increased to double from 0.16 to 10 EC50 units (Table 1).
PD simulation and estimation
In single-dose studies, Emax was not attained at γ of 0.5 and 1, while it was attained at higher doses with γ of 2, 5 and 10. In case of multiple-dose studies, only a small part of a full sigmoid Emax curve was obtainable (Fig. 2).
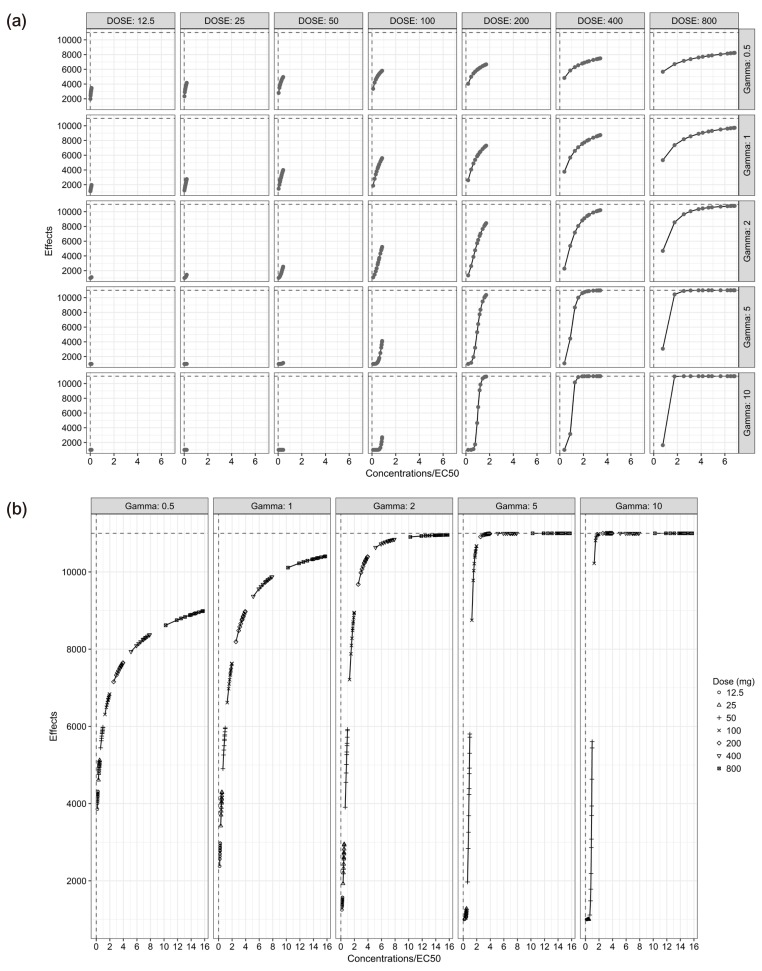
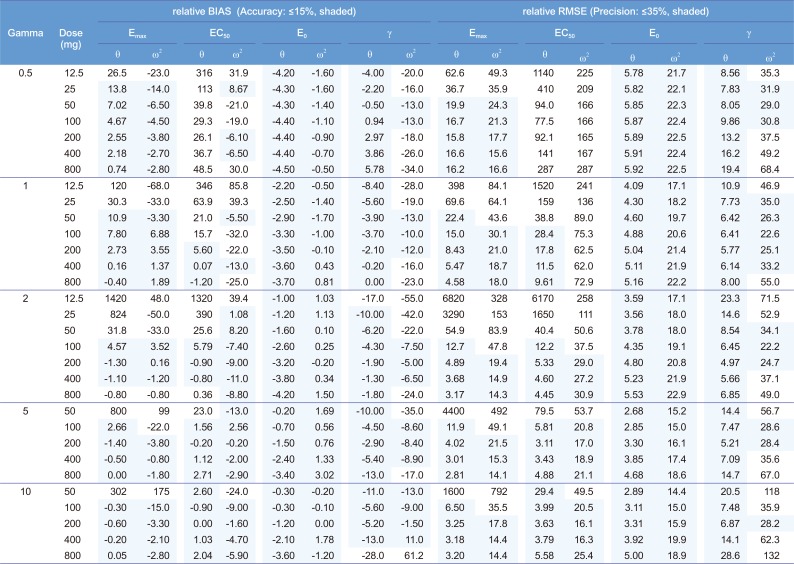
For the single-dose scenarios (Table 2, Fig. 3), estimated θEmax and ωEmax2 were mostly biased at lower doses, while most of them were unbiased and precise when the doses and the Cmax were, respectively, more than or equal to 100 mg and 0.42 EC50 units, except for the biased ωEmax2 at 100 mg doses (Cmax = 0.42 EC50 units) with γ of 5 and 10 and the imprecise ωEmax2 at 100 mg doses (Cmax = 0.42 EC50 units) with γ of 2, 5, and 10. θEC50 and ωEC502 were reliably estimated at more than or equal to 100 mg doses with γ of 2 and 5 except the imprecise ωEC502 at 100 mg dose with γ of 2. The scenarios with γ of 0.5 and 1 resulted in poor estimates of EC50 in most doses, while estimates of θEC50 were reliable at more than or equal to 200 mg doses or Cmax of 0.85 EC50 units with γ of 1. With regard to E0, the parameter estimates from all single-dose scenarios were precisely estimated with little bias. Parameter estimates of θγ were mostly accurate and precise except for those at 12.5 mg dose (Cmax=0.11 EC50 units) with γ of 2 and 800 mg dose (Cmax=6.8 EC50 units) with γ of 10, whereas the parameter estimates of ωγ2 were reliably estimated only when the doses were 50 mg (Cmax=0.21 EC50 units) with γ of 0.5 and 1 or 100 (Cmax=0.85 EC50 units) and 200 mg (Cmax= 1.7 EC50 units) with all γ except for 100 mg dose (Cmax=0.85 EC50 units) with γ of 0.5 and 200 mg (Cmax= 1.7 EC50 units) dose with γ of 10. The relative bias and RMSE of σ2 for the PD observations were less than 0.9% and 5% for single-dose study, respectively.
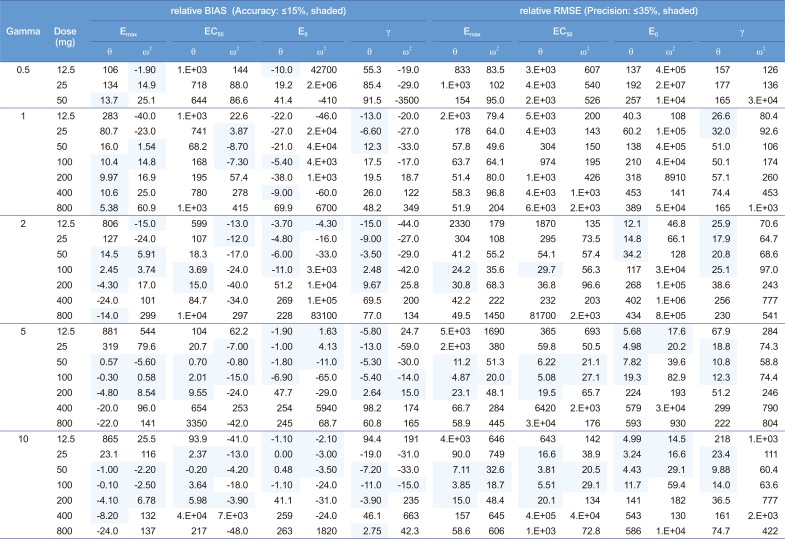
For the multiple-dose scenarios (Table 3, Supplementary Fig. 1), it was very difficult to estimate accurate and precise PD parameters. The estimates of θEmax and ωEmax2 met the acceptance criteria of bias and precision when the doses were within the range of 50 (Cmin=0.63 and Cmax=0.99 EC50 units) and 200 mg (Cmin=2.5 and Cmax=3.9 EC50 units) and γ was either 5 or 10. This was not true, however, for 50 mg dose (Cmin=0.63 and Cmax=0.99 EC50 units) with γ of 5 and 200 mg dose (Cmin=2.5 and Cmax=3.9 EC50 units) with γ of either 5 or 10. Estimates corresponding to these doses resulted in high imprecision. With regard to the estimates of θEC50 and ωEC502, the results from designs at 100 mg dose 50 (Cmin=1.3 and Cmax=2.0 EC50 units) with γ of 5 and 50 mg dose (Cmin=0.63 and Cmax=0.99 EC50 units) with γ of 10 were reliable. Contrary to the results of single-dose studies, the performance of estimating E0 represented considerably poor accuracy and precision. θE0 and ωE02 were estimated with accuracy and precision, when the doses were in the range of 12.5 and 50 with γ of 5 and 10, except for the imprecise ωE02 at 50 mg dose (Cmin=0.63 and Cmax=0.99 EC50 units) with γ of 5. Some θγ were estimated with accuracy and precision, while most ωγ2 were unreliable. The relative bias and RMSE of σ2 for the PD observations were less than 0.9% and 5.1% for multiple-dose study, respectively.
Discussion
This simulation study assumes a typical human pharmacology study design where plasma concentration and effect are frequently measured in order to characterize PK and/or PD. Dense sampling strategies are used in all phases of clinical trials for changing dose, indication, or target population as well as phase 1 clinical trials in new drug development, and pharmacometric analyses are frequently done for these studies. However, not all analyses are successful and the quality of population approach depends on the quality of study design as well as the quantity of data. Therefore, this study aims to specifically investigate the estimation performance of PD parameters based on different data properties given the same quantity of data. In case of sparse sampling, it is natural that parameters are poorly estimated.
Ette et al. suggested a data supplementation (PK/PD knowledge creation or discovery) method to characterize an unknown target region of the response surface, which is very useful in finding appropriate new doses in a completed clinical study with limited information on exposure-response relationship.[13] Dutta et al. found that Emax, EC50, and γ of sigmoid Emax model were poorly estimated if the maximum concentration was not attained up to 95% of Emax applying clinical data simulation. Seven escalating Cmax levels with five different Hill coefficients (γ=0.2, 0.5, 1, 2 or 5) were used in simulations. The number of blood samples was ten in each scenario. However, the concentrations were derived from sigmoid Emax curve and pharmacokinetics was not considered.[14] The parameter estimation of sigmoid Emax model is an important part in dose-finding study. Dragalin et al. found that the adaptive designs with the selected dose applying Fisher information matrix were superior in finding target dose compared to the common designs with the doses allocated by equal interval.[15] Wang et al. also compared the performance of the adaptive design to the uniform design.[16] The purpose of these two studies was to show the performance of adaptive optimal designs for dose-finding studies, (corresponding to phase 2 clinical studies) and pharmacokinetics was not considered. On the other hand, the next two studies used pharmacokinetic sampling designs to investigate pharmacodynamic parameter estimation, as is done in this study. Girgis et al.[10] found that the accuracy and precision of the PD parameter estimates got worse as the number of subjects decreased from 100 to 25 with sparse sampling design. Pai et al.[11] performed a series of studies that evaluated the effect of octreotide on the insulin-like growth factor-1and the effect of remifentanil on electroencephalogram, which were successfully described using sigmoid Emax model with moderate sigmoidicity (γ=2.51) and simple Emax model (γ=1), respectively, while the previous study of theophylline-induced eosinopenia was described using a model of high sigmoidicity. The latter study investigated the change in bias and precision in relation to Hill coefficient using 100 subjects in each scenario and 4 to 5 sparse samplings based on the former study and found that the plasma concentration of two to three times EC50 was needed to get reliable parameter estimates if the drug exhibited high Hill coefficient, and that the plasma sampling near EC50 was important with simple Emax model. In the two studies, all the estimated ωγ2 were biased and imprecise, whereas ωγ2 of 10 scenarios, including doses of 50 (Cmax=0.42 EC50 units) and 100 mg (Cmax=0.85 EC50 units) with γ of 0.5, 50 to 200 mg with γ of 1, 100 and 200 mg with γ of 2 or 5 and 200 mg (Cmax=1.7 EC50 units) with γ of 10, among 31 single-dose scenarios were accurately and precisely estimated in this study with dense sampling design.
In this study, the number of subjects was set to 100 in each scenario and dense sampling design was adopted based on the results of the previous studies to investigate the estimation performance with regard to differing concentration and Hill coefficients while fixing the number of subjects and sampling points. Using virtual drugs with different Hill coefficients and ratios of concentration to EC50 would facilitate general interpretation and easy application to the real drugs.
For the single-dose studies, the SSE processes failed when the doses were 12.5 (Cmax=0.11 EC50 units) and 50 mg (Cmax=0.42 EC50 units) and γ was either 5 or 10, because the simulated concentrations were located at lower flat area of the sigmoid Emax curve (Fig. 2). The accuracy and precision of θEmax and ωEmax2 were getting better with the increase in dose, regardless of γ, while those of θEC50 and ωEC502 gradually improved with increase in both dose and γ (Fig. 3). In single-dose studies, since the baseline of effects before dosing was measurable, all the θE0 and ωE02 were estimated with accuracy and precision. The estimated θγ showed various trends at different values of γ. The absolute values of relative bias for θγ were represented by a U-shaped curve when γ was 0.5, 5 or 10, while they grew with increase in dose when γ was either 1 or 2 (Fig. 3). The relative RMSE for θγ and the relative bias and relative RMSE for ωγ2 also represented U-shape trends regardless of γ (Fig. 3), because the bottom area of the effects were measured with lower doses and the ceiling area were measured with higher doses. Sampling enough concentrations corresponding to the whole range of the effect curve must be crucial to estimate reliable θγ and ωγ2 (Fig. 2).
The estimation capabilities of the PD parameters except for θE0 and ωE02 with different Hill coefficients (γ) in single-dose scenarios are as follows (Fig. 3). For the γ of 0.5, all the estimates of θEmax and ωEmax2 were reliable when the dose was at least 50 mg or Cmax was more than 0.42 EC50 units. The estimates of θγ and ωγ2 were accurate and precise only under doses of 50 (Cmax=0.42 EC50 units) and 100 mg (Cmax=0.84 EC50 units). However, θEC50 and ωEC502 were poorly estimated in all dosing scenarios. The reason seemed that the range of concentration-effect relationships was not enough to describe whole shape of sigmoid Emax model as shown in the multiple-dose scenarios. The effect-concentration profiles obtained from various doses seem to be needed to estimate accurate and precise θEC50 and ωEC502. For the γ of 1, all the estimates of θEmax and ωEmax2 were reliable when the dose was at least 100 mg or Cmax was more than 0.85 EC50 units. θEC50 was accurately and precisely estimated when the dose was at least 100 mg (Cmax=0.84 EC50 units), while ωEC502 was hardly estimated, as shown in a previous study.[11] The estimates of θγ and ωγ2 were accurate and precise when the doses were within the range of 50 to 400 mg (Cmax=0.42 to 3.4 EC50 units). This was not true, however, for 800 mg dose (Cmax=6.8 EC50 units) owing to lack of information on sigmoidicity in concentration-effect relationship. For the γ of 2 to 10, all the parameter estimates for Emax and EC50 met the acceptance criteria of bias and precision when the doses were more than or equal to 200 mg (Cmax=1.7 EC50 units). This is a relatively smaller value than the result form a study which reported that the 2 to 3 EC50 region is needed to get an unbiased and precise estimate of ωEmax2, when γ was 6.22 and blood sampling was sparse.[10] A dense sampling design is recommended to get a precise ωEC502, because it was impossible with sparse sampling design.[11]
Both the θγ and ωγ2 met the criteria for accuracy and precision at 100 (Cmax=0.84 EC50 units) and 200 mg (Cmax=1.7 EC50 units) with γ of 2, 100 to 400 mg (Cmax=0.84 to 3.4 EC50 units) with γ of 5, and 200 mg (Cmax=1.7 EC50 units) with γ of 10. On the other hand, Girgis et al. found that all θγ and ωγ2 were biased and imprecise when the Hill coefficient was high (γ=6.22), 4 to 5 blood samples were gathered[10] and Pai et al. also reported similar results from spare sampling design, when γ were 1 or 2.51.[11] These results suggest that dense sampling design may be essential to get accurate and precise estimates of θγ and ωγ2.
These results can be applied to clinical trials and PK/PD modeling of resultant data. When a clinical study is performed to evaluate the PK/PD of an investigational product with Hill coefficients of 2, an investigator can use 200 mg (Cmax=1.7 EC50 units) to get the best results of parameter estimation or 100 mg (Cmax=0.84 EC50 units) to get useful parameter estimates with less toxicity. On the other hand, an investigator can interpret the reliability of the results from PK/PD modeling based on the results of this study.
For the multiple-dose studies (Table 3, Supplementary Fig. 1), the parameter estimation performance was not good. In this simulation setting, the accumulation index was 2.22 with the half-life of 14 hours and 12 hour dosing interval. The concentration-effect profile obtained from this setting could not include the whole range of effects and resulted in poor performance. If the dosing interval was longer than 12 hours or the drug had lower accumulation rate than 2.22, wider range of concentration-time profiles could be gathered. The worse performance of PK parameter estimation in multiple-dose settings than in single-dose settings might play a role in the poor estimates of PD parameter. On the other hand, errors in PD parameter estimates might have negatively affected PK parameter estimation, and this is hinted from different levels of bias and precision with different combinations Hill coefficients and doses, although the Hill coefficient had no relation to pharmacokinetics. If PK/PD modeling is performed with data from multiple-dose studies, the sampled concentrations may include at least 0.63 EC50 and at most 3.9 EC50 corresponding to the doses of 50 to 200 mg in this study.
This study has some limitations. Since the PK profiles were simulated under the assumption of dose proportionality, the relationship between dose and EC50 units might change if investigational drugs have nonlinear PK properties. However, the exposure-response relationship can be easily understood and applied, if concentrations are normalized by EC50. Another limitation is that only one dosing interval was used for simulation in the multiple-dose scenarios. Since a different dosing interval may yield a different steady-state fluctuation, the parameter estimation performance can be better or worse than this study according to the dosing interval. A further limitation stems from the limited range of variability parameters of this study. Since all CV% of IIV and RV were set at moderate values of 30% and 20%, respectively, prediction of exposure-response relationship of a drug with larger variability might show deviations from our findings. Simultaneous modeling of PK/PD is one of the causes of poor IIV estimation, and certain types of sequential approaches may result in better performance.[17]
This simulation study demonstrated the effect of the relative range of sampled concentrations to EC50 and sigmoidicity (or sensitivity) between exposure and response on the parameter estimation performance using dense sampling design. In single-dose studies, most PD parameters of sigmoid Emax model were accurately and precisely estimated when the Cmax was more than 0.85 EC50 units, except for typical value and IIV of EC50 which were poorly estimated at low Hill coefficients (γ=0.5 and 1) regardless of doses. The PK/PD modeling results using only steady-state data may be carefully interpreted. This study can be useful in designing a clinical study to evaluate PK/PD relationship for new drug development or drug repositioning.
 XML Download