

 PDF
PDF ePub
ePub Citation
 Print
Print


Body Size
Body size is the most important quantitative determinant of drug dose. The human body weight range varies from about 500 g to over 250 kg due to both biological variability and changes over the lifespan. This more than 500 fold range in size is directly translatable through volume of distribution into drug loading dose differences. Because of allometrically predictable relationships between weight and clearance the corresponding range of maintenance dose rates is only about 100 fold. These dose predictions arise from the theory of allometric scaling.
Allometric Scaling
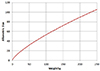
The quantitative relationship between body size and function and structure is the science of allometry. Allometric scaling applies across all biological processes including plants (e.g. trees) and animals (e.g. human body, Fig. 1). Equation 1 shows how clearance (CL) in a child can be predicted from the adult clearance based on relative weight and the allometric scaling exponent ¾. This exponent is predicted from a strong biologically based mathematical theory.[1] The fundamental assumption of West's allometric theory is that all cells are similar in size and have similar energy requirements. The structure of the energy delivery system e.g. blood vessels in humans, requires a certain mass e.g. bones in humans, to support the delivery system as well as the target cells. The mass overhead from these delivery and support systems increases total body mass without a linear increase in function. The allometric exponent describes this non-linear relationship for clearance (Fig. 2).
In contrast to functional processes such as clearance, allometric theory predicts a linear relationship between mass and structural properties such as volume of distribution. The allometric exponent for volume of distribution is 1.
Body Composition
The simplest view of body composition is to distinguish between fat free mass and fat mass.
Fat mass is typically around 22% of total body weight (men) and 28% (women).
Fat free mass is predictable from total body weight, height and sex.[2]
Drug clearance and volume of distribution is ‘driven’ mainly by fat free mass but also by fat mass. The fraction of fat mass predicting drug elimination and distribution varies from drug to drug e.g. 0 for warfarin clearance and volume,[3] 0.509 for busulfan clearance and 0.203 for busulfan volume[4] and 1 for propofol clearance and volume.[5] These fractions are multiplied by fat mass to predict the equivalent fat free mass determining either clearance or volume. The resulting sum of fat free mass and fraction of fat mass is called normal fat mass.[6] Normal fat mass is used in allometric scaling to combine body mass and body composition.[6]
Renal Function
Differences in renal function can explain about a 10 fold difference in total drug clearance. Glomerular filtration rate (GFR) is around 7 L/h in a healthy young adult and 0.5 L/h in terminal renal failure. There is always some non-renal clearance e.g. via the gut which adds 0.5 L/h to renal clearance even in renal failure.
CLcr is approximately the same as GFR. Serum creatinine is commonly used to calculate creatinine clearance (CLcr). The Cockcroft & Gault method is recommended for prediction of drug clearance. The formula is based on clearance concepts and uses weight, age and sex to predict creatinine production rate based on expected muscle mass.
Methods for predicting GFR have been developed for children and babies using height as a measure of body size.[7] These methods have the drawback of scaling GFR empirically based on body surface area rather than theory based allometric principles.
MDRD and eGFR methods have been developed for diagnosis of different categories of renal function. These are empirical formulae that do not include body size.[8]
Hepatic Function
It is difficult to predict hepatic drug clearance without administering the drug.
Clinical laboratories typically offer “Liver Function Tests” but these are really measures of liver damage which is not the same as function. AST/ALT may be very high (1000s) in viral hepatitis with no changes in hepatic drug clearance. Albumin and INR changes in terminal hepatic failure are correlated with hepatic drug clearance. The Childs Pugh method is a clinical staging system for the severity of hepatic failure. It is only loosely correlated with hepatic drug clearance.
How Old is a Baby?
The age of a baby may be described using several kinds of “age”.
Post-natal age (PNA). This is the age (e.g. days) since birth. It does not account for in utero maturation of body structure and function.
Post-menstrual age (PMA). This is the age (e.g. weeks) since the mother's last menstrual period. On average it is 2 weeks longer than biological age.
Post-conception age (PCA). This is the age (e.g. weeks) since conception. This is the best description of biological age but it is not widely recorded because the date of conception is often difficult to identify.
Gestational age (GA). Defined by the PMA at birth. GA does not change with time.
Post menstrual age is the recommended way to describe biological age. This recommendation is pragmatic rather than theoretically correct.
Maturation and Ageing
Maturation of drug clearance refers to the increase associated with development in utero until size standardized clearance reaches adult values. Maturation is predicted in combination with an allometric model to account for size differences (Equation 3).
Typical maturation is about 30% of adult values at full term delivery (GA 40 weeks). Very premature neonates are around 10% of adult values. In neonates and infants age accounts for a 10 fold increase in glomerular filtration rate from 24 weeks PMA up to 1 year of PNA.[9]
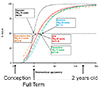
Figure 3 shows clearance maturation of glomerular filtration rate with a time to 50% maturation (TM50) of 48 weeks PMA. The time course of maturation of morphine and paracetamol, mainly due to metabolism to glucuronides, is delayed by a few weeks relative GFR. Dexmedetomidine is somewhat earlier and tramadol, mainly CYP2D6 metabolism, reaches 50% of the adult size standardized value at 39 weeks PMA. In all cases it can be seen that maturation is essentially complete at 2 years of age.
Ageing of drug clearance refers to the change in clearance (usually a decrease) associated with older age. Age in older adults has a minor (~ 25% lower) influence on drug clearance once weight and other factors such as renal function are accounted for.
Clearance increases with both weight and age in neonates and infants. Allometric size (see Fig. 2) predicts increasing clearance per kg with lower weights. Below 2 years of age, immaturity of drug clearance has a major effect on clearance so clearance per kg decreases compared with a 2 year old child. This leads to a peak in clearance when expressed per kg around 2 years of age. Maintenance doses are commonly expressed per kg in clinical practice and are also higher around 2 years of age than in babies and adults. This is predictable from the peak in clearance per kg at 2 years of age. Note that the absolute value of clearance increases with age until adulthood is reached and growth in weight and maturation reach their peak. It is only when clearance is scaled per kg that it has a peak around 2 years of age.
Clinical Applications of Variability
Body size, renal function and post-menstrual age are the most important determinants of drug dose. In comparison to these factors other covariates such as genotype often pale into insignificance. Quantitative pharmacology can help put the role of using covariates to predict drug dose into a realistic perspective.

 XML Download