

 PDF
PDF ePub
ePub Citation
 Print
Print


Introduction
The term allometry was originally used to refer to the scale that describes the relationship between the size of a body part to the whole body as an organism grows.[1] In recent years, the concept has been broadened and modified to account for the relationship between physiological or ecological traits and body size.[2] In pharmacometrics, similar scaling can also be applied between body weight and pharmacokinetic (PK) parameters such as clearance and volume of distribution. It is generally assumed that volume of distribution is proportional to the ratio of weight to standard weight, which is frequently set as median value of 70 kg, and clearance parameters to the ratio of weight to standard weight raised to the power of 3/4.[3] This theory-based scaling approach has been regarded useful among pharmacometricians and clinical pharmacologists in that it enables to extrapolate the result for one population to another. For example, even if a PK model is constructed based on adult data, use of allometric scaling may enable to predict drug concentration in pediatric patients. Moreover, several studies have proved that this theory-based scaling approach is fairly reliable.[4] As a result, allometric scaling is adopted without the process of covariate selection. However, useful allometric scaling relationship is not always available. For example, contrary to controlled clinical trial data, it is likely that demographic information as well as routine laboratory results would be missing in uncontrolled data, especially in routine clinical data. In this case, either exclusion of data or substitution of missing value with average value has to be used to minimize the influence of missing values. Nevertheless, these alternatives would not be an effective way in pediatric studies due to the scarcity of data and the rate of weight change dependent on age. Accordingly, this study aimed to construct a prediction model for weight using postmenstrual age (PMA) with pediatric patients under 12 years old.
Methods
Data
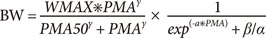
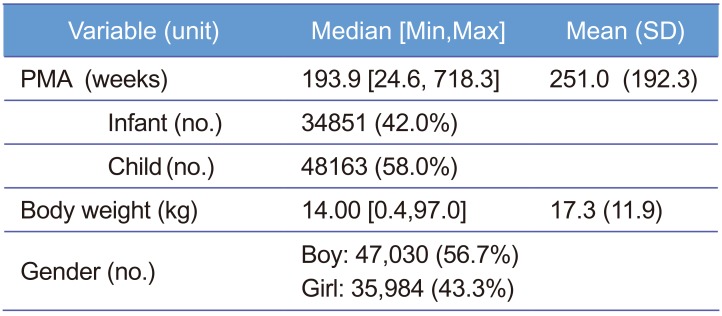
Data were obtained from electric medical records (EMR) of Severance Hospital and a total of 83,014 Korean pediatric patients under 12 year-old treated during the period from January 2012 to March 2017 were collected with a single sample per patient. PMA is defined as gestational age (the time elapsed between the first day of the last menstrual period and birth) plus chronological age (the time elapsed after birth) and it was assumed that patients were delivered at full-term, 40 weeks, when the PMA record was missing. Weight and gender records among patients' demographic information were obtained. As summarized in Table 1, median PMA and weight were 193.9 weeks and 14.0 kg, respectively, and boys were 56.7% of the patients. Patients with no available information were excluded. The data are displayed in Figure 1. All processes from data collection to analysis were approved by Severance Hospital Institutional Review Board.
A model for weight
After visual inspection of the data, we initially chose a sigmoid model as a basic model to be tested but this model was not adequate to describe weight change with age in the post-infant period. Accordingly, we chose sigmoid models multiplied by exponential or logistic function as candidates for the basic structural model, which are expressed in Eq. (1) and (2), respectively (see the Discussion section also).
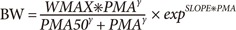
In Eq. (1) and (2), BW, WMAX, PMA, PMA50, and γ are body weight, maximum weight, PMA (independent variable), PMA to achieve 50% of WMAX, and Hill coefficient, respectively. SLOPE in Eq.(1) represents the rate of change in body weight with PMA. The parameter α in Eq.(2) is the increase rate of weight in logistic function and β/α is the reciprocal of the maximum value of logistic function. Here, the reason for parameterizing the maximum value of logistic function as β/α was to avoid identifiability problem between WMAX and β encountered when β was used in the numerator as the maximum value of logistic function.
Covariate analysis
After basic structural model selection, covariate model building was performed. In this study, gender was the only available variable so the difference of weight between boys and girls was quantitatively analyzed. The significance of gender effect on model parameters was determined with criteria of p value < 0.001.
All analyses in basic and covariate model building were done using NONMEM 7.3.0 (ICON Development Solutions, Hanover, MD,USA) and the first-order conditional estimation method. R3.2.0 (http://psn.sourceforge.net) was also utilized for data visualization.
Results
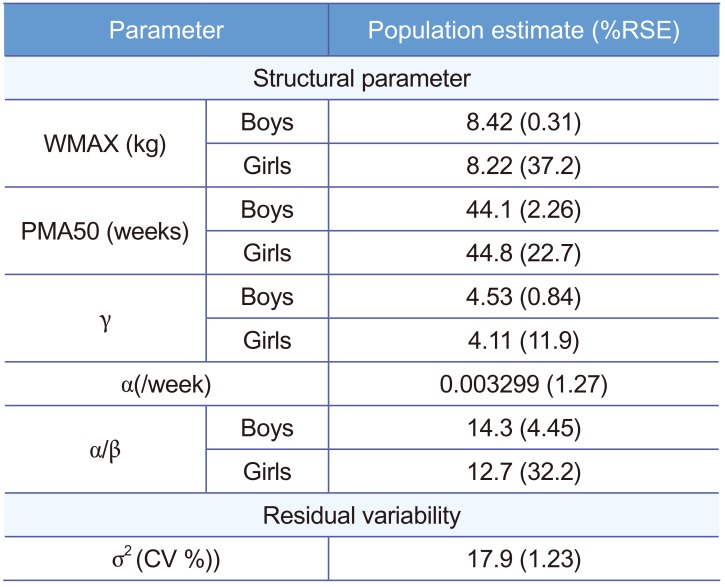
The sigmoid model multiplied by logistic function was chosen with the lower Akaike Information Criterion (AIC) value of 235,502.52 compared with the sigmoid model multiplied by exponential function with AIC of 236,542.15. Inter-individual random effect was not considered in our model since only one measurement per patient was available. As a residual error model, a combined error model was tested at first and it was found that additive error was negligible, with a proportional error model being finally selected. Parameter estimates of the final model were listed in Table 2. To report the maximum value of logistic function, a value of α/β was reported instead of β by using delta method.
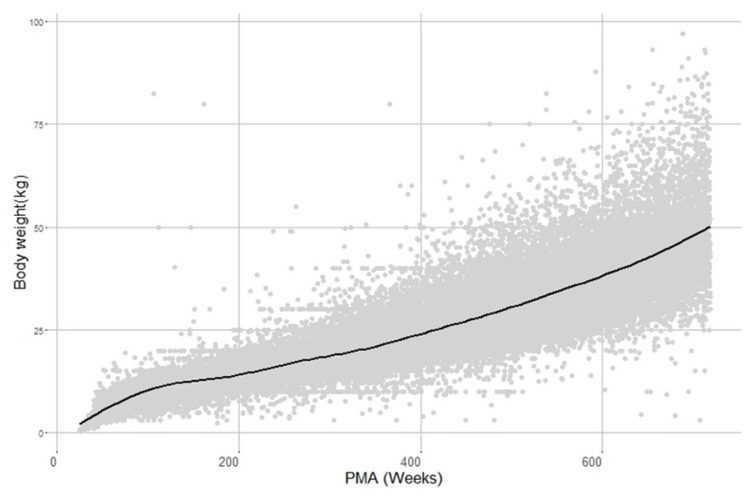
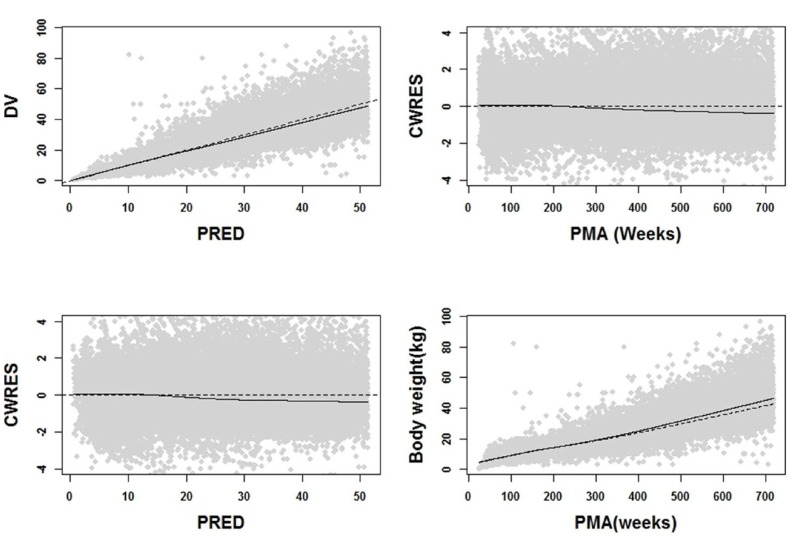
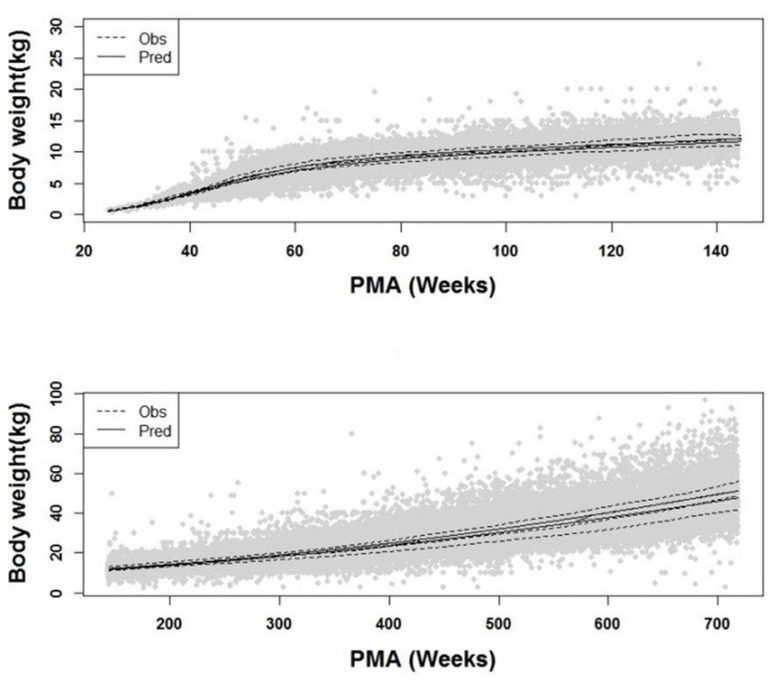
Through covariate model building, it was observed that gender affected all parameters except for the rate of change in body weight α. For the maximum weight WMAX, it was about 0.02-fold lower in girls than in boys and PMA50 were estimated as 44.13 weeks for boys and 44.88 weeks for girls. Also, hill coefficient was 4.53 and 4.11 for boys and girls, respectively. As for logistic function, there was a significant difference in estimates of β associated with WMAX between boys and girls. With the final model, goodness of fit plots were drawn in Figure 2 and 3, where significant model bias was not detected. The reason that in Figure 3 the interquartile ranges (25% ~ 75% percentiles) of predictions are narrower than those of observations is that the inter-individual random effect was not incorporated into the model due to only one observation available per individual and covariate coefficient values reported in Table 2 did not differ much between boys and girls.
Discussion
The purpose of this study was to present a weight prediction model for the pediatric population using PMA. To this end, our study provided a guideline for imputation of missing weight value based on patient's PMA. Besides, our analysis is likely representative of the Korean pediatric population in that a large number of patients were used for the analysis.
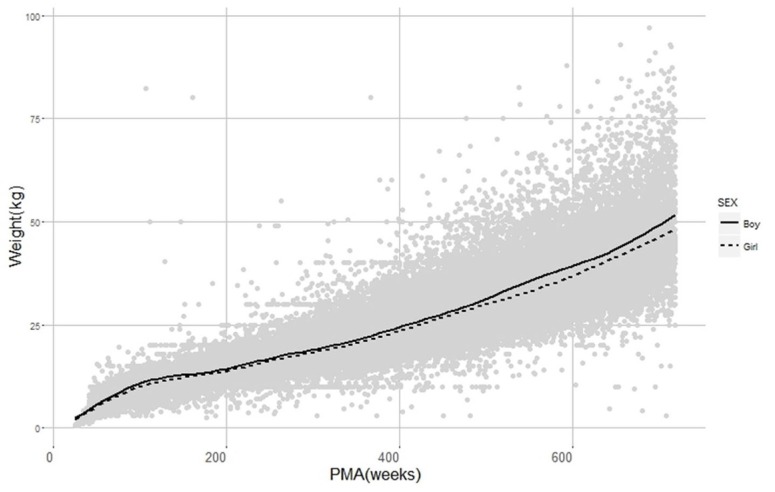
In our model, the relation between weight and age was expressed as a non-linear function with two components. The first component was described using a sigmoid function and the second by a logistic function. This result can be interpreted with regard to a typical human developmental process. In the perinatal period, physical growth and development in organ function occur rapidly. Consequently, baby typically doubles one's birth weight by 6 months after birth and triples by 1 year. [5] This agrees with our results presented in Figure 3, where sigmoid function only exerts a significant role in describing the change in weight up to 2 year-old; in the second period, it was observed that weight was relatively slow to increase compared to the first period, which was described by logistic function in our model. When the correlation between weight and age was plotted in semi-logarithm scale (not reported), it was seen that weight linearly increased with age. Additionally, logistic function has a maximum value, called carrying capacity. This feature is more biologically plausible since weight does not increase to infinity. As for gender difference, as displayed in Figure 4, boys were slightly heavier than girls for all PMAs as expected.
When it comes to use of age in modeling, post-natal age is generally used under most clinical circumstances. However, the problem with using post-natal age has been raised in that post-natal age is less likely to reflect a continuous growth process in the pediatric population, particularly in pre-term to infant babies, and less likely to correlate with PK parameters than using post-menstrual age.[67] Hence, there are suggestions of using PMA instead of post-natal age when growth or organ maturation is considered. In line with this suggestion, PMA was used in our analysis, which demonstrated that average weights of new born babies were different for different PMA groups despite being in the same postnatal age group.
Compared with the Standard Growth Chart in Korean Pediatric Population published by the Ministry of Health and Welfare, our model has an advantage in that it can precisely estimate the body weight particularly for infants, who are likely to be affected by gestational age, with pre-term babies weighing lighter than full-term babies. Another advantage is that it can predict the weight on a weekly basis for the entire age range of pediatric population while the standard growth chart can predict the weight on a monthly basis at best for one year only after the birth. Despite the fact that our model was developed using the data from a patient population and certain diseases could have weight increasing or decreasing effects, those increasing and decreasing disease effects were expected to cancel out due to the number of subjects as large as 83,014, and thus it is thought that the developed model can be equally applied to a healthy population.
There are some limitations with our model. First, inter-individual variability could not be estimated because only one observation was available per patient. Second, the model was developed using the data for the age group under 12 years old and thus would be difficult to be extrapolated to the age group beyond that. There would be a number of factors affecting weight during adolescent period over 12 years old and the pattern of change in weight is likely to be different. Therefore, to better understand weight distribution for the age group over 12 years old, additional studies with serial observations per individual would be needed. Nevertheless, given the practical difficulty in collecting intensive data in the young pediatric population including neonates and infants, the developed model might be used as a guideline for clinical studies for children under 12 years old whose weight change rapidly with age and for model building in dealing with time varying body weight as a covariate.
 XML Download