

 PDF
PDF ePub
ePub Citation
 Print
Print


Introduction
A clinical study report (CSR) is official documentation of the results of a clinical trial.[1] To ensure the credibility of the CSR, appropriate management of clinical trial data is necessary.[2] When a CSR is written, many kinds of tables are produced from clinical trial data. Converting diverse data into tables, especially those for a CSR appendix, without error, has been a huge burden to scientific writers.[3] Typically, tables for CSRs and their appendices have been created using copy and paste from the database file (delivered as an Excel file type). Such conventions are prone to errors, especially when the workload is increased.[4] Thus, automated and reproducible processes are needed to improve the reliability and accuracy of reports.[5]
Here we introduce a system named “automated report generation and update code script (ARGUS)” that allows us to make complicated tables in CSRs and their appendices automatically. The system was designed to be compatible with the Clinical Data Interchange Standards Consortium (CDISC) standard and only database files created according to variable name rule of Study Data Tabulation Model (SDTM) can be processed. There is also a module that can process non-standard data to work with plasma concentration data.
Methods
System components
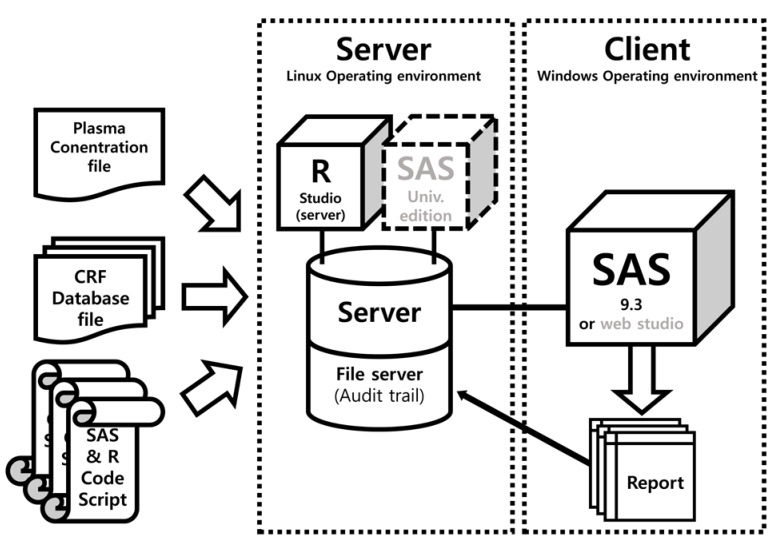
The ARGUS system was written using SAS (version 9.3; the dynamic data exchange (DDE) programming was only compatible with SAS for Windows, version 9.3 or higher) except for the parts for PK plot generation (R, version 3.3.1 was used). The report document is created by sequential runs of SAS code scripts. Linux audit daemon was used for monitoring (file tracking) of CRF database files and code script files. The system of code script was designed for the appendix of the CSR of a 2 × 2 crossover design (bioequivalence test or drug–drug interaction study). The ARGUS system components are shown in Figure 1.
The structure of the SAS code script
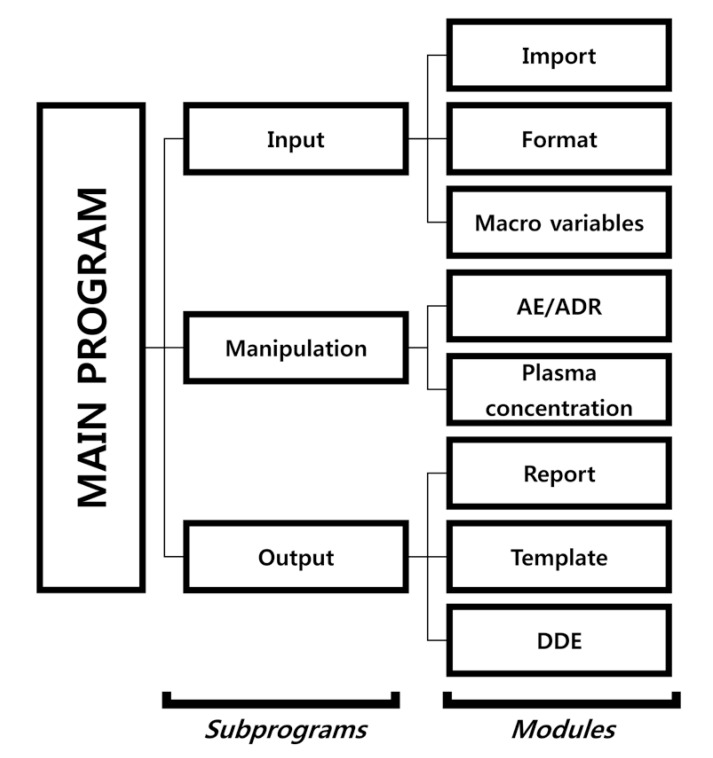
The table form of the system was developed based on a CSR appendix of a 2 × 2 crossover design we made earlier. The SAS code script consists of a main program, subprograms, and modules. The main program executes each of the subprograms, and the subprograms are classified according to input, manipulation procedure, and output. Each subprogram contains two or three modules (Fig. 2). The module script can be revised according to users' needs.
Input subprogram: The input subprogram loads a database file and clinical trial information. The import module imports database files and the macro variable module contains information regarding the clinical trial, which is used as the argument for the system. The format module uses the SAS format procedure. It changes numeric or acronym data to certain characters. For example, if number ‘2’ is defined as “Nonsmoker”, then the module outputs “Nonsmoking” automatically.
Manipulation subprogram: The manipulation subprogram transforms the database file into a form that can be presented in the report. It consists of the AE/ADR module and plasma concentration module.
Output subprogram: The output subprogram consists of a report, template, and DDE modules. The report module outputs the reportable processed data in an rtf. The template module constructs headers and borderlines (line width or style) of tables. The DDE module is a post-processing module that is used to add text or modify fonts. It may also save the document in MS Word format. In SAS, the file is saved through the output subprogram and the DDE module is not activated.[6]
System operation
For the ARGUS to automate the process, it has the following prerequisites before running the main program.
✓ The database file path, the script file path, and a macro variable should be entered.
✓ The R code for individual PK plots should be run before executing the main program.
After executing the main program, a CSR Appendix report is completed. In the main program, when the user presses the Submit button, the system is activated and the process is started. When the process is completed, the output file is saved and MS Word is automatically launched to generate the report file (in the Windows version of SAS). If the program is modified in accordance with clinical trials, we recommend recording the modifications in the main program. The operation flow is as follows:
✓ Input and modification (input path and macro variables, format, module add/fix, etc.) -> execute (submit) -> Output
System constraints
✓ The system was created according to the CDISC/SDTM standard, thus nonstandard CRF database files are not compatible.
✓ Hangul (Korean characters) cannot be processed by SAS.
✓ When the hierarchy structure of the code is changed, the system does not run properly.
✓ The current version is designed for the 2 × 2 crossover design (bioequivalence test or drug–drug interaction study), code modification is necessary for other study designs.
Results
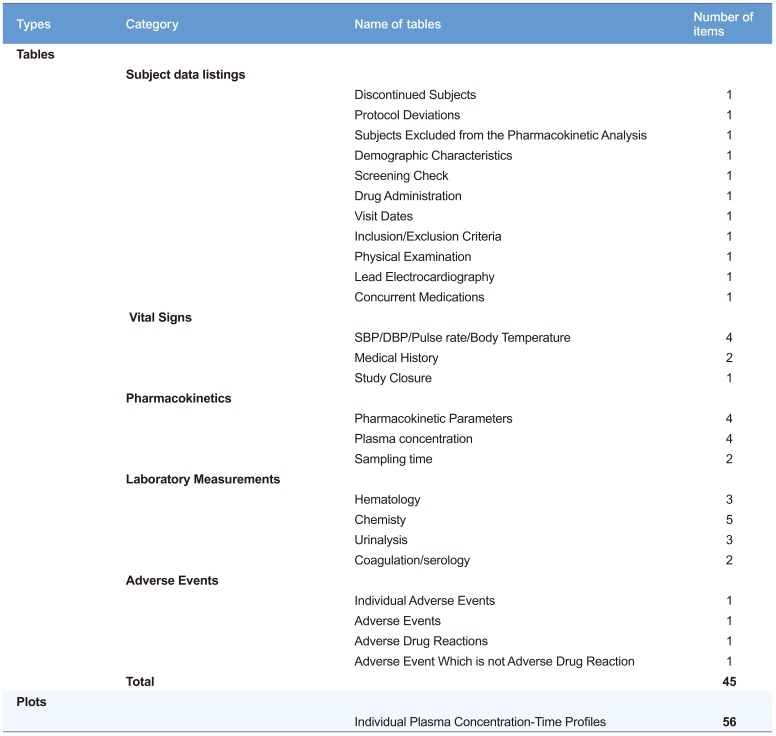
The run took about 50–60 sec to produce 45 tables and 56 plots (Table 1) after pressing the submit button in our desktop environment (x86-64 Intel Pentium Processor 4.6 GHz, 8 GB RAM).
The operation of the system is described as follows.
1. ARGUS makes new directories for the data file and code script file at the Linux server below the ARGUS and project name directories, respectively. Then, tracking is initiated.
2. ARGUS uploads the NCA dataset, individual PK parameter table (results from NCA analysis), original CRF database file (compatible file type: SAS7bdat, CSV), and code script file to each subdirectory under the project directory through the authorized
FTP account.
3. Before running the main program, the R plot code should be run. The user should connect to the R studio server to draw individual PK plots and store them using r plot code.
4. The user should connect to the SAS Studio (or run SAS, version 9.3), and then load the main program. The code script file and macro variables may be modified for new reports.
5. If all files are ready, the submit button can be pressed. When the process is finished, the system opens MS Word and the Word file is stored on the server.
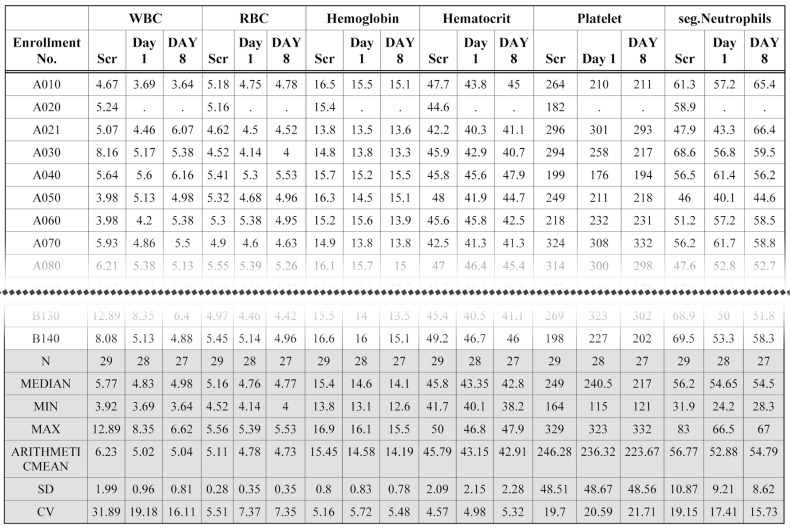
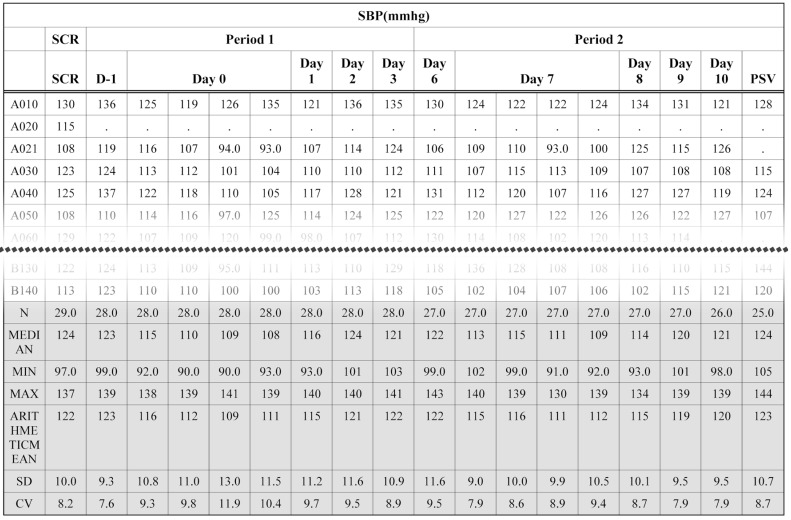
The original CRF database files of clinical laboratory test results are huge. Tabulation of clinical laboratory tests has been time-consuming work. Using the ARGUS system, two variables (LBTESTCD and LBORRES) with a SAS format procedure generate a cross table using very simple code. Part of a clinical laboratory (hematology) table produced by the ARGUS is shown in Figure 3. Similarly, vital sign data are also processed by the manipulation and report modules. Figure 4 shows part of a systolic blood pressure (SBP) table. The bottom line of the table header of all figures are marked with double lines using the template module.
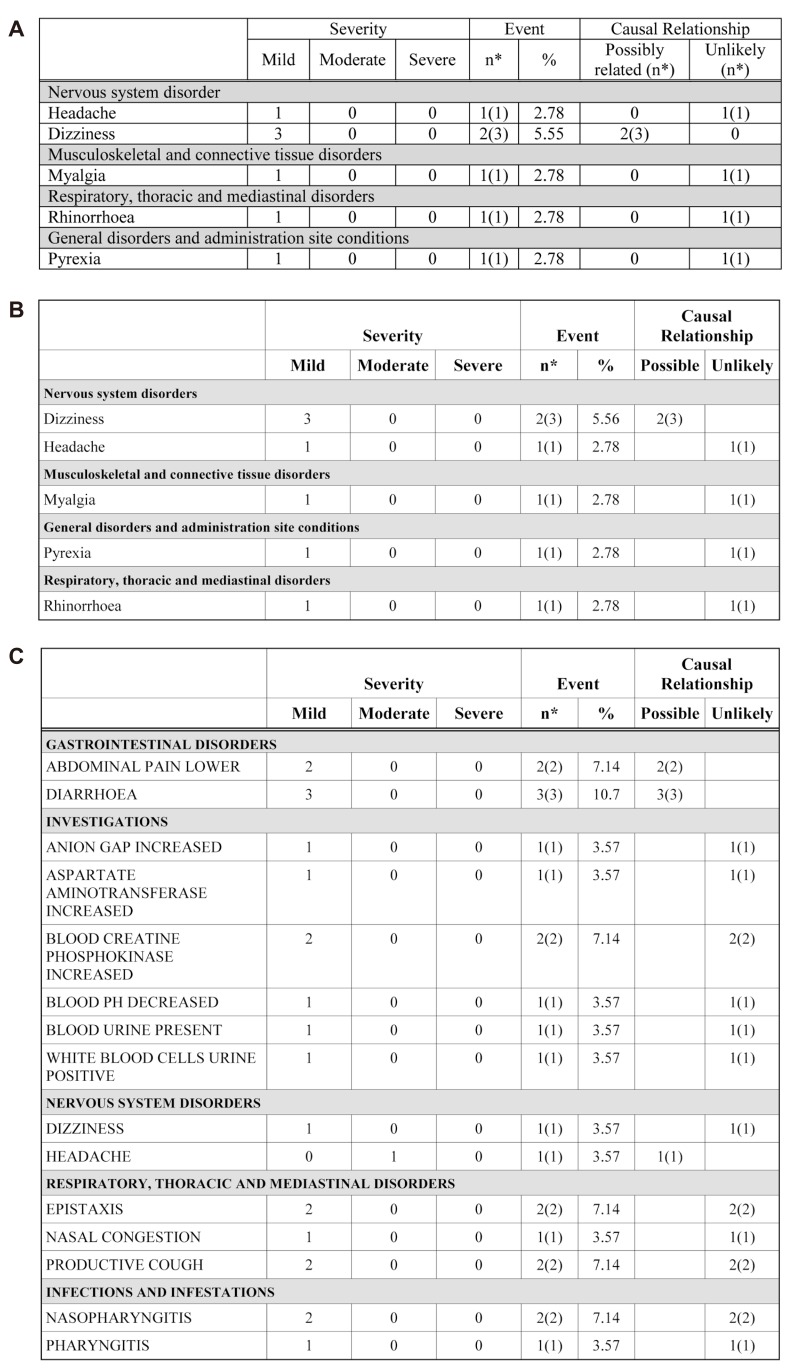
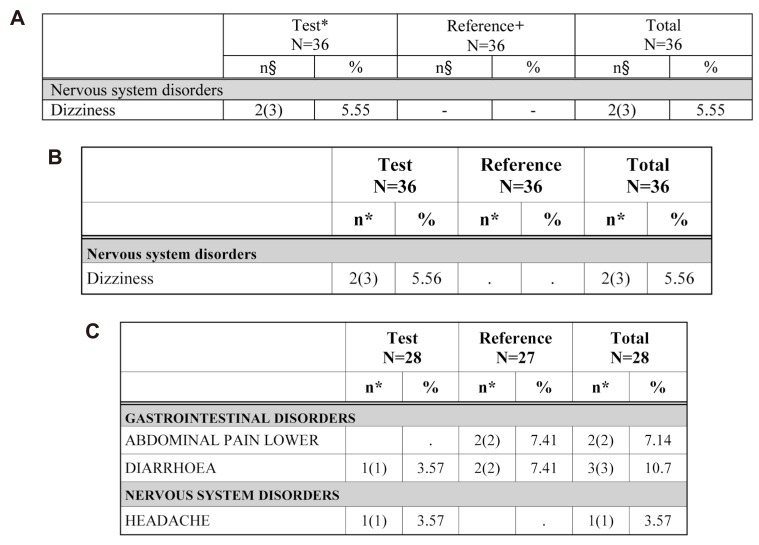
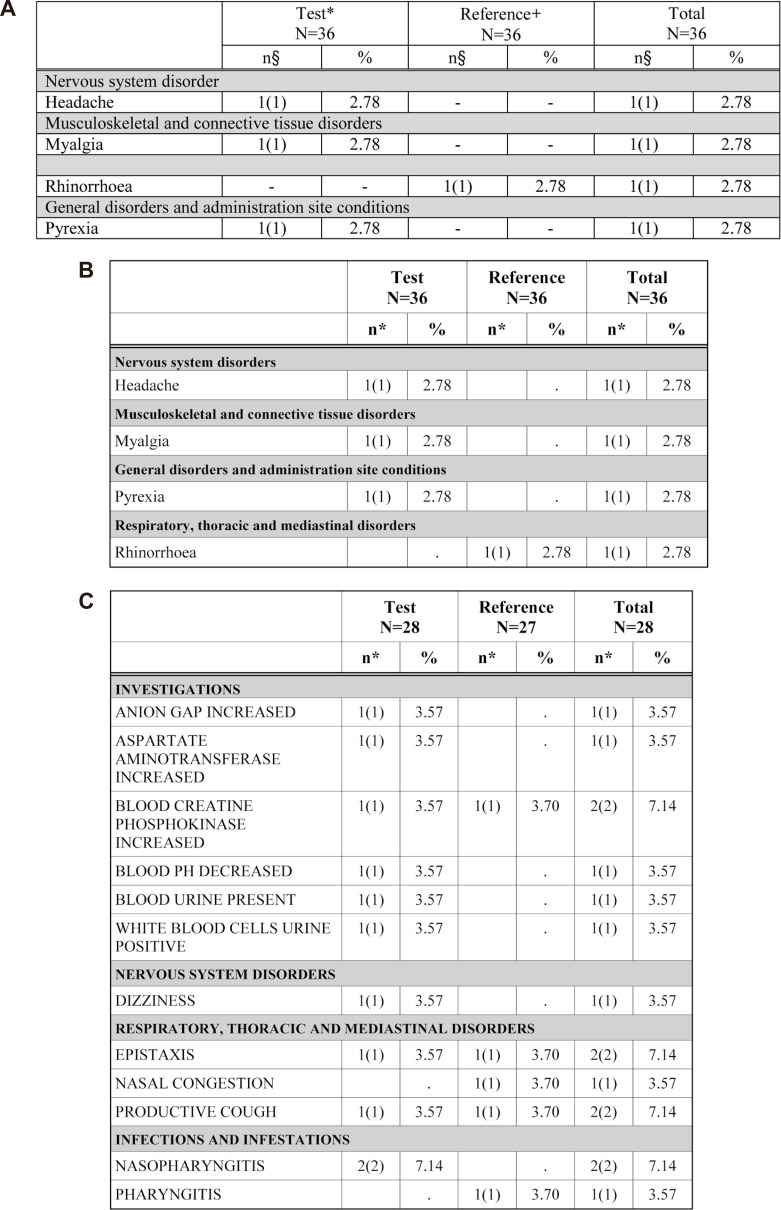
AE (Fig. 5) and ADR (Fig. 6) tabulation require complicated procedures. All kinds of system organ classes (SOC) of MedDRA were stored in the SAS format module. The AE/ADR module counts the numbers of subjects with AE and events, and calculates the percentage from the number of all subjects administered the drug. Counted and calculated numbers are combined for tabulation according to the SOC.
The ADR table is divided into two treatments in the 2 × 2 design. Treatment programming was needed for AE/ADR tabulation. The treatment program was constructed using the administration date (EXSTDTC), the AE (ADR), start date (AESTDTC) in the CRF database file and clinical trials information input by macro variables. The adverse events (which are not adverse drug reactions, Fig. 7) program is identical to that for the ADR table except for the relationship of AE variable (AEREL) criteria.
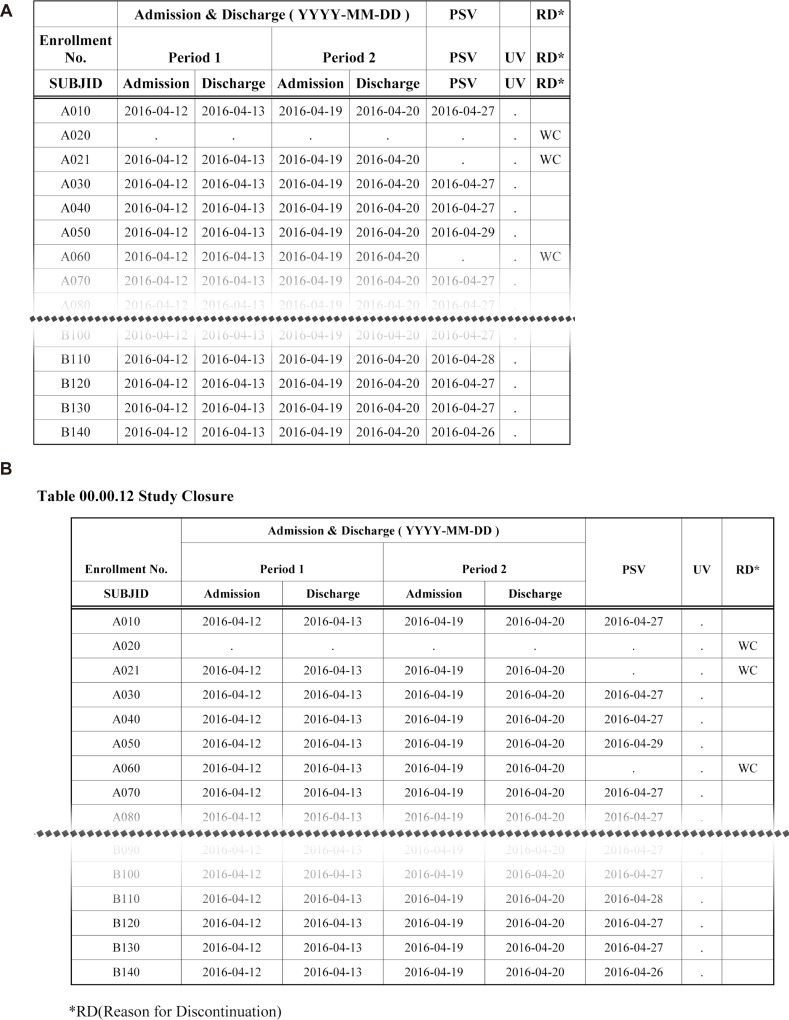
The DDE module uses Word Basic command code. The DDE module ensures SAS controls MS Word in Windows environments. Fig. 8 shows table changes before and after the postprocessing by the DDE module.
Discussion
The appendix jobs that have taken our team about 8 days to complete, were completed within 6 or 7 hours using the ARGUS system. The current version requires minor code modifications for each CRF database file and appendix item selection by the user. The user may complete the input of variables and execution within 30 minutes, but it will take time to fix the code after execution. Most tables are created properly, but some may require code modifications. Because plasma concentration data are delivered in formats varying by assaying institutions, the plasma concentration module needs to be modified for each clinical trial. If it is standardized, this modification step may be omitted in pharmacokinetic analysis and its tabulation.[7]
The AE table has a column to describe the causality relationship to treatments of clinical studies (causality). The variable AEREL was originally classified into five (not related, unlikely related, possibly related, probably related, definitely related) categories in the CRF database file.[8] After the manipulation process, the number of columns in the AE table is adjusted according to the extent of causality. The empty columns are automatically omitted.[9] This algorithm will be applied to the test date of the clinical laboratory table.
There still remains some issues in ARGUS, such as compatibility with Hangul where most of concomitant medication data are written. Postprocessing (DDE module) of tracking the document modification is also needed to assure the completeness of the document. The DDE module generally needs a huge amount of coding work. For example, about 10–20 lines of code are necessary for a simple change of cell width in a table. Moreover, it needs modification to be used for another project because the data size, trial design, and subject number may differ.
The system described in this report is in its prototype stage, but it is meaningful first step in building a knowledge-based system. This system requires verification by beta testing in actual clinical trials. Through tuning of the prototype version, training materials and manuals are to be published.
 XML Download