

 PDF
PDF ePub
ePub Citation
 Print
Print


Abstract
In oncology trials, patients are withdrawn from study at the time when progressive disease (PD) is diagnosed, which is defined as 20% increase of tumor size from the minimum. Such informative censoring can lead to biased parameter estimates when nonlinear mixed effects models are fitted using NONMEM. In this work, we investigated how empirical Bayes estimates (EBE) could be exploited to impute missing tumor size observations and partially correct biases in the parameter estimates. 50 simulated datasets, each consisting of 100 patients, were generated based on the published model. From the simulated dataset, censoring due to PD diagnosis has been implemented. Using the post-hoc EBEs acquired from fitting the censored datasets using NONMEM, imputed values were generated from the tumor size model. Model fitting was carried out using censored and imputed datasets. Parameter estimates using both datasets were compared with true values. Tumor growth rate and cell kill rate were approximately 28% and 16% underestimated when fitted using the censored dataset, respectively. With the imputed datasets, relative biases of tumor growth rate and cell kill rate decreased to about 6% and 0%, respectively. Our work demonstrates that using EBEs acquired from fitting the model to the censored dataset and imputing the unknown tumor size observations with individual predictions beyond the PD time point is a viable option to solve the bias associated with structural parameter estimates. This approach, however, would not be helpful in getting better estimates of variance parameters.
REFERENCES
1.Eisenhauer EA., Therasse P., Bogaerts J., Schwartz LH., Sargent D., Ford R, et al. New response evaluation criteria in solid tumours: revised RECIST guideline (version 1.1). Eur J Cancer. 2009. 45:228–247. DOI: doi: 10.1016/j.ejca.2008.10. 026.

2.Ribba B., Holford NH., Magni P., Trocóniz I., Gueorguieva I., Girard P, et al. .A review of mixed-effects models of tumor growth and effects of anticancer drug treatment used in population analysis. CPT Pharmacometrics Syst Pharmacol. 2014. 3:e113. DOI: doi: 10.1038/psp.2014.12.
3.Tham LS., Wang L., Soo RA., Lee SC., Lee HS., Yong WP, et al. .A pharmacodynamic model for the time course of tumor shrinkage by gemcitabine + carboplatin in non-small cell lung cancer patients. Clin Cancer Res. 2008. 14:4213–4218.
4.Bjornsson MA., Friberg LE., Simonsson US. Performance of nonlinear mixed effects models in the presence of informative dropout. AAPS J. 2015. 17:245–255. DOI: doi: 10.1208/s12248-014-9700-x.
5.Johansson AM., Karlsson MO. Multiple imputation of missing covariates in NONMEM and evaluation of the method's sensitivity to eta-shrinkage. AAPS J. 2013. 15:1035–1042. DOI: doi: 10.1208/s12248-013-9508-0.
6.Claret L., Girard P., Hoff PM., Van Cutsem E., Zuideveld KP., Jorga K, et al. Model-based prediction of phase III overall survival in colorectal cancer on the basis of phase II tumor dynamics. J Clin Oncol. 2009. 27:4103–4108. DOI: doi: 10.1200/JCO.2008.21.0807.
7.Ribba B., Kaloshi G., Peyre M., Ricard D., Calvez V., Tod M, et al. A tumor growth inhibition model for low-grade glioma treated with chemotherapy or radiotherapy. Clin Cancer Res. 2012. 18:5071–5080.
8.Martin EC., Aarons L., Yates JW. Accounting for dropout in xenografted tumour efficacy studies: integrated endpoint analysis, reduced bias and better use of animals. Cancer Chemother Pharmacol. 2016. 78:131–141. DOI: doi: 10.1007/s002 80-016-3059-x.
Figure 1.
Comparison plots of tumor size observations of original (LEFT), censored (CENTER), and imputed (RIGHT) datasets.
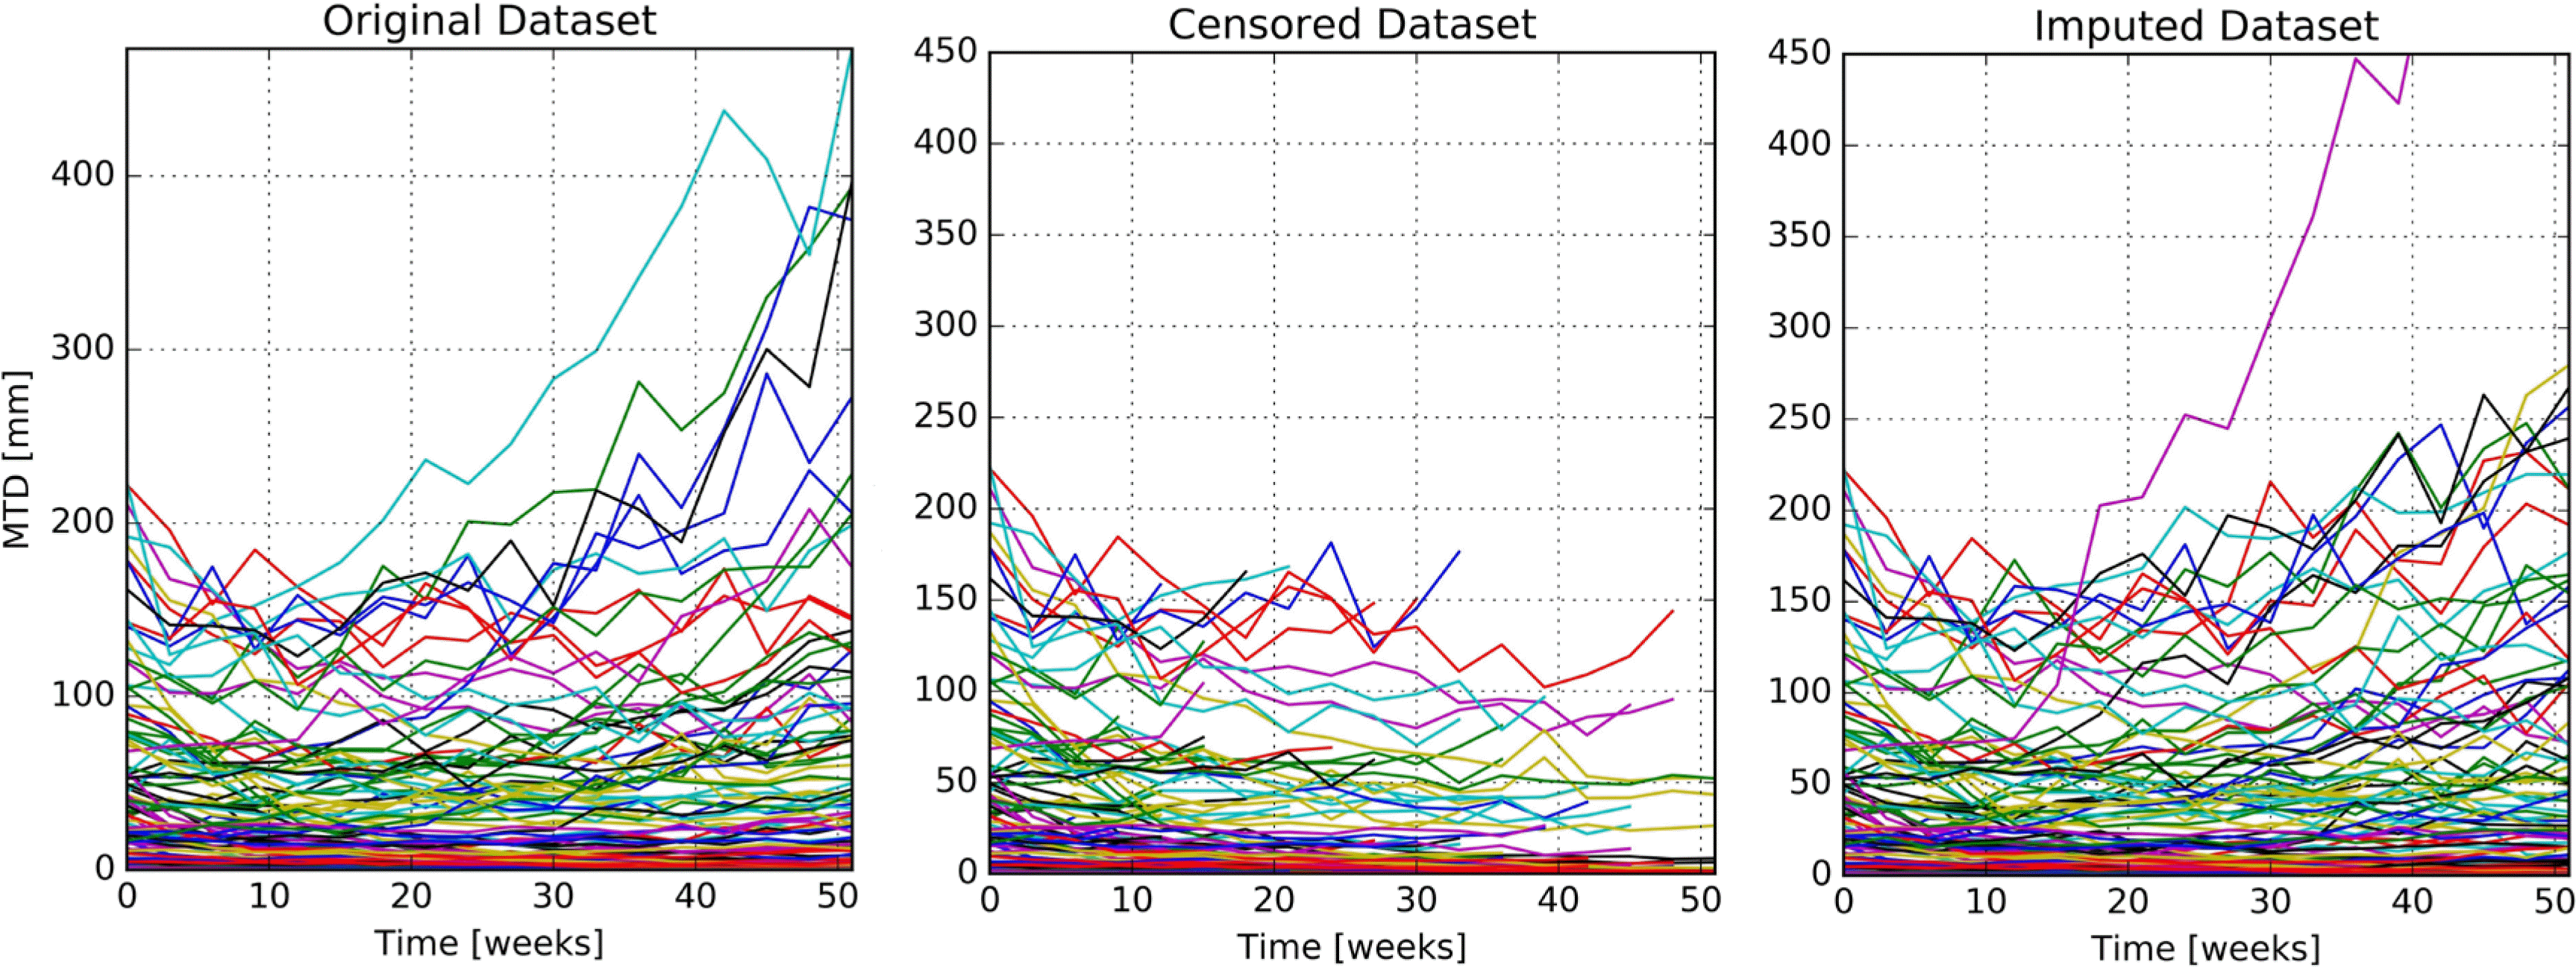
Table 1.
Estimate (%RSE) of tumor growth model parameters reporte in the original publication
Table 2.
Estimate (%RSE) and relative bias (%RSE) of tumor growth model parameters obtained from fitting the model to the original, censored and imputed datasets
 XML Download