



 PDF
 Citation
 Print


Introduction
Pelvic floor muscle (PFM) tone plays a key role in female pelvic health. It has been suggested to contribute to urinary continence through involvement in the sphincteric closure mechanism, and it provides essential structural support for the pelvic organs [1]. PFM tone has also been associated with the initiation or exacerbation of pain symptoms through mechanisms involving vaginal mucosal sensitivity [2], blood flow [3,4], and referred pain pathways [5,6]. Consistent with these mechanisms, alterations in PFM tone have been observed in several conditions, including urinary incontinence [7], pelvic organ prolapse [8], and pelvic pain disorders [9–12]. In addition, PFM tone has been reported to predict treatment outcomes [13,14], underscoring its clinical relevance in both diagnosis and management.
Various methods are used to assess PFM tone; however, all available approaches have inherent limitations, and none objectively quantify tone in a specific muscle or localized muscle area [15,16]. Ultrasound shear wave elastography (SWE) is a promising option for addressing these limitations. By enabling non-invasive measurement in a targeted area, SWE may provide insight into the mechanical properties of PFMs and offer a more objective alternative to manual palpation [17]. This approach could improve understanding of the role of PFM tone in pelvic floor dysfunction and support the development of more targeted treatment strategies.
SWE applies mechanical vibrations through focused acoustic radiation pressure generated by an ultrasound probe, thereby initiating shear wave propagation in the tissue under examination. Tissue stiffness is then estimated as shear wave speed, measured in meters per second, or as tissue elastic modulus, reported as the Young modulus or shear modulus in kilopascals; higher values indicate greater stiffness [18]. SWE has been shown to be valuable for evaluating thyroid, liver, and breast pathologies [19,20]. This non-invasive, real-time diagnostic method has also been used to assess the mechanical properties of skeletal muscle and is therefore useful in the diagnosis of various musculoskeletal disorders [16,21,22]. For example, a recent meta-analysis confirmed the reliability, validity, and responsiveness of SWE for biomechanical assessment of the back muscles [23].
SWE has also recently been reported as a valid measure of PFM stiffness, specifically stiffness of the puborectalis muscle, in both men [24] and women [25]. To date, several studies have applied SWE to evaluate the puborectalis muscle [15,26–29] and the perineal body [30], and available data suggest that SWE may be a reliable tool for puborectalis muscle assessment [27].
Although SWE assessment may appear simple and straightforward, it is complex and carries a substantial risk of misinterpretation. Several articles discussing SWE assessment principles in other body regions [31–33] have increased awareness of potential artifacts and misinterpretations. However, the existing literature does not specifically address PFMs, and the unique challenges associated with SWE assessment of PFMs have not yet been described. As the use of SWE in PFM assessment increases rapidly (see Supplementary Table 1 for an overview of the available literature), these challenges must be addressed to prevent misinformation and inappropriate use of this technology in this specific application.
This article aims to increase awareness of the challenges in SWE image acquisition and analysis, potential pitfalls, common artifacts, and other technical considerations relevant to PFM assessment. Its broader goal is to promote quality and consistency in future SWE research and to highlight areas requiring further investigation.
Scope
Among ultrasound elastography techniques, shear wave imaging includes point shear wave elastography, one-dimensional transient elastography, and two-dimensional (2D) SWE [34]. This article focuses exclusively on 2D SWE, the ultrasound elastography technique most commonly used for musculoskeletal imaging and PFM assessment.
This article builds on existing foundations to describe how SWE may be effectively applied to PFM assessment. General principles of SWE imaging [35,36] and guidelines for its use in the musculoskeletal system [33,37] have been published elsewhere; readers interested in basic SWE concepts are encouraged to consult these resources.
Challenges Related to Image Acquisition and Analysis
This section builds on the current SWE literature by adapting it to the specific requirements of PFM stiffness assessment. By addressing the unique challenges associated with PFM evaluation, this section provides practical considerations for applying SWE in clinical assessment and research.
Image Acquisition Technique
Ultrasound examination setup
As stated in the American Institute of Ultrasound in Medicine/International Urogynecological Association recommendations [38], the examination should be performed with the patient in the lithotomy position and the bladder empty. The patient should be comfortable and stable to minimize unnecessary movement and activation of the PFMs and synergistic muscles. Water-soluble gel should be applied to the probe, which should then be enclosed in a powder- and latex-free glove or a commercial probe cover. An additional generous layer of coupling gel should then be applied over the covering, particularly when superficial structures are being measured [37]. Because muscle activity affects SWE results [39], the assessor should ensure adequate PFM relaxation before SWE assessment. If assessment is attempted during PFM contraction, the patient should receive appropriate instructions on correct contraction, and PFM contraction should be evaluated visually or by palpation. The same principles apply to assessment during bearing down.
Device settings
Musculoskeletal presets are recommended in the literature and available guidelines [16,37,40]. These presets may optimize B-mode visualization and provide appropriate elasticity and/or shear wave speed range settings. Such settings help prevent imaging difficulties when the measured tissue stiffness approaches the upper limit of the device range, which can result in SWE map saturation [41]. However, these presets are usually manufacturer-specific, and their suitability may need to be tested for specific applications. Appropriate settings, such as focal depth, gain, and elasticity/shear wave speed range, may also be adjusted manually. Although optimal settings for SWE assessment of PFMs have not yet been established, the elasticity and/or shear wave speed range should be high enough to avoid SWE map saturation but not so high that image detail is lost [24,40]. The location of the acoustic radiation force pulses, or focal depth, should be adjusted to the depth of the PFMs. Supplementary Fig. 1 presents several parameters used by the authors, including elasticity range and depth, as well as the proposed scanning protocol.
Transducer
Available guidelines recommend high-frequency linear probes for the SWE assessment of superficial myofascial structures [37,42]. Linear transducers have also been used in SWE validation studies of PFMs [24,25]. However, for deeper structures (≥6 cm), shear wave detection problems may occur because acoustic radiation force pulses become attenuated with depth. Lower-frequency curved-array probes may therefore be necessary to provide adequate penetration, because lower-frequency ultrasound is less attenuated at greater depths [42–44]. The probe should be applied with minimal pressure to avoid tissue stiffening due to precompression [36].
Data acquisition
Before SWE data acquisition begins, a clear B-mode image of the structure of interest, free of noise or artifacts, should be obtained [36,37]. Although the color-coded SWE map, also referred to as an elasticity map, can be obtained regardless of B-mode image quality, a high-quality B-mode image helps ensure adequate penetration, low attenuation, and absence of wave propagation artifacts. Such artifacts include shadowing from absorbing structures and reverberation caused by back-and-forth ultrasound propagation between strongly reflecting regions; these artifacts may affect the acoustic radiation force pulse and associated shear wave formation. If these conditions are not met, the measurement may be inaccurate.
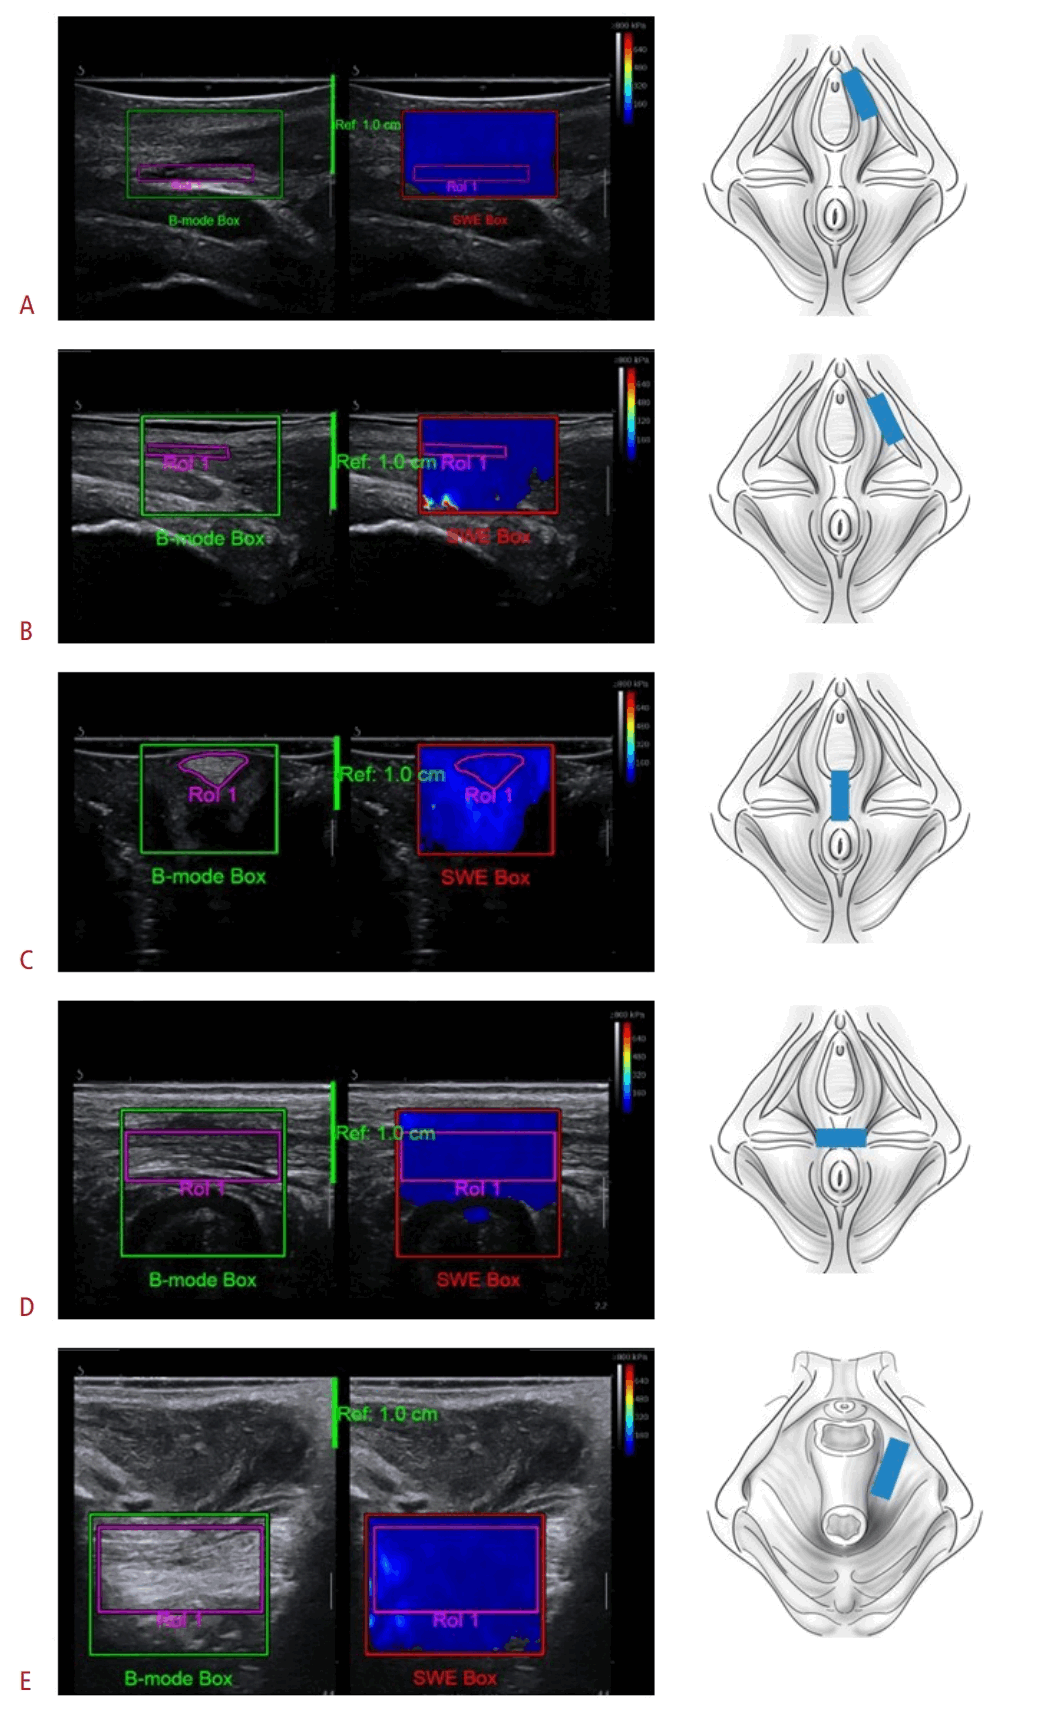
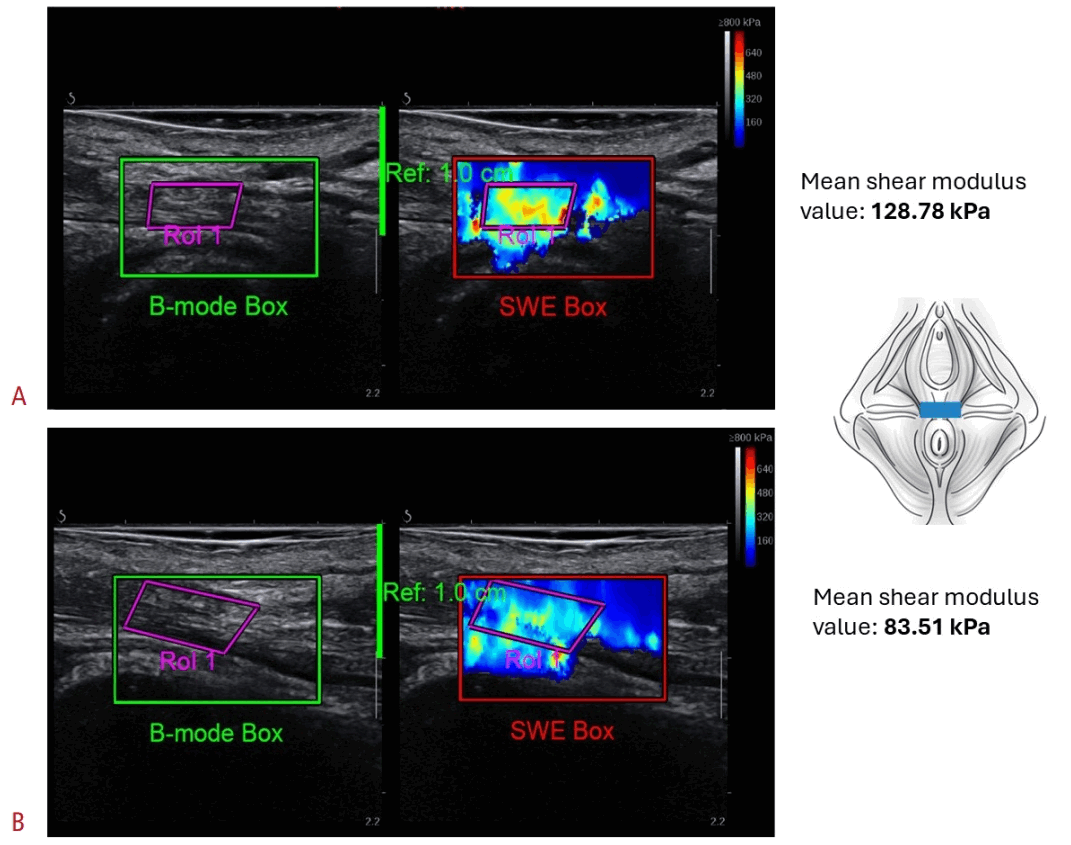
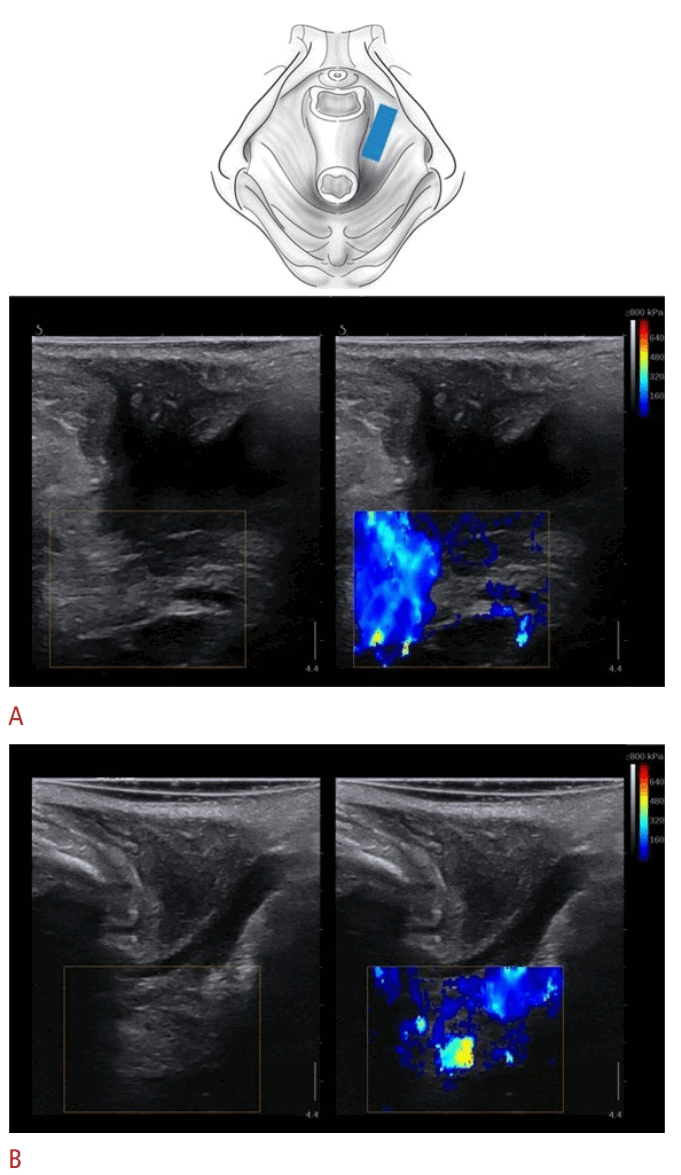
Hyperechoic muscle fibers should be visualized to confirm correct probe placement parallel to the muscle fascicles along the long axis [17]. Because myofascial tissues are anisotropic, even small changes in probe orientation relative to the fiber axis may affect SWE measurements [36], as shown in several studies [45–49]. Specifically, anisotropic muscle structure is characterized by different shear wave speeds or elastic modulus values depending on whether the shear wave front propagates along or perpendicular to the muscle fibers [45,47]. Fig. 1 presents the suggested probe placement for each PFM structure, and Supplementary Fig. 1 provides additional details on correct structure localization. Fig. 2 shows a possible consequence of non-optimal visualization of muscle fibers. The need to account carefully for muscle architecture during SWE assessment of myofascial structures may be challenging because of the dome shape of the PFMs and the pennation angle of some PFMs. For this reason, positioning the probe exactly along the muscle fiber direction may not always be possible, and this limitation may influence SWE measurements [16]. When B-mode image quality is evaluated, key considerations include morphology, particularly muscle fiber visualization, and echogenicity, including hyperechogenicity.
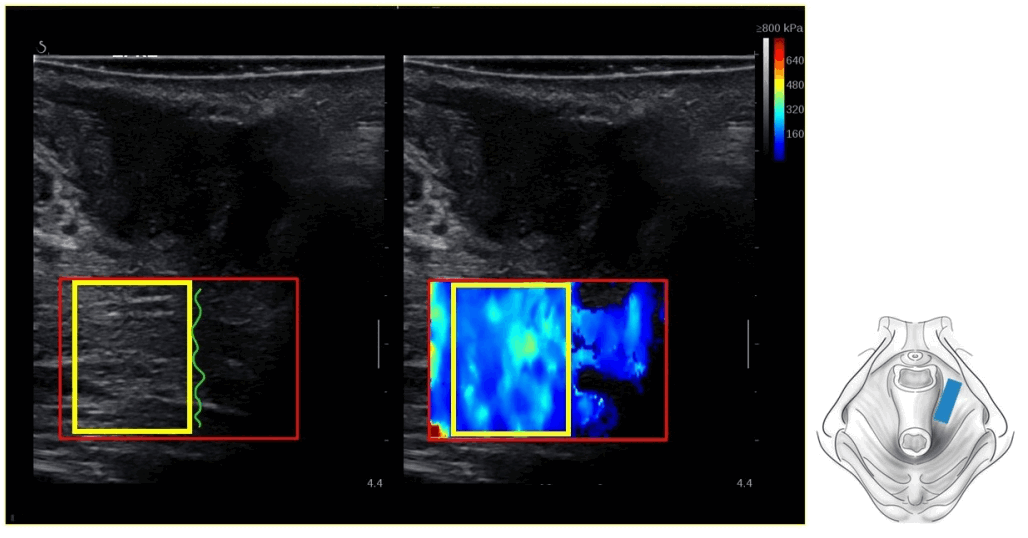
Once the structure of interest has been identified on the B-mode image, SWE assessment can begin with examination of the color-coded map. On most devices, the color-coded SWE map is displayed within the SWE sample box, typically a square or rectangular area that must be positioned over the region of interest (ROI) (Fig. 3). The sample box should be large enough to encompass the measured structure, including its expected movement during contraction assessment, while minimizing inclusion of surrounding tissues that could affect SWE readings, such as bone [33].
Data acquisition may be performed in various muscle states. In the musculoskeletal literature, SWE has been used to assess the resting state, muscle contraction, and stretching or lengthening [50]; similarly, in PFM assessment, it has been applied during rest, voluntary contraction, and bearing down [15,27,29]. Recent studies have shown that PFM SWE measurements (expressed as shear elastic modulus) correlate with surface electromyography findings at various contraction levels, supporting the validity of SWE for assessing PFM stiffness, particularly in the puborectalis muscle [24,25]. Resting tissue assessment is more straightforward and is therefore more commonly performed in musculoskeletal studies [23]. However, evaluation of more dynamic states, such as contraction, introduces substantial complexity. In musculoskeletal research, a major limitation is that, at higher contraction levels, tissue stiffness may become so high that rapidly moving shear waves are not properly tracked by the ultrasound system [50,51]. Because PFMs are small structures and likely do not reach the same stiffness levels as larger skeletal muscles, this issue may not be a major limitation. Nevertheless, SWE assessment of PFM contraction presents distinct challenges.
PFM contraction results from the coordinated action of structures with different fascicle orientations, shapes, and attachment points [52]. Broadly, PFM contraction produces two key mechanical actions: a supportive lifting force for the pelvic viscera and a constrictor force that affects the urethra, vagina, and anal canal [53]. The puborectalis muscle and broader levator ani complex generate cranial and ventral lifting forces, commonly described as the classic “squeeze and lift” movement [54]. These forces narrow the hiatus and support the pelvic organs through shortening of the levator components and ventral traction on the anal canal and vaginal wall [1,53]. During this action, the pelvic floor changes shape from a basin to a dome as the levator ani lifts the pelvic viscera cranially [53]. Contraction of the superficial bulbospongiosus and ischiocavernosus muscles narrows the vaginal opening and generates descending movement of the clitoris toward the introitus [55], whereas the transverse perineal muscles act around the perineal body to provide anterior–posterior superficial support and contribute to constrictor forces [1]. Distinct movement planes and fiber directions, together with difficulty generating a stable contraction—particularly in smaller PFM structures, such as the bulbospongiosus and ischiocavernosus muscles—may create challenges in SWE data acquisition. These factors are discussed further in the following sections.
SWE data acquisition methods vary by device and system. Most systems offer cine-loop recording capabilities, enabling data analysis after assessment is completed. As noted above, researchers may be interested in assessing PFMs not only at rest but also during functional tasks, such as contraction or bearing down. Cine-loop recording allows different muscle states, such as the transition from rest to contraction, to be combined in a single recording. If the device does not offer cine-loop recording, multiple acquisitions must be performed to ensure optimal image selection during analysis. Core components of the image acquisition technique are presented in Table 1.
Principles and Challenges of Data Analysis
SWE analysis may be performed directly on the device or offline with external post-processing software, such as ElastoGUI [56] or other custom MATLAB scripts [25]. Before SWE measurements are acquired, the color-coded map should be allowed to stabilize for a few seconds, as recommended in the musculoskeletal literature [36,37]. For example, during assessments involving contraction or bearing down, changes in the SWE color-coded map may lag slightly behind the transition from one muscle state to another. Therefore, after the measurement point is reached, such as maximal voluntary contraction, approximately 1 second or a few frames may be needed for the SWE color-coded map to stabilize and ensure accurate readings (Fig. 4).
Within the color-coded map, an ROI, or measurement box, is selected for SWE data analysis and should cover the structure being assessed (Fig. 3). SWE measurements should be sampled from images with good color filling within the ROI. No established threshold defines a valid SWE measurement in the musculoskeletal SWE literature; however, based on liver SWE studies, color filling of greater than 50% within the ROI is recommended for valid measurements [57,58].
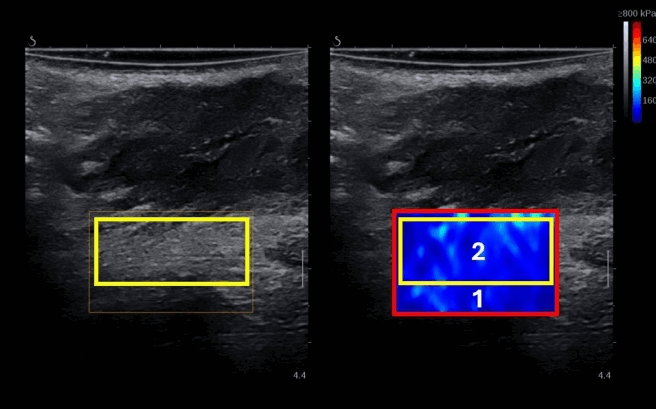
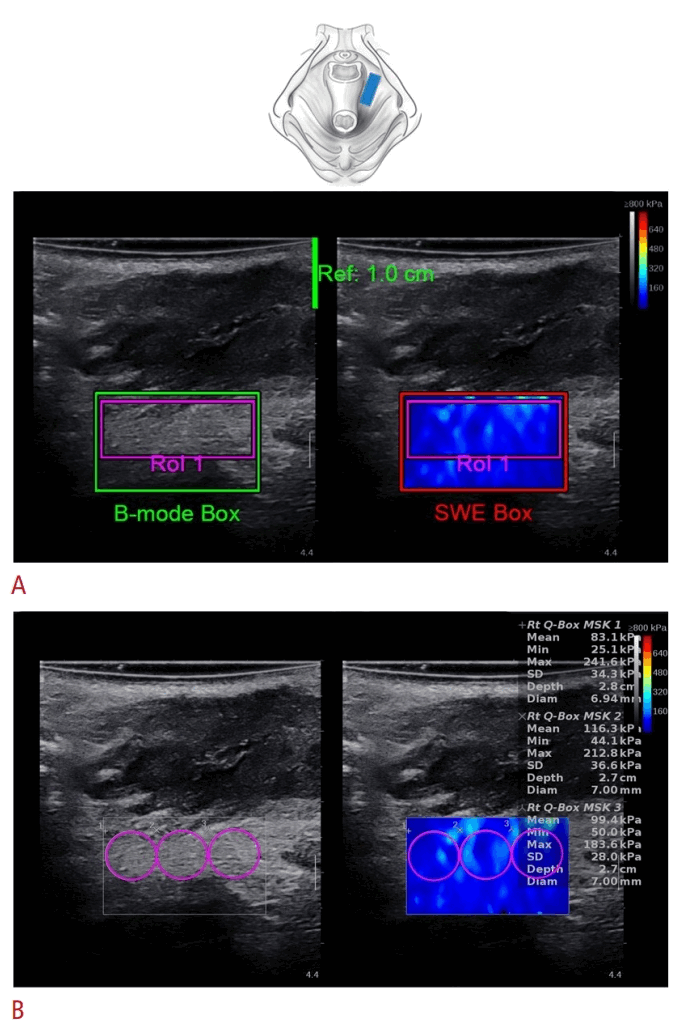
The ROI should be large enough to cover the largest possible area of the structure of interest [40]. Alternatively, several small ROIs, such as Q-boxes, may be averaged to represent the value of the targeted structure (Fig. 5). In addition, the SWE map within the ROI should be relatively homogeneous, located away from interfaces between structures with different stiffness values, and free of vessels or ligaments if possible [35,59]. Stiffness measurements should be avoided in areas with SWE dropout, defined as areas without a color-coded map within the ROI [60]. The ROI should also exclude regions containing artifacts, which may bias SWE measurements and/or increase measurement variance [61]. Sampling the ROI in hypoechoic areas on the B-mode image should also be avoided because the sampled structure cannot be identified with certainty (Fig. 6). Fluid-filled hypoechoic structures do not permit shear wave propagation, and SWE values in these areas are typically measurement artifacts.
From the available cine-loop or acquisitions, several frames or images with stable SWE color-coded maps should be selected and averaged during analysis [31,62]. Averaging reduces the influence of non-optimal images, such as those containing artifacts or poor SWE filling. It also mitigates errors associated with SWE temporal variability [16]. The optimal number of acquisitions and the optimal number of frames or images to average in PFM or musculoskeletal SWE assessment are currently unknown. Averaging three [63] to 10 frames [16] or images is commonly reported. Some authors average not only frames or images within a single acquisition but also measurements across several acquisitions, such as repeated contractions or bearing-down maneuvers [63].
Another critical aspect of reliable SWE data analysis is the choice of measurement unit. Common options include shear wave speed (m/s), shear elastic modulus (kPa), and the Young modulus (kPa). According to the available SWE literature, shear elastic modulus and the Young modulus are not optimal for measuring the stiffness of anisotropic tissues such as muscle [33,37]. Shear wave speed should therefore be preferred because it does not rely on an equation that assumes locally homogeneous, isotropic, and purely elastic tissue [21,33,37,64]. In addition, shear wave speed tends to provide more reliable results than elastic moduli [65]. However, when the probe is carefully positioned longitudinally along the muscle fibers, both shear elastic modulus and the Young modulus can provide repeatable measurements of muscle tissue [16,18,45]. In the musculoskeletal literature, the shear elastic modulus is used more commonly than the Young modulus [23,50]. Some authors prefer the shear elastic modulus over the Young modulus, and in both the PFM [66] and musculoskeletal literature [67-71], measurements obtained as the Young modulus are sometimes divided by 3 to derive shear modulus values [66,68–72]. This calculation assumes an incompressible material, meaning a Poisson ratio close to 0.5, which is generally considered valid for biological tissues. However, although dividing the Young modulus by 3 to obtain the shear elastic modulus may facilitate comparison between studies, the assumption of muscle incompressibility may not hold [73].
SWE metrics are commonly reported as mean, minimum, maximum, and standard deviation values, which may provide insight into tissue heterogeneity. However, because the SWE value is typically interpreted as a stiffness measurement, mean values should preferably be reported [36], especially in muscle assessments [40,74]. Finally, some manufacturers provide quality metrics or quality maps to support the interpretation of measurement reliability. Reporting these metrics may be informative when they are available. The key principles of data analysis are presented in Table 2.
Potential Pitfalls, Common Artifacts, and Other Technical Considerations
At first glance, SWE may appear straightforward because the color-coded map can be visualized easily once an external transducer is positioned on the perineum. However, the acquisition, processing, analysis, and interpretation of SWE images are considerably complex and carry substantial potential for misinterpretation. Several factors must be considered during SWE data acquisition and analysis to obtain valid and reliable results; these factors are described in this section.
Averaging Frames (Images)
In PFM assessment, the decision regarding how many frames or images to average may be influenced by the frame rate of the device. Whether averaging three frames acquired at 1 frame/second differs from averaging frames acquired at a higher frame rate, such as 11 frames/second (11 Hz), remains to be studied. This question may be particularly important when evaluating sustained activity, such as maximal voluntary contraction, because SWE values may change substantially between frames. These changes may result not only from SWE temporal variability but also from muscle fatigue over time. In addition, identifying stable B-mode and SWE frames during analysis of PFM contraction may be difficult. These difficulties may stem from instability inherent to the task itself, such as difficulty sustaining maximal contraction in a patient with impaired endurance or during assessment of superficial PFMs. Because PFM movement has been shown to interfere with SWE measurements [24], devices with a low acquisition frame rate, such as 1 frame/second, may produce relatively high interframe variability in duplex B-mode and SWE imaging.
Conversely, selecting stable B-mode and SWE maps may be easier with high-frame-rate acquisition, potentially resulting in lower interframe variability. However, when only a few frames are averaged, such as three frames, and the acquisition frame rate is higher, such as 11 frames/second, questions arise regarding the representativeness of data from these three frames and whether this approach affects intra- and inter-rater reliability. These aspects of SWE assessment of PFMs remain to be studied.
SWE Signal Dropout and SWE Penetration Issues
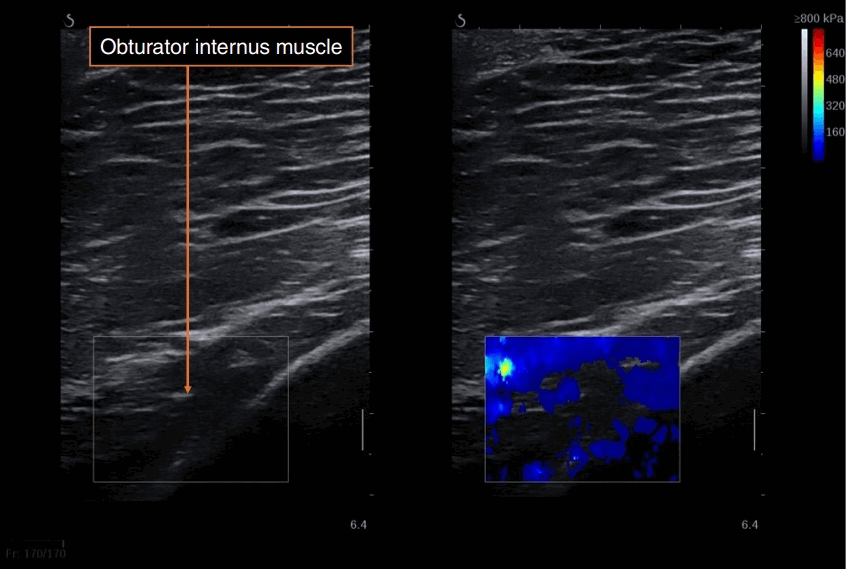
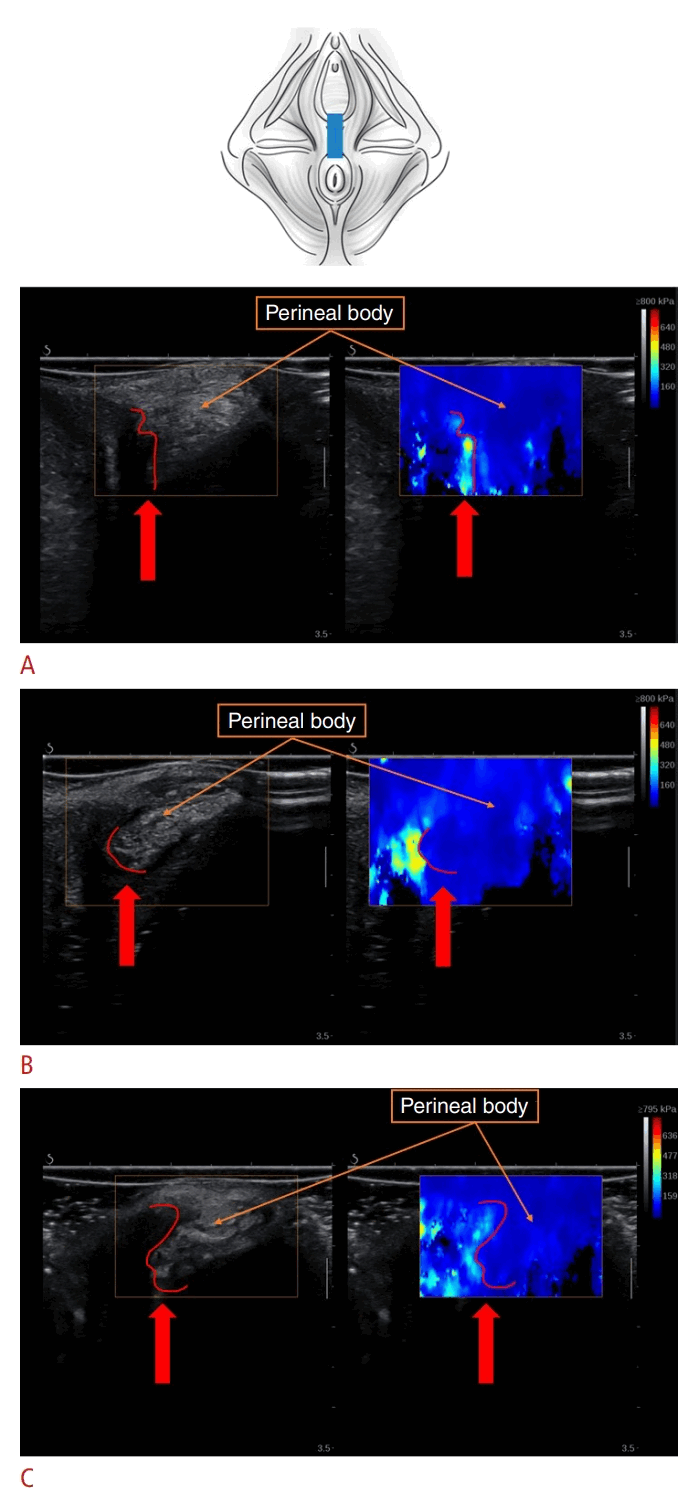
SWE signal dropout, defined as an area within the color-coded box where no SWE data are obtained, may occur for several reasons: insufficient acoustic gel, non-optimal B-mode visualization (Fig. 7) or device settings, the presence of liquid or liquid-filled structures, posterior elastographic shadowing artifact, highly stiff structures (Fig. 8), hypoechoic lesions, or excessive depth of the assessed structure (Fig. 9) [36]. Some instances of signal dropout can be readily identified and corrected, such as by selecting and positioning the probe appropriately or modifying device settings.
SWE Image Heterogeneity
In SWE imaging, color-coded maps may appear homogeneous, with uniform color and no substantial variation. Alternatively, they may show varying degrees of heterogeneity, depicted by diverse colors that suggest different levels of tissue elasticity within the assessed structure. Muscles usually appear less homogeneous than healthy liver or skin on SWE imaging due to the intrinsic heterogeneity of muscle tissue. This heterogeneity results from intramuscular connective tissue, nerves, and blood and lymphatic vessels, all of which may influence the SWE color-coded map [33]. The heterogeneous pattern may also be partly attributable to shear wave motion artifacts, such as reflection and diffraction at angulated interfaces or the absence of motion within blood vessels and gas-containing structures. This issue is particularly important in PFM SWE imaging because structures such as bone, blood vessels, fluid, and air-filled body cavities are nearby.
Consequently, areas suggesting increased stiffness may be observed within the area of interest but not necessarily reflect the assessed structure. These areas should be avoided when the ROI is sampled [75]. For example, an artifactual reading may suggest increased stiffness near signal dropout—that is, an area with missing SWE data—near a hypoechoic area on B-mode imaging, or at an interface between tissues with different stiffness values (Fig. 10).
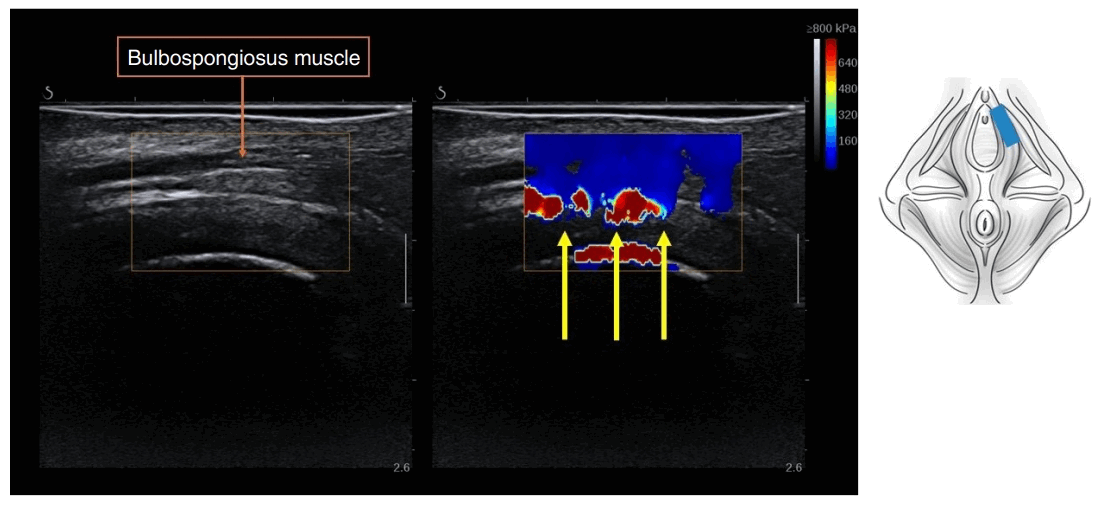
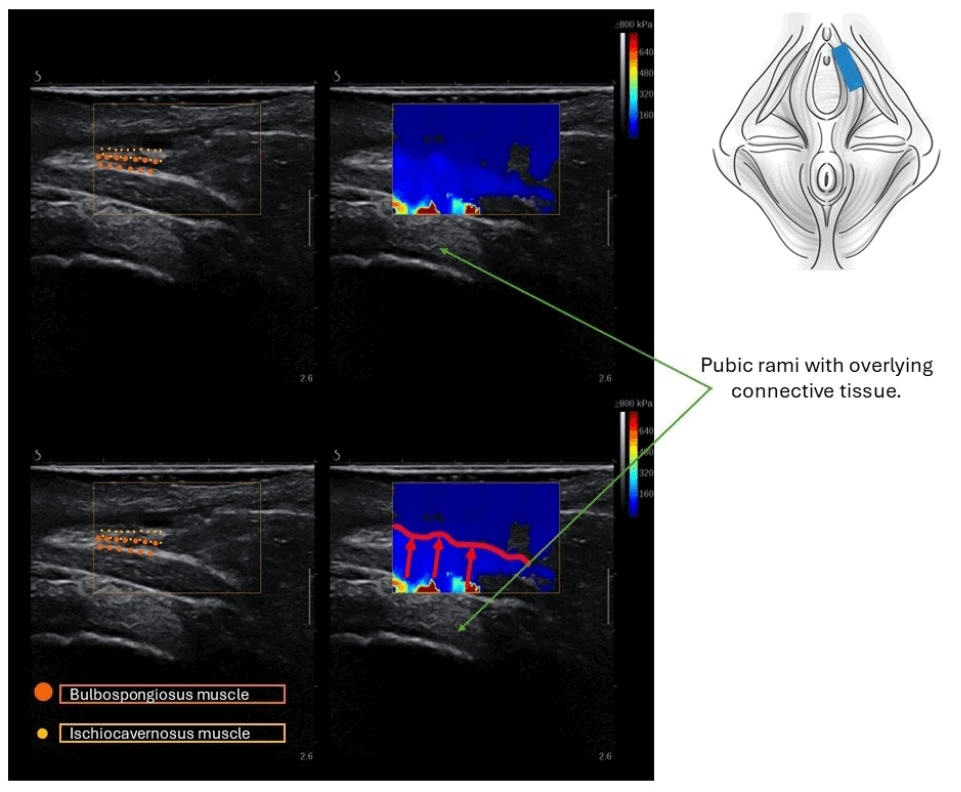
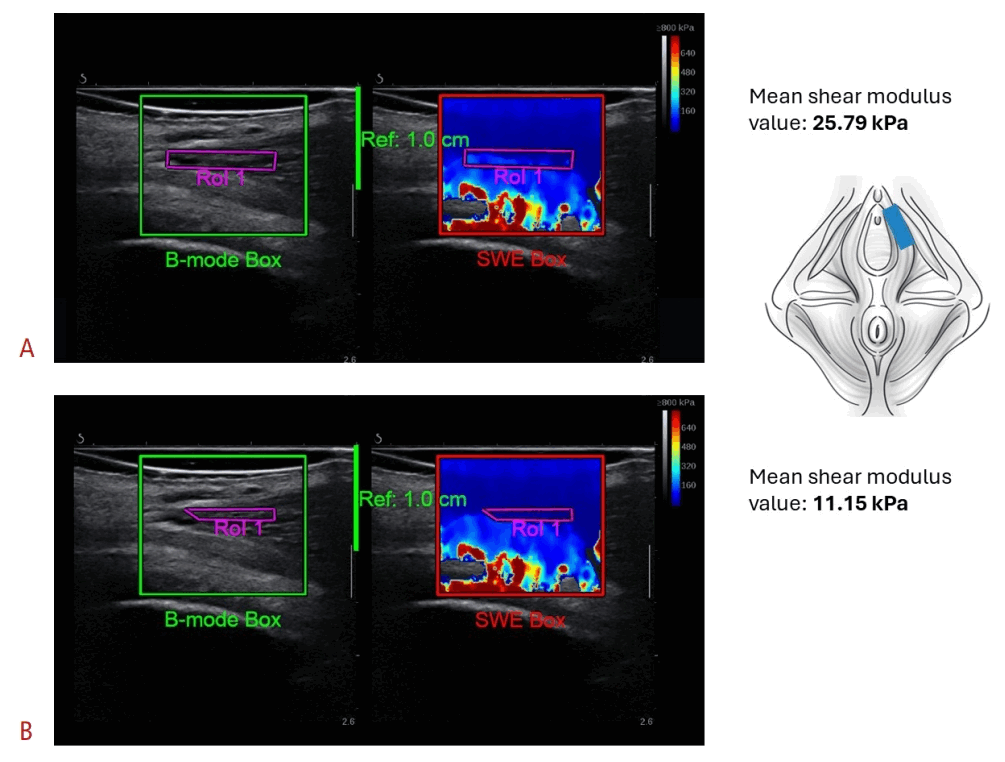
Small and thin PFM structures, such as the bulbospongiosus or ischiocavernosus muscles, are particularly susceptible to these issues due to their proximity to bone. The so-called “reflection artifact” [33] may extend from these stiffer structures into the muscle of interest, as illustrated in Fig. 11. Deciding whether to include this area in the ROI is critical because it may influence mean SWE metrics, as shown in Fig. 12.
Determining whether a color shift reflects an actual change in stiffness, such as that caused by voluntary contraction, or merely an artifact influenced by nearby structures can be challenging. Omitting regions that display inherent tissue heterogeneity could cause relevant findings to be overlooked; however, including areas in which readings are affected by surrounding tissues would also be erroneous.
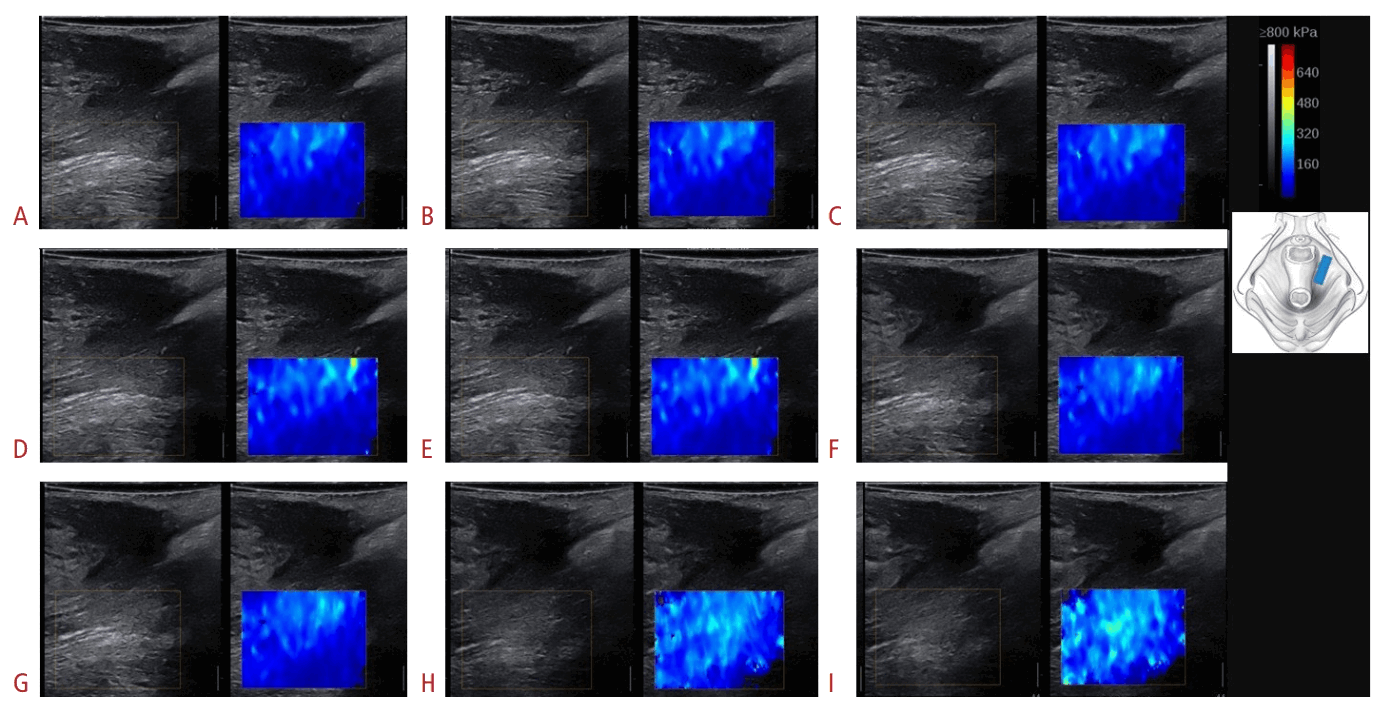
During assessment at rest, the SWE color-coded map of the measured PFM structure should be relatively uniform unless substantial muscle pathology [33], a myofascial trigger point or taut band, or increased muscle tone is present. If the SWE color map is substantially heterogeneous at rest (Fig. 13), it is essential to determine whether the same localized pattern of increased stiffness remains consistent across frames and acquisitions. In addition, measurements are usually most accurate near the center of the image and close to the transducer’s elevational focus [75]. Sampling laterally at the edge of the image may produce less consistent results because fewer shear wave motion patterns are available for processing on both the left and right sides of the image [59].
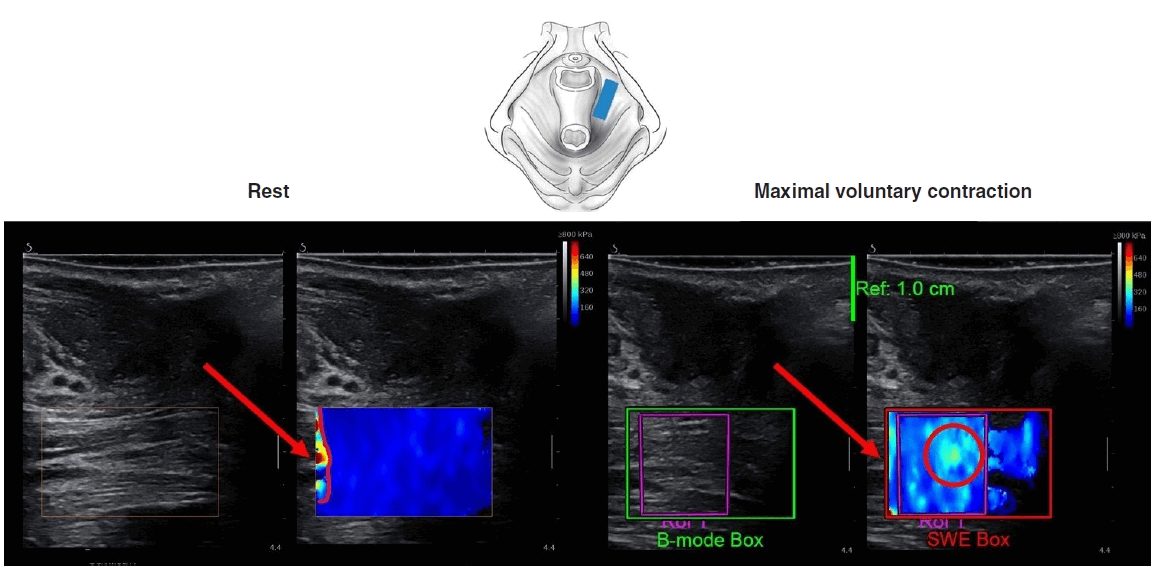
The dilemma regarding ROI placement becomes particularly pronounced during contraction assessment, when a mosaic-like, heterogeneous SWE color map is typically observed. It may be difficult to determine whether localized stiffness in a specific area reflects a true contraction-related increase in stiffness or a change in the SWE color map that is unrelated to muscle stiffness and/or artifactual (Fig. 14).
The best approach for reliable SWE assessment of PFM contraction is currently uncertain. Including both rest and contraction in the same recording may help guide correct ROI placement (Fig. 15). This approach may enable the assessment of consistency between frames during contraction and the careful observation of changes from rest to contraction. Similar issues may arise when assessing PFM during the bearing-down maneuver; therefore, the same approach could be used.
Compression
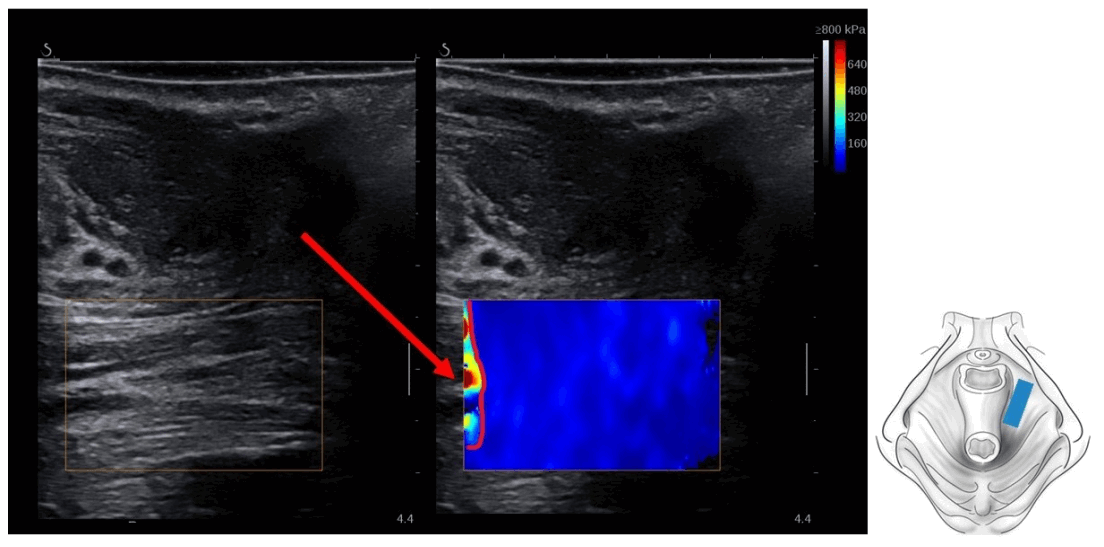
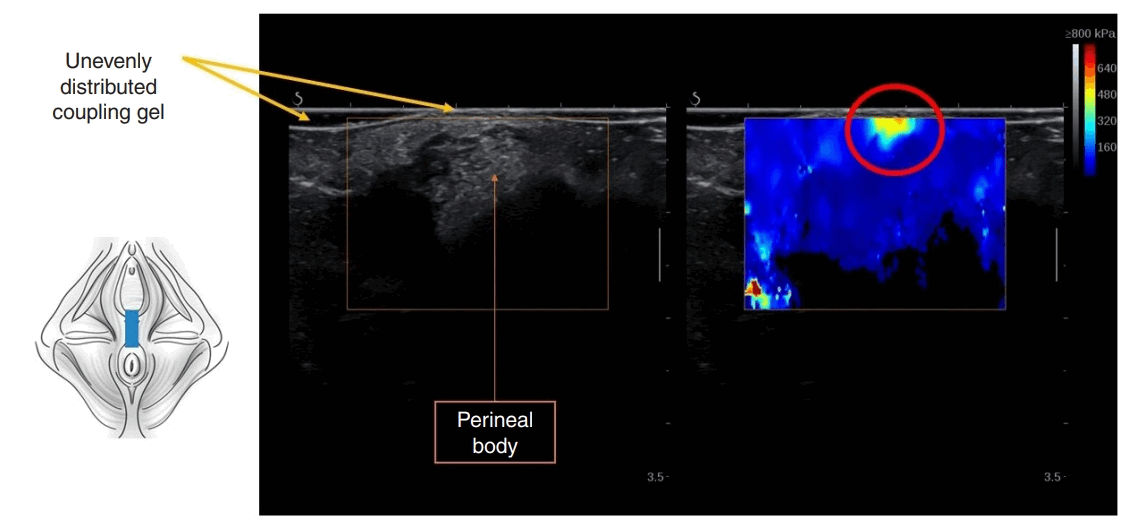
Excessive compression with the transducer may result in a “bang artifact,” which can appear as a region of high stiffness in the near field (close to the probe at the top of the color-coded sample box) (Fig. 16) [76]. In many cases, reducing compression and evenly spreading a generous layer of coupling gel may be helpful.
Conclusion
As with all medical imaging techniques, a clear understanding of acquisition techniques and image analysis is important for successful SWE imaging, particularly in tissue-specific applications such as PFM imaging. Understanding the physics underlying the technique and the image formation process also helps avoid common artifacts. Adherence to established image acquisition principles and recognition of common pitfalls may help produce reliable measurements and promote consistency across research studies. Despite advances in SWE imaging of PFMs, many questions remain. Future research should further develop and refine SWE techniques in this field to enhance clinical translation. Studies evaluating reliability, validity, and responsiveness are still needed in this setting.

 XML Download