



 PDF
 Citation
 Print


INTRODUCTION
Hyperuricemia, defined as an abnormally elevated serum uric acid concentration, is the biochemical precursor to monosodium urate crystal deposition diseases, including gout, uric acid kidney disease, or uric acid nephrolithiasis [1]. Hyperuricemia results from urate overproduction, impaired renal uric acid excretion, or reduced intestinal secretion, and is influenced by genetic, metabolic, and environmental factors [2,3]. In addition to its association with urate crystal deposition disease, hyperuricemia has been linked to a range of disorders, including hypertension, cardiovascular disease, type 2 diabetes mellitus, obesity, and metabolic syndrome [4-8]. Accordingly, hyperuricemia is increasingly recognized as a global public health issue.
The prevalence and patterns of hyperuricemia differ by sex: men experience higher rates and earlier onset, whereas the prevalence is lower in pre-menopausal women and higher in those at menopause [9]. These sex-specific differences are largely attributable to variations in estrogen levels between men and women. Menopausal transition is independently associated with increased serum uric acid levels, even after adjusting for age, body mass index (BMI), and other factors [10,11]. Additionally, estradiol levels are inversely correlated with uric acid concentration in women, and hormone replacement therapy in postmenopausal women has been shown to reduce serum uric acid levels [12].
Dietary factors are among the most modifiable determinants of serum uric acid levels. High consumption of purine-rich foods, red meat, alcohol, sugar-sweetened beverages, and ultra-processed foods increase risk, whereas that of dairy products, vegetables, coffee, and vitamin C-rich fruits may be protective against hyperuricemia or gout [13-17]. Considering overall dietary patterns and their quality, rather than focusing on individual foods or nutrients, provides a more realistic and clinically relevant perspective, as people consume complex combinations of foods in daily life. Several studies have examined the relationship between overall diet quality and hyperuricemia, and most have reported that higher diet quality is associated with a lower risk of hyperuricemia [18-21]. Since there is a difference in the prevalence, age-related patterns, and hormonal influences of hyperuricemia in men and women, the impact of diet quality may also vary by sex. Some prior studies have reported inconsistent sex-stratified results [19,21], and population-based studies including parallel analyses of men and women are limited. Therefore, we aimed to evaluate sex-specific associations between overall diet quality and hyperuricemia in Korean adults using nationally representative data.
MATERIALS AND METHODS
Design, data source, and study population
We utilized data from the 8th Korea National Health and Nutrition Examination Survey (KNHANES) conducted from 2019 to 2021. KNHANES is a nationally representative, cross-sectional survey conducted by the Korea Disease Control and Prevention Agency (KDCA), designed to assess the health and nutritional status of the Korean population. Data were collected through a health interview survey, a health examination survey, and a nutrition survey. Demographic characteristics and lifestyle factors, including alcohol consumption and smoking status, were obtained from the health interview survey. Anthropometric measurements, blood pressure, and laboratory results were gotten from the health examination survey. Dietary intake data were collected using the 24-hour dietary recall method administered by trained interviewers, who recorded all foods and beverages consumed by participants on the day prior to the survey. The KNHANES protocol was approved by the Institutional Review Board of the KDCA (approval numbers: 2018-01-03-P-A, 2018-01-03-C-A, and 2018-01-03-2C-A). All participants provided written informed consent. The data used in this study were publicly available and obtained from the KDCA website (https://knhanes.cdc.go.kr/knhanes).
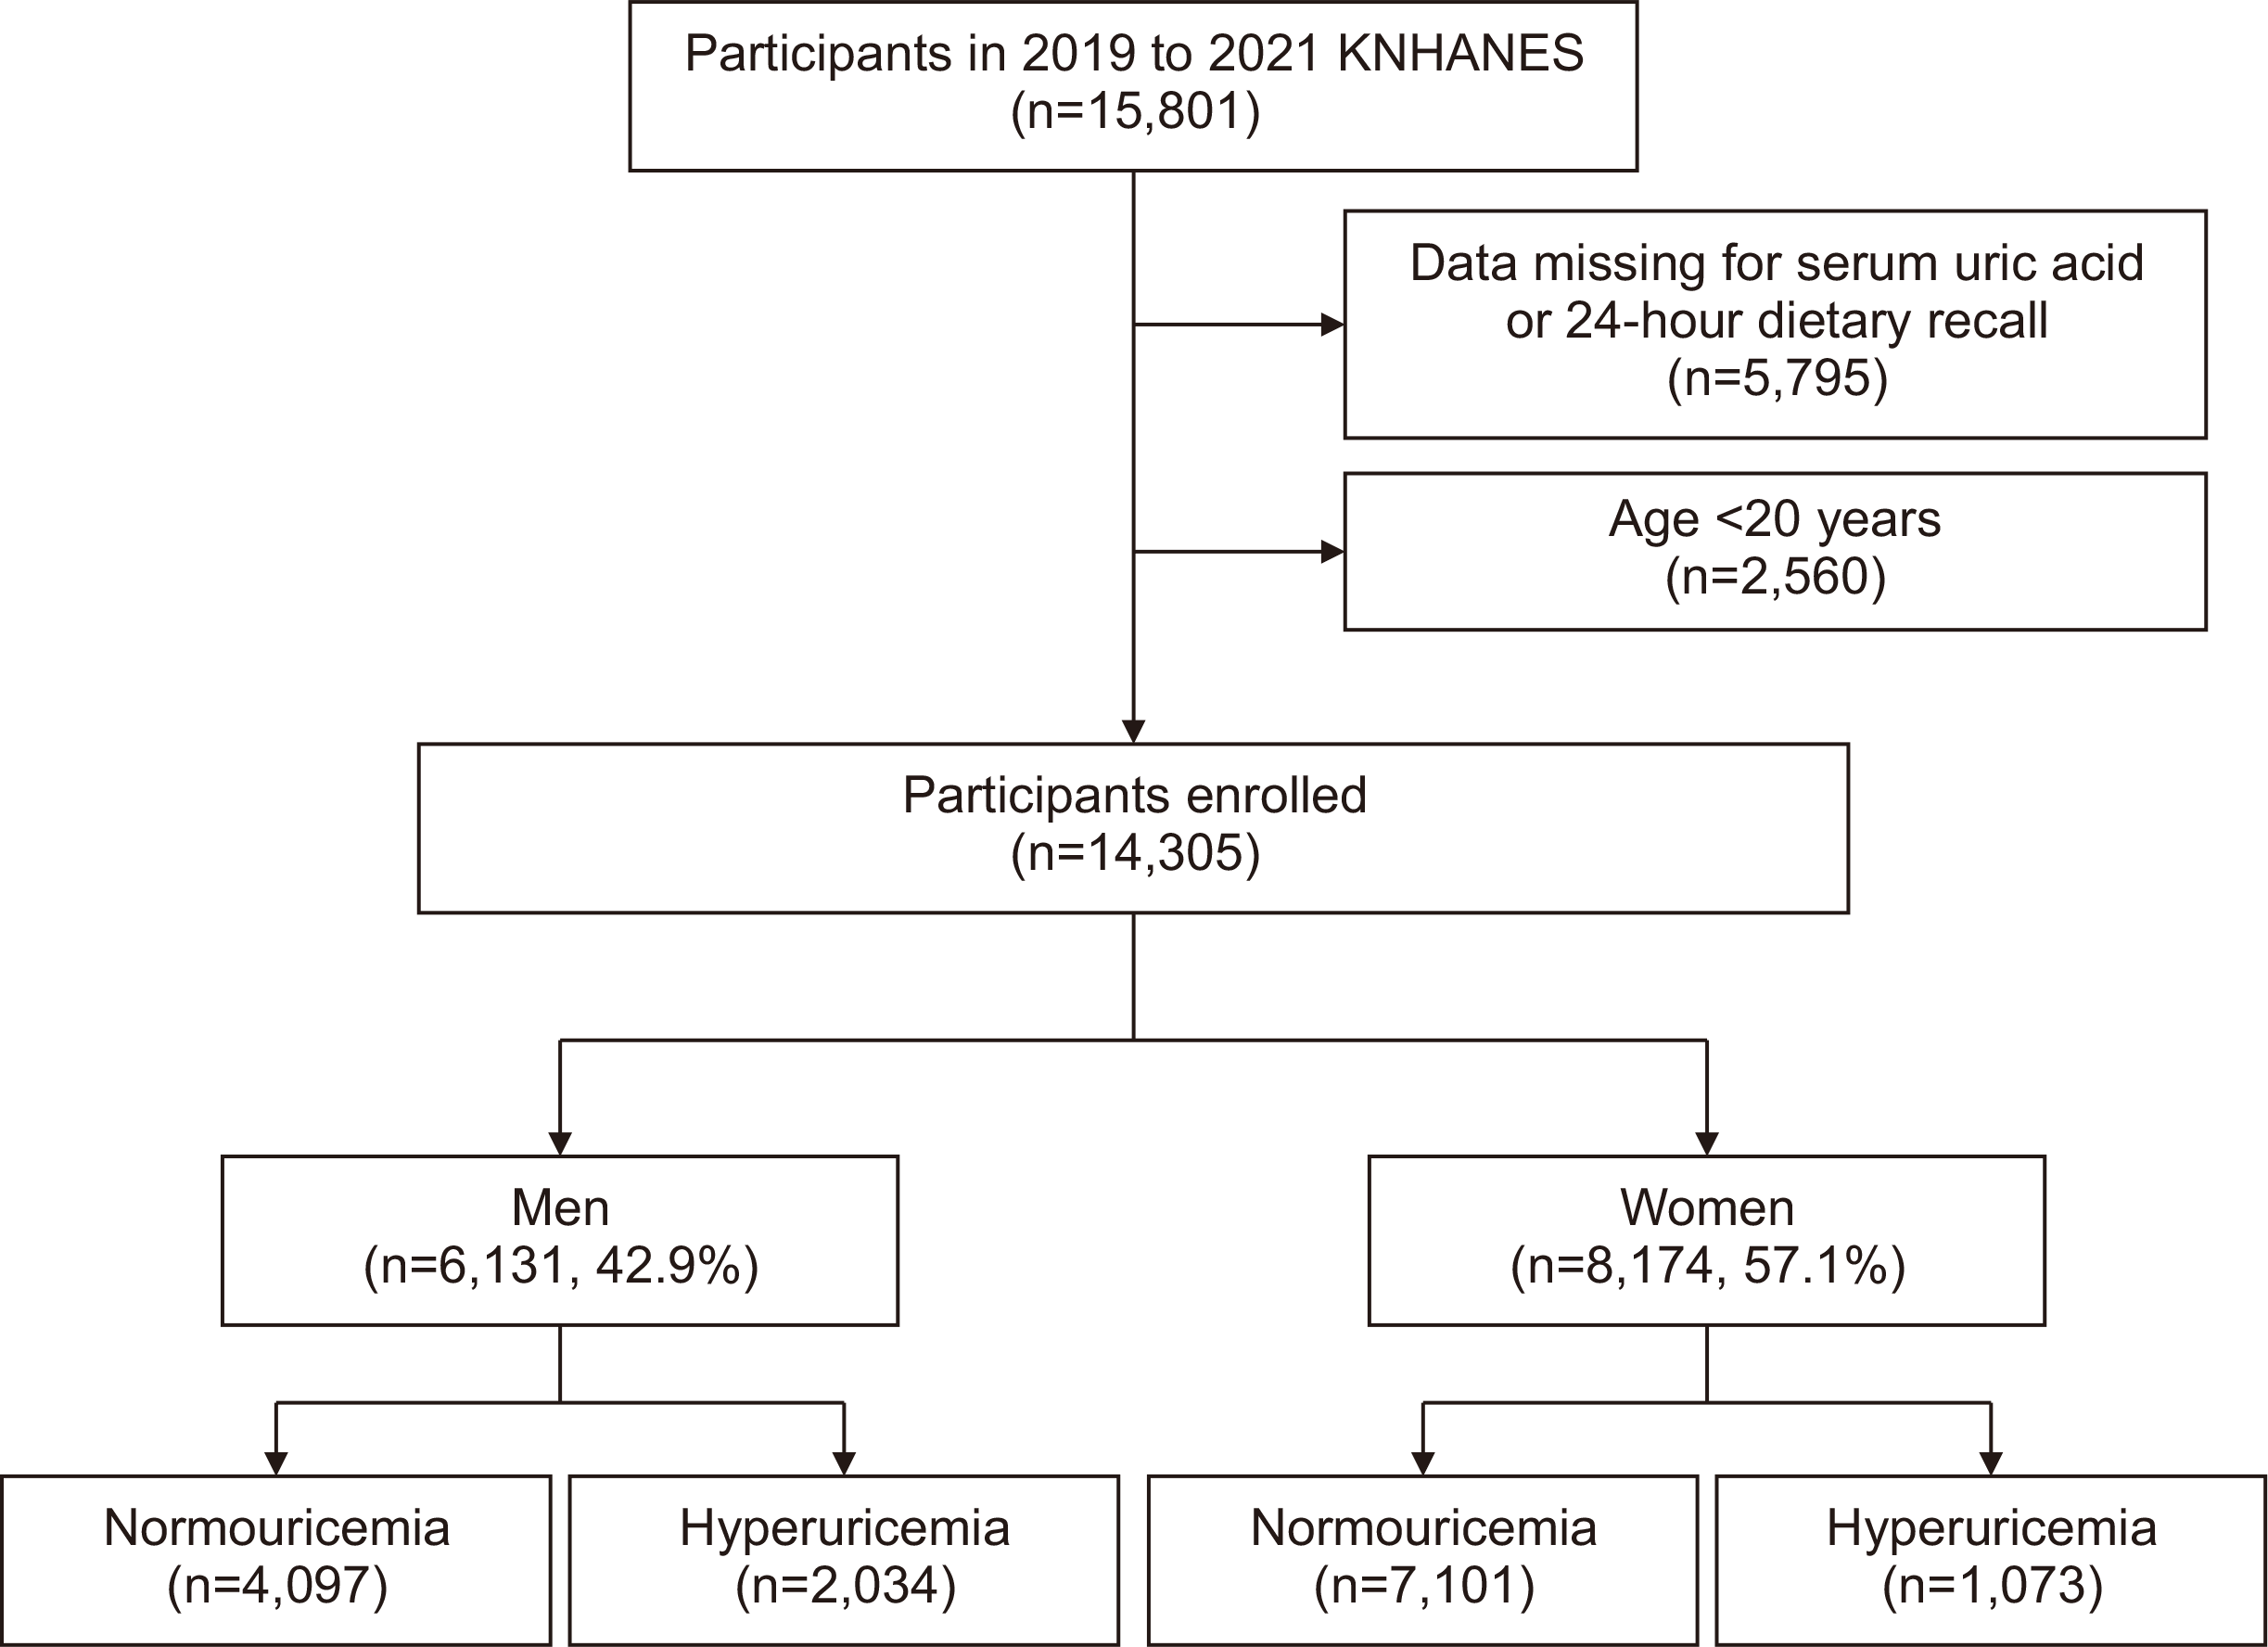
Figure 1 outlines the process of study population selection. This study initially included 15,801 participants across 3 years. After excluding individuals with missing data on serum uric acid or dietary intake (n=5,795), and those younger than 20 years (n=2,560), a total of 14,305 adults aged ≥20 years were included in the final analysis.
Measures
1) Serum uric acid
Serum uric acid concentrations were measured by the uricase method (Qualigent UA reagent; Sekisui Medical, Tokyo, Japan) using a Labospect 008AS analyzer (Hitachi, Tokyo, Japan). In this study, hyperuricemia was defined as serum uric acid levels ≥7.0 mg/dL in men and ≥6.0 mg/dL in women, based on commonly accepted clinical thresholds [6,21,22].
2) Healthy Eating Index
Diet quality was assessed using the Korean Healthy Eating Index (HEI) [23], a validated tool developed to evaluate the overall quality of dietary intake based on the Dietary Guidelines and the Dietary Reference Intakes for Koreans [24], and adapted from the framework of the U.S. HEI-2015 [25]. The Korean HEI is composed of 14 components that comprehensively reflect dietary behaviors and nutritional balance. These components assess the adequacy of food and nutrient intake (e.g., breakfast consumption, intake of mixed grains, fruits, vegetables, dairy products, and sources of protein such as meat, fish, eggs, and beans), the moderation of potentially harmful dietary elements (e.g., intake of saturated fatty acids, sodium, and energy from sweets and beverages), and the balance of macronutrient distribution and overall energy intake. The total score ranges from 0 to 100, with higher scores indicating better adherence to dietary guidelines and healthier eating patterns. In this study, HEI scores were obtained from the processed dataset based on the 2019~2021 KNHANES, as released by the KDCA in 2023.
3) Food group classification and intake calculation
Food group classification was based on the KNHANES system, which categorizes food items into 18 groups: cereals and cereal products, starch roots and starch products, sugars and sweeteners, legumes, nuts and seeds, vegetables, mushrooms, fruits, seaweeds, seasonings, meats and meat products, eggs, fish and fish products, milks and dairy products, beverages, alcohols, animal fats, and plant oils. The total intake for each food group was calculated as the sum of all food items consumed within that group during a single 24-hour period, based on 24-hour dietary recall data. Classification and analysis of food items were conducted using the 10th edition of the Korean Food Composition Table published by the Rural Development Administration in 2022 [26].
4) Covariates
Confounding variables included sex, age (years), BMI (kg/m2), current smoking (yes/no), alcohol consumption (yes/no), fasting blood glucose (mg/dL), systolic blood pressure (mmHg), diastolic blood pressure (mmHg), total cholesterol (mg/dL), triglycerides (mg/dL), total energy intake (kcal/day).
Statistical analysis
All statistical analyses applied survey sampling weights to account for the complex, multistage probability sampling design of the KNHANES and to ensure estimates that are representative of the Korean population. Categorical variables were presented as weighted percentages, and continuous variables as weighted means, both with standard errors. Differences between categorical and continuous variables were evaluated using the Rao–Scott chi-square test and t-test, respectively.
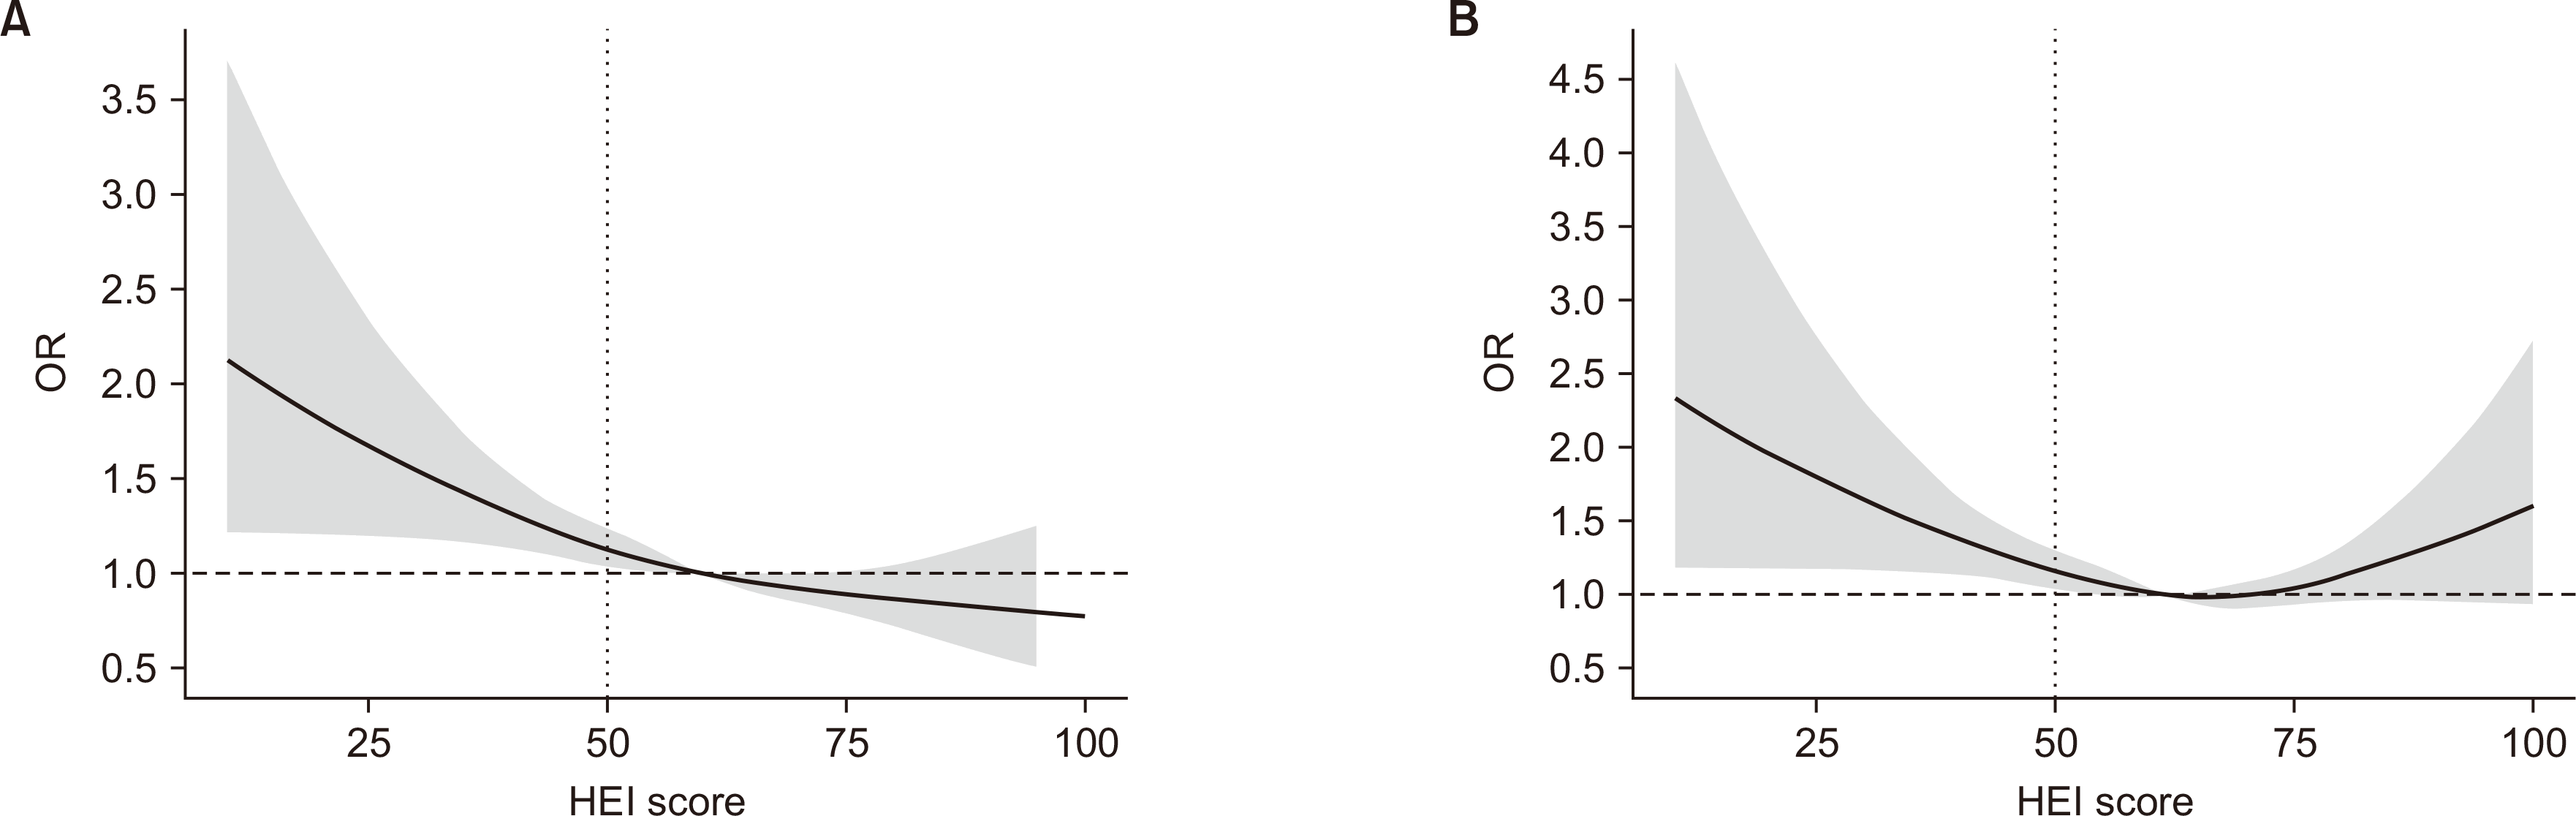
To assess potential non-linear associations between HEI and hyperuricemia, we fitted sex-stratified multivariable logistic regression models with restricted cubic splines (RCS), using four knots at the 5th, 35th, 65th, and 95th percentiles of the HEI distribution. The models were adjusted for age, BMI, current smoking, alcohol consumption, fasting blood glucose, systolic and diastolic blood pressure, total cholesterol, triglycerides, and total energy intake. Odds ratios (ORs) and 95% confidence intervals (CIs) were estimated across the full range of HEI scores, with HEI=50 set as the reference point (OR=1.0). Analyses were conducted in R version 4.3.1 (R Foundation for Statistical Computing, Vienna, Austria).
For categorical analyses, HEI scores were categorized into quartiles: Q1 (lowest diet quality, reference group), Q2, Q3, and Q4 (highest diet quality). Multivariable logistic regression adjusted for the same covariates as those included in the RCS models was performed to estimate ORs and 95% CIs for hyperuricemia across quartiles. Linear trends across quartiles were assessed by assigning each quartile a median HEI value and modeling this variable as a continuous term. Sensitivity analyses of the associations between quartiles of HEI scores and hyperuricemia that were further adjusted for the socioeconomic status (household income and education level), physical activity, presence or absence of chronic kidney disease (CKD), and menopausal status were performed. A p-value<0.05 was considered significant. These analyses were conducted using IBM SPSS Statistics for Windows, Version 30.0 (IBM Co., Armonk, NY, USA).
RESULTS
Prevalence of hyperuricemia according to sex and age
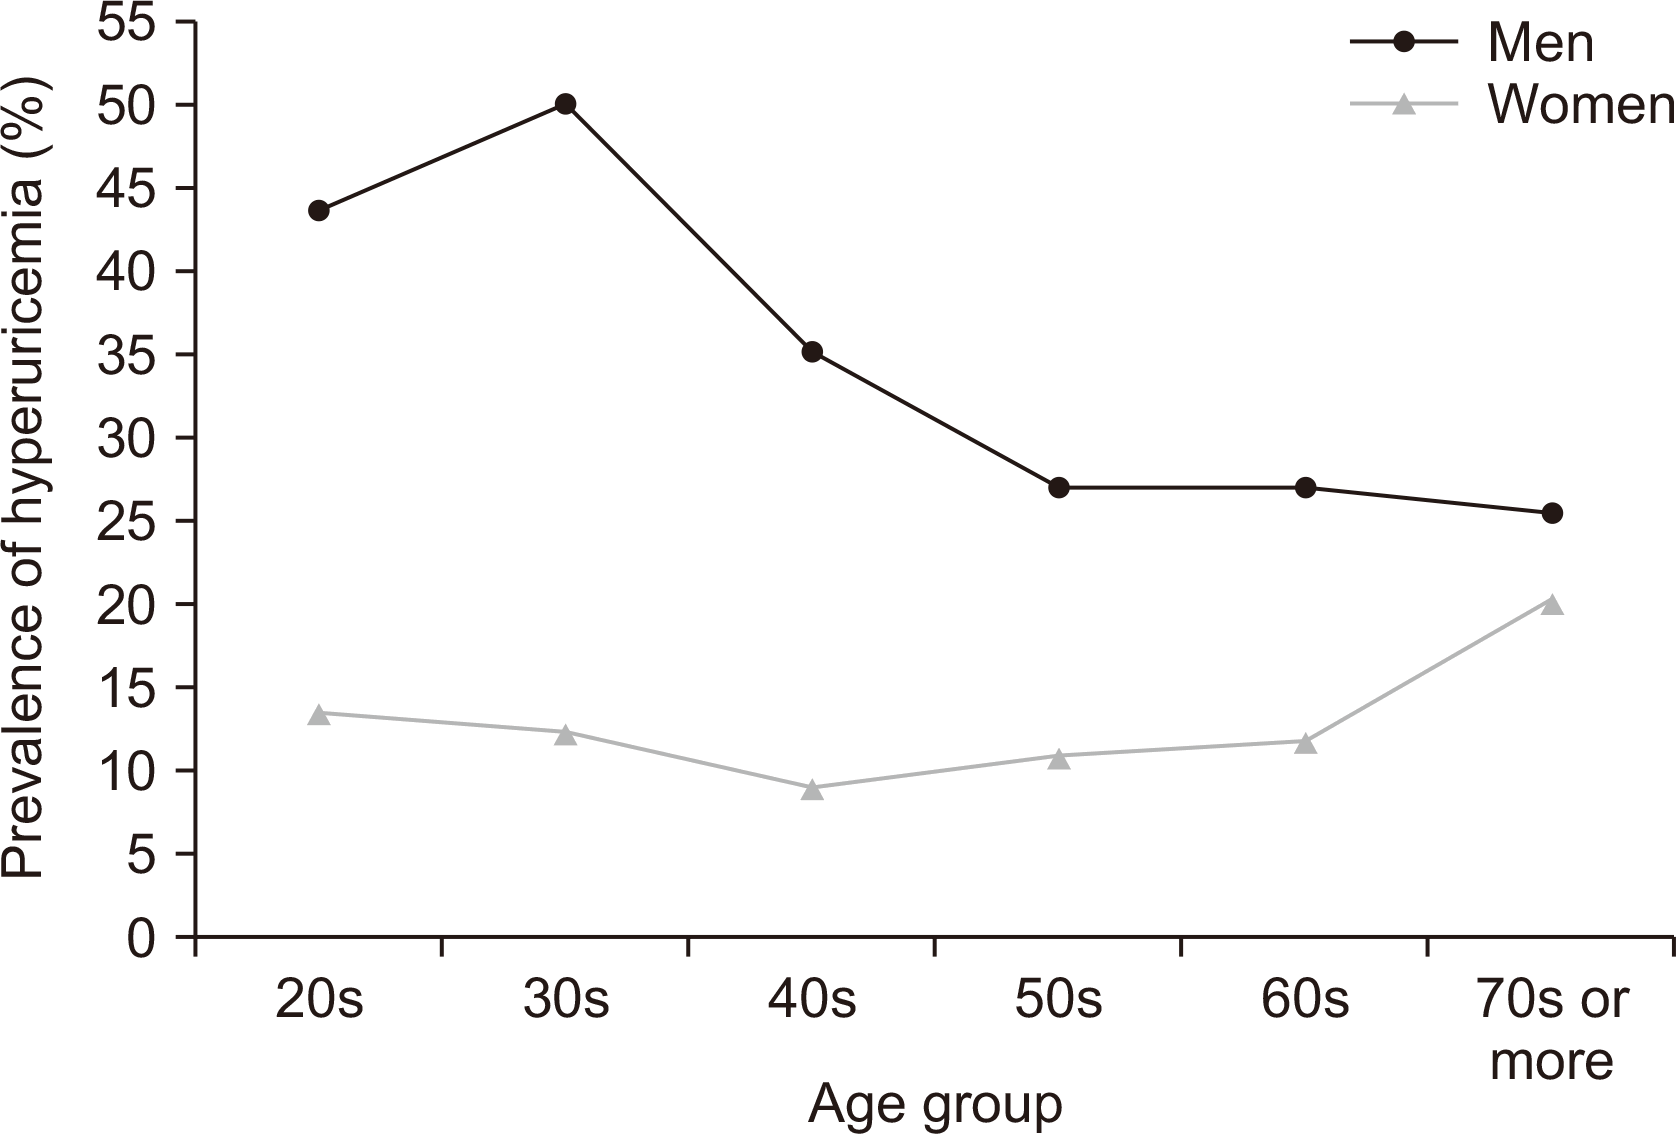
Of the 14,305 participants included in this study, 6,131 were men and 8,174 were women. The weighted prevalence of hyperuricemia was significantly higher in men than in women, with 35.6% of men and 12.6% of women classified as having hyperuricemia. Age-specific prevalence also differed by sex: in men, hyperuricemia peaked in the 30s and gradually declined thereafter, whereas in women, prevalence reached its lowest point in the 40s, began to rise from the 50s, and increased to 20.1% in those aged ≥70 years (Figure 2).
Baseline characteristics of the participants
Table 1 summarizes the baseline characteristics of participants according to hyperuricemia status. Participants with hyperuricemia had higher BMI, fasting blood glucose, blood pressure, total cholesterol, and triglyceride levels compared to those with normouricemia. The men in the hyperuricemia group were younger and more likely to be current drinkers; fasting blood glucose levels were lower in the hyperuricemia group. The women in the hyperuricemia group were older and had a higher proportion of current smokers than those in the normouricemia group. No significant difference in smoking status was observed among the men.
Dietary intake according to hyperuricemia status
Table 2 shows the average daily intake of major food groups according to hyperuricemia status by sex. Hyperuricemia was associated with a higher mean alcohol intake. Among men, additional differences included greater intake of meats, seasonings, beverages, and total food, along with lower consumption of cereals and starches. In women, the only other notable finding was lower total energy intake in the hyperuricemia group.
Associations between diet quality and hyperuricemia
Table 3 shows the comparison of HEI scores according to hyperuricemia status by sex. In men, the hyperuricemia group had lower intake of breakfast, mixed grains, fruits, and vegetables, resulting in a significantly reduced adequacy score (27.3 vs. 29.6, p<0.01), as well as lower moderation (19.4 vs. 20.0, p<0.01) and balance scores (9.1 vs. 9.6, p<0.01), leading to a lower total HEI score compared with the normouricemia group (55.9 vs. 59.2, p<0.01). In women, those with hyperuricemia had a lower intake of fruits and milk products, with a reduced adequacy score (29.1 vs. 30.4, p<0.01), but showed higher percentages of energy from saturated fat and sugar, yielding a higher moderation score (21.3 vs. 20.6, p<0.01); the total HEI score did not differ significantly between groups (59.1 vs. 60.1, p=0.09).
Figure 3 illustrates the sex-specific associations between HEI and the risk of hyperuricemia estimated by RCS analysis. In men, the OR declined steadily with increasing HEI, indicating a monotonic inverse association. The 95% CI fell below 1.0 beyond approximately HEI score 55, supporting a protective effect of higher diet quality, but widened at very high HEI scores (≥75). In women, the curve followed a U-shaped pattern. ORs declined gradually up to an HEI of about 70, suggesting a potential benefit of higher diet quality in this range. However, at HEI values above 70, the curve rose again, and the CI widened at the upper end.
Table 4 presents the adjusted ORs for hyperuricemia across quartiles of the HEI score and its component domains. In men, higher adequacy and balance scores were consistently associated with a lower risk of hyperuricemia. Compared with those in the lowest quartile, the adjusted ORs in the highest quartile were 0.80 (95% CI, 0.65~0.98) for adequacy and 0.77 (95% CI, 0.63~0.95) for balance. For the total HEI score, the adjusted ORs were 0.92 (95% CI, 0.77~1.11) in Q2, 0.84 (95% CI, 0.70~1.01) in Q3, and 0.76 (95% CI, 0.61~0.94) in Q4, showing a significant linear trend (p for trend<0.01). In women, the crude analyses suggested inverse associations for adequacy and total HEI score; however, these associations attenuated after multivariable adjustment. For adequacy, the adjusted ORs were 0.86 (95% CI, 0.71~1.06) in Q2, 0.80 (95% CI, 0.63~1.01) in Q3, and 0.91 (95% CI, 0.70~1.19) in Q4, with no significant trend (p for trend=0.39). For the total HEI score, the adjusted ORs were 0.83 (95% CI, 0.65~1.05), 0.81 (95% CI, 0.64~1.01), and 0.94 (95% CI, 0.73~1.20) across Q2 to Q4, respectively (p for trend=0.55). Neither moderation nor balance scores were significantly related to hyperuricemia in women after adjustment.
Table 5 summarizes the results of the sensitivity analyses. After additional adjustment for household income, education level, and physical activity, the overall associations remained largely unchanged in men and women. When stratified by the CKD status, a similar inverse association was observed in men without CKD. In contrast, among men with CKD, the adjusted OR increased in Q2 (adjusted OR, 1.37; 95% CI, 0.74~2.54) and subsequently decreased in Q3 (adjusted OR, 0.83; 95% CI, 0.43~1.60) and Q4 (adjusted OR, 0.82; 95% CI, 0.43~1.54; p for trend=0.15). Among women, the associations did not meaningfully differ according to the CKD status. Additional analyses stratified according to the menopausal status showed no evident significant association between HEI and hyperuricemia among premenopausal women and a higher adjusted OR in Q4 (adjusted OR, 1.19; 95% CI, 0.79~1.78; p for trend=0.91).
DISCUSSION
In this large, nationally representative sample of Korean adults, we observed clear sex-specific differences in the association between overall diet quality and hyperuricemia. In men, higher HEI scores were consistently linked to a lower risk, with both RCS and quartile-based analyses demonstrating a significant dose–response relationship. Contrarily, in women, the apparent inverse associations in unadjusted models were attenuated after adjustment, and no significant linear trend was detected. These findings suggest that dietary quality exerts a substantial protective effect against hyperuricemia in men, but not in women.
The different patterns of hyperuricemia between men and women, together with the observed sex-specific associations with diet quality, can be partly explained by hormonal regulation of uric acid metabolism. Estrogen promotes renal urate excretion and protects women against hyperuricemia, whereas its decline after menopause leads to rising uric acid levels [10-12,27]. However, in the present sensitivity analyses, HEI was not significantly associated with hyperuricemia, even among premenopausal women, indicating that the menopausal status alone does not fully account for the lack of a protective association observed in women. These findings suggest that factors other than diet quality may play a more important role in determining the risk of hyperuricemia among women. In contrast, among men—who lack this hormonal protection—dietary factors appear to have a more direct influence on uric acid levels.
Our study also demonstrates that men and women show distinct associations with diet quality. In men, the HEI scores, by integrating both favorable and unfavorable dietary components, effectively captures the multidimensional influences of diet on uric acid metabolism and explains the monotonic decline in risk across increasing HEI scores. By contrast, women exhibited a U-shaped curve, suggesting that both very low and very high HEI scores may be associated with elevated risk. This could be explained by the fact that women with higher HEI scores may consume larger amounts of certain purine-rich foods considered healthy—such as legumes, seafoods, or mushrooms—which could offset the urate-lowering benefits of other dietary components [13,14]. Additionally, reverse causation, whereby women who were at a higher risk of hyperuricemia could have adopted healthier diets in an effort to improve their health, leading to higher HEI scores despite elevated uric acid levels. Also, the pattern reflects residual confounding by unmeasured factors, such as the use of drugs affecting serum uric acid (such as allopurinol, febuxostat, or uricosuric agents), hormone therapy, supplement intake, or lifestyle characteristics not fully captured in the survey. Further research is warranted to clarify the mechanisms underlying this non-linear association in women.
The clinical implications of this study are noteworthy. Since men showed a clear inverse association between diet quality and hyperuricemia, dietary modification may represent a particularly effective intervention in this group. A 30-day randomized controlled feeding trial demonstrated that the Dietary Approaches to Stop Hypertension (DASH) diet reduced serum uric acid by −0.35 mg/dL overall compared with a control diet, with a larger decrease in men (−0.67 mg/dL) than in women (−0.09 mg/dL), although this sex difference was of borderline statistical significance (p=0.06). The uric acid–lowering effect was particularly pronounced among participants with baseline hyperuricemia, in whom reductions averaged −1.29 mg/dL [28]. The higher baseline prevalence of hyperuricemia in men further underscores the potential population-level benefits of dietary improvement. In women, preventive strategies should take into account hormonal status, age, and metabolic comorbidities such as obesity, hypertension, diabetes, and dyslipidemia that commonly emerge after menopause, as these conditions also promote uric acid retention and may attenuate the benefits of dietary quality [6]. Since postmenopausal hormone therapy has been reported to lower serum uric acid levels—for example, a clinical trial showed that hormone replacement therapy reduced serum uric acid levels by 0.64 mg/dL in hyperuricemic postmenopausal women [12], and analyses of NHANES III confirmed lower uric acid levels among hormone therapy users [29]—it may serve as a complementary option for hyperuricemia management in selected women. Taken together, sex-specific approaches that combine dietary counseling with consideration of hormonal influences and metabolic health conditions may enhance the effectiveness of hyperuricemia prevention in clinical practice.
In the reviewed literature (Supplementary Table 1) [18-21,28,30-32], three population-based studies specifically presented inconsistent sex-stratified results [19,21,31]. One study reported similar trends in both men and women [19], one identified a significant association only in women [21], and one found a significant association only in men [31]. The results of the study that found a significant association only in men were most comparable to our results [31]. Additionally, that study analyzed data from the U.S. NHANES 2011~2018 and reported a significant association in women in the subgroup with a BMI <30 along with the association observed in men [31]. In contrast, we did not observe significant associations in women, even when stratified by BMI (data not shown). A key strength of our study was its use of nationally representative data and specific focus on evaluating diet quality in relation to hyperuricemia across sexes.
This study has some limitations. First, its cross-sectional design precludes causal inference, as dietary quality and uric acid levels were assessed simultaneously. Second, dietary intake was measured using a single 24-hour recall, which may not fully capture habitual diet and is subject to recall bias. Third, although we adjusted for multiple confounders, residual confounding by unmeasured variables such as physical activity, medication use, menopausal status, and genetic predisposition cannot be excluded. Finally, the findings are specific to the Korean population and may not be generalizable to populations with different dietary patterns or genetic backgrounds.
CONCLUSION
Higher diet quality was associated with a significantly lower risk of hyperuricemia in men, whereas no consistent protective effect was observed in women. These findings underscores the need for strategies for hyperuricemia prevention to consider sex-specific dietary approaches, with greater focus on dietary modification in men and a broader integration of hormonal and metabolic factors in women.
SUPPLEMENTARY DATA
Supplementary data can be found with this article online at https://doi.org/10.4078/jrd.2025.0160
 XML Download