



 PDF
 Citation
 Print


INTRODUCTION
Anti-double-stranded DNA (anti-dsDNA) antibodies play a key role in the diagnosis and clinical monitoring of systemic lupus erythematosus (SLE). Their detection is included in the classification criteria established by the American College of Rheumatology and the Systemic Lupus International Collaborating Clinics [1]. Since the identification of LE cells by Hargraves in 1948, anti-dsDNA antibodies have been extensively studied using various diagnostic techniques [2].
Among them, the Farr radioimmunoassay (RIA), first described in 1969, gained prominence as a gold standard due to its high clinical specificity [3]. However, the use of radioactive materials, along with challenges related to safety, disposal, and regulatory restrictions, has prompted the development of alternative non-radioactive technologies.
With advances in immunoassay platforms, chemiluminescent immunoassays (CLIA) have emerged as attractive alternatives, offering several benefits: good combination of sensitivity and specificity, wider dynamic range, automation compatibility, and faster turnaround times [4]. These advantages support CLIA’s growing adoption in routine laboratories. However, differences in assay configuration, antigen preparation, and antibody affinity detection may affect diagnostic performance.
To improve comparability between laboratories, the World Health Organization (WHO) introduced the international reference standard Wo/80 in 1985. This lyophilized serum, derived from a patient with SLE and assigned an arbitrary value of 200 IU of anti-dsDNA antibodies, was intended to allow calibration of different assays and the reporting of results in international units (IU/mL). However, despite this harmonization effort, substantial variability persists among assays from different manufacturers, complicating method standardization [5]. Given that anti-dsDNA detection serves as a diagnostic and monitoring tool in SLE, comparing new methods to traditional standards like RIA remains essential for ensuring clinical accuracy.
In recent years, the discontinuation of the Farr-RIA in many clinical laboratories—driven by logistical, regulatory, and safety constraints—has created the need to identify alternative methods for anti-dsDNA detection. This shift affects numerous centers, including our own, where transitioning to non-radioactive assays has become necessary to ensure continued diagnostic service. In this context, evaluating the clinical and analytical performance of CLIAs as potential replacements is crucial. The present study aims to assess the agreement and diagnostic accuracy of a CLIA-based anti-dsDNA assay in comparison to the traditional RIA method, and to determine the extent to which CLIA may reliably substitute RIA in routine laboratory practice.
MATERIALS AND METHODS
This study included 807 serum samples submitted to the Autoimmunity Laboratory between January and December 2019 for routine anti-dsDNA antibody testing. Samples were obtained from individuals for whom anti-dsDNA testing was requested in the context of suspected systemic autoimmune disease, based on the clinical judgment applied in routine care. Inclusion criteria consisted of (1) request for anti-dsDNA testing and (2) availability of sufficient serum volume to perform both CLIA and RIA on the same sample. Standard laboratory exclusion criteria were applied, including evidence of gross hemolysis or lipemia, as well as samples with incomplete identification or inadequate volume. This study was approved by the Institutional Review Board (IRB) the Complejo Hospitalario Universitario de Canarias (CHUNSC) (IRB no. CHUNSC_2025_89). It was conducted in accordance with the principles of the Declaration of Helsinki and the European Medicines Agency Guidelines for Good Clinical Practice. Patient consent was waived per local IRB guidelines due to retrospective anonymized data use.
To ensure adequate statistical power for detecting the observed difference in positivity between methods, we based our calculation on data from a cross-sectional comparative study of anti-dsDNA detection assays (n=583) where a Farr-RIA assay detected 4.3% positives (25/583), whereas a CLIA-equivalent method (CLIFT 2) detected 12.0% positives (70/583) [6]. Assuming these proportions (p1=0.120, p2=0.043), with a two-sided test at α=0.05 and power=80%, the required minimum total sample size was estimated at 376. Given that our study included 807 sera analyzed in parallel with both CLIA and RIA, the sample size was considered sufficient to detect method-related differences reliably. In addition, the sample size was more than adequate to detect even moderate correlations between the quantitative outputs of both assays, for which a minimum of 83 samples would have sufficed.
For the CLIA method, the ZENIT RA dsDNA IgG assay was used—a CLIA designed for the ZENIT RA Analyzer (Menarini Diagnostics, Florence, Italy)—for the quantitative detection of IgG anti-dsDNA antibodies in human serum or ethylenediaminetetraacetic acid plasma. According to the manufacturer’s instructions, values between 0~29 IU/mL were considered negative, and values >29 IU/mL were considered positive.
For the RIA method, a Farr assay (IBL, Hamburg, Germany) was used. This RIA provides quantitative measurement of anti-dsDNA antibodies, with a cut-off value of 7 IU/mL, above which results are considered positive.
Censored results (RIA <2.5 IU/mL, RIA >100 IU/mL, CLIA >600 IU/mL) were assigned these limit values for analysis.
Quantitative agreement between CLIA and RIA was evaluated using Spearman’s rank correlation, Passing–Bablok regression, and Bland–Altman analysis. To account for the impact of censored values—particularly for RIA results clustering at the lower detection limit—a Tobit regression model was also applied. Categorical concordance was assessed via a 2×2 contingency table and Cohen’s kappa coefficient, with RIA considered the reference method. To account for the potential influence of prevalence and class imbalance, we additionally calculated the prevalence- and bias-adjusted kappa (PABAK). Diagnostic performance metrics—including sensitivity, specificity, positive predictive value (PPV), and negative predictive value (NPV)—were calculated accordingly. Receiver operating characteristic (ROC) curve analysis was conducted to assess the discriminative ability of CLIA and to identify the optimal threshold based on the Youden index.
All statistical analyses were conducted using R software.
RESULTS
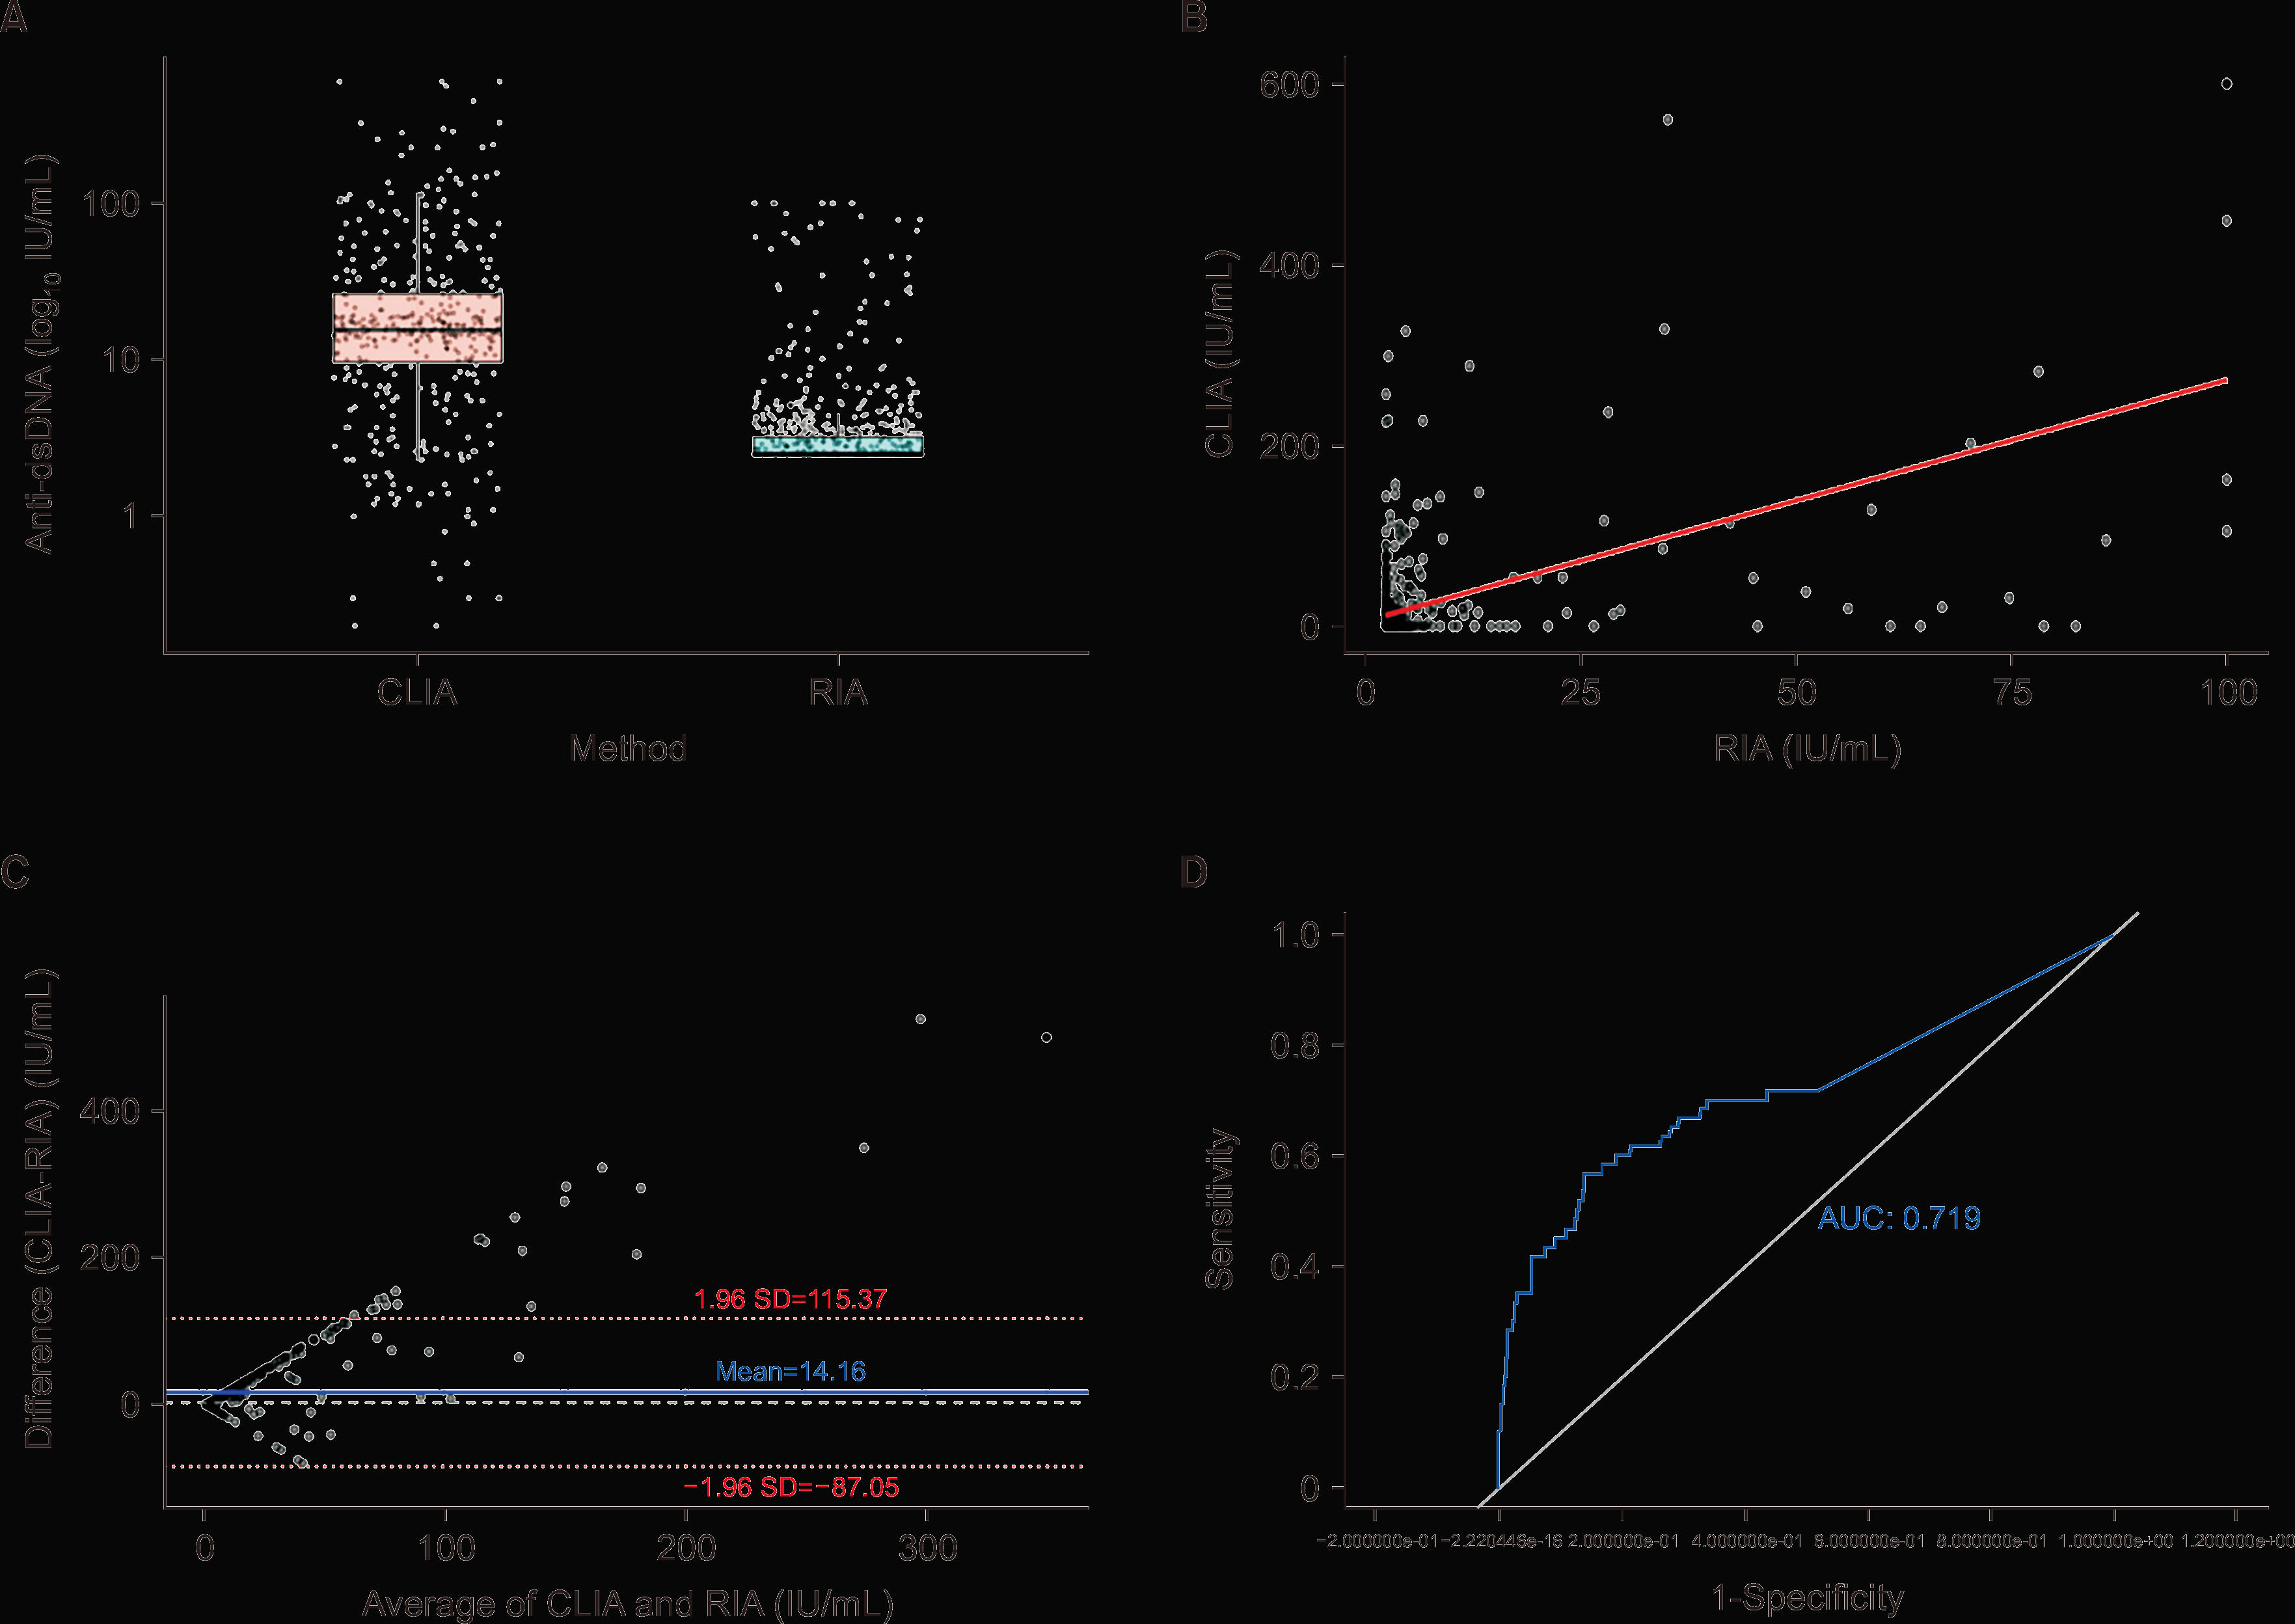
Of the 807 individuals tested, 621 (77%) were females and 186 (23%) were males. The median age was 53 years (interquartile range: 41~64). RIA values ranged from 2.5 to 100 IU/mL (median: 2.5), showing left-censoring due to the accumulation of results at the assay’s lower detection limit (2.5 IU/mL). CLIA values ranged from 0 to 600 IU/mL (median: 1.5), with broader dispersion. Descriptive statistics for both methods are summarized in Table 1. The visual distribution of both methods, after log transformation, is shown in Figure 1A, which illustrates the asymmetric dispersion and highlights the clustering of RIA values at the lower end of the range.
Spearman’s correlation between CLIA and RIA values was statistically significant (p=0.002) but weak (p=0.108), indicating a poor monotonic association between the two methods. However, from a clinical and analytical perspective, the correlation is insufficient to assume equivalence between both assays.
Passing–Bablok regression could not be performed due to distributional constraints, specifically the clustering of RIA values at the lower detection limit (2.5 IU/mL) and the pronounced skewness of CLIA values (Figure 1B). This lack of convergence indicates that the methods do not share a consistent linear relationship.
Bland–Altman analysis revealed a mean difference of 14.16 IU/mL, indicating a systematic bias whereby CLIA tends to report higher values than RIA. The 95% limits of agreement ranged from –87.05 to 115.37 IU/mL, reflecting substantial variability between the two assays (Figure 1C). This wide interval suggests that, for individual samples, the difference between CLIA and RIA could fluctuate by over 100 IU/mL in either direction, regardless of the average antibody level. Furthermore, the plot demonstrated increased scatter at higher average values, pointing to heteroscedasticity. Taken together, these findings indicate poor agreement and reinforce that CLIA and RIA are not interchangeable for quantitative interpretation.
A Tobit regression model was applied to account for censored values in the quantitative comparison. The model treated RIA values <2.5 IU/mL and >100 IU/mL, and CLIA values >600 IU/mL, as censored observations. The analysis yielded a statistically significant association between RIA and CLIA values (β=2.687, standard error=0.137, p<0.001), with an intercept of 5.076 (standard error=1.830). The model included 807 observations: 521 were left-censored for RIA, 6 were right-censored for RIA, and 3 were right-censored for CLIA.
Using the defined thresholds, 704 samples were negative by both methods, 27 positive by both, 43 positive by CLIA only, and 33 by RIA only (Table 2). Cohen’s kappa coefficient was 0.365, indicating fair agreement. CLIA demonstrated: sensitivity 45%, specificity 94%, PPV 39%, and NPV 96% (Table 3). Given that Cohen’s kappa is highly sensitive to prevalence imbalance, we also calculated the PABAK. The observed agreement was 90.6% (Po=0.906), corresponding to a PABAK value of 0.812, indicating substantial agreement once prevalence effects are accounted for.
The CLIA method yielded an area under the curve of 0.719, reflecting moderate diagnostic performance (Figure 1D). The Youden index suggested an optimal CLIA cut-off of 19.15 IU/mL. To further explore the diagnostic performance of CLIA, we recalculated all key metrics using the optimal cut-off. With this threshold, CLIA yielded a sensitivity of 57% and a specificity of 86%, compared to 45% and 94%, respectively, using the manufacturer’s threshold of 29 IU/mL. The contingency matrix showed 643 true negatives, 104 false positives, 26 false negatives, and 34 true positives. Cohen’s kappa coefficient decreased slightly to 0.268, reflecting fair agreement. The PPV decreased to 25%, while the NPV remained high at 96%. These results suggest that although the ROC-derived threshold improves sensitivity, it comes at the cost of lower specificity and reduced positive predictive power.
DISCUSSION
This study examined the diagnostic interchangeability of CLIA and RIA for anti-dsDNA antibody detection in a large cohort of clinical samples. While CLIA provides several practical benefits—including full automation, faster turnaround times, and the elimination of radiological hazards—our findings indicate that it cannot be considered fully interchangeable with RIA, particularly from a quantitative perspective.
The low correlation and substantial variability observed between numerical values reflect fundamental differences in assay design, including antigen source, detection mechanisms, and affinity for different antibody populations. CLIA consistently produced higher values than RIA, potentially due to its broader antibody detection spectrum or its ability to detect lower-affinity or clinically irrelevant antibodies. This discrepancy is critical in settings where test values are used not only for diagnosis but also for disease monitoring or therapeutic decisions.
To verify the robustness of the quantitative comparison in the presence of censored values, we applied a Tobit regression model that accounted for the lower and upper detection limits of both assays. The model confirmed a statistically significant association between RIA and CLIA values (β=2.690, p<0.001), indicating a positive but modest relationship. Notably, 521 RIA results (64.6%) were left-censored at <2.5 IU/mL, reflecting the high proportion of negative samples in the dataset and the reduced analytical resolution of the RIA method near its lower detection boundary. Despite this, the Tobit model yielded conclusions consistent with the main correlation analysis, reinforcing the observed poor quantitative agreement between methods and supporting the validity of our findings.
When evaluating qualitative (positive/negative) agreement, the results were more encouraging but still imperfect. Using RIA as the reference method, CLIA demonstrated high specificity (94%) and a strong NPV (96%), but limited sensitivity (45%) and a poor PPV (39%). These figures suggest that CLIA may be reliable in confirming the presence of anti-dsDNA antibodies when negative but is less effective at ruling them out when positive. Thus, although CLIA may be suitable as a complementary tool, it lacks the robustness to fully replace RIA in cases requiring high diagnostic certainty.
The discordance rate between methods—approximately 9% of all cases—support this interpretation. These discrepant results included 43 samples that tested positive only by CLIA and 33 only by RIA. The 33 RIA-only positives may highlight false negatives of CLIA, underlining its limited sensitivity. This underlines the risk of underdiagnosis when CLIA is used as a standalone method. This is especially relevant in borderline or early disease presentations where serology may heavily influence clinical decisions. Conversely, the subset of CLIA-only positives is less likely to represent clinically relevant antibodies and more likely to reflect low-affinity or nonspecific binding. Similar findings have been reported in previous comparative studies. For example, Zigon et al. [6] evaluated several commercial assays against an in-house Farr-RIA and observed that non-radioactive methods sometimes missed clinically important antibodies detected by RIA, leading to underestimation of true positivity. Our results are consistent with these observations and reinforce that differences in antibody detection profiles across assays can significantly affect diagnostic interpretation. Future studies should incorporate Crithidia luciliae testing for discordant samples, as this would help determine whether CLIA-only positives represent true low-affinity antibodies or methodological noise.
Our ROC analysis revealed that the optimal diagnostic cut-off for CLIA was 19.15 IU/mL—lower than the manufacturer’s recommended threshold of 29 IU/mL. However, adjusting the threshold does not overcome the intrinsic limitations of the test in this population. Although sensitivity improved modestly (from 45% to 57%), specificity declined (from 94% to 86%), and the PPV dropped further to 25%. These findings suggest that redefinition of the negativity threshold may slightly rebalance sensitivity and specificity. However, in routine clinical settings, simply adjusting the negativity threshold is unlikely to lead to meaningful improvements in diagnostic performance. Moreover, the ROC-derived cut-off should be regarded as exploratory, as its performance is inherently dependent on disease prevalence, cohort composition, and the choice of reference method. Therefore, it cannot be generalized beyond our study and should not be interpreted as a clinically validated diagnostic threshold, underscoring that these limitations are intrinsic to the method rather than solvable by simple cut-off adjustment.
The raw Cohen’s kappa coefficient indicated only fair agreement (κ=0.365), but this value is strongly affected by the marked prevalence imbalance in our cohort (7.4% positives). To account for this limitation, we also calculated the PABAK, which was 0.812 and suggested substantial agreement once prevalence effects were considered. Nevertheless, this apparent improvement mainly reflects the predominance of negative samples, since almost half of the RIA-positive cases were missed by CLIA. Consequently, despite the higher PABAK value, CLIA and RIA cannot be regarded as interchangeable in clinical practice, and concordance indices should always be interpreted together with diagnostic performance metrics.
Importantly, these observations are consistent with previous literature demonstrating substantial inter-assay variability in anti-dsDNA detection, even when assays are calibrated against international reference materials such as the WHO Wo/80 standard. Multiple studies have shown that anti-dsDNA assays differ significantly in sensitivity, specificity, and clinical correlation, largely due to methodological heterogeneity—including differences in antigen presentation (e.g., plasmid vs. native DNA), assay format (e.g., ELISA, CLIA, Farr-RIA), and detection of high- vs. low-avidity antibodies [7,8]. This variability persists despite standardization initiatives and remains a major challenge in the field of autoimmune diagnostics [9]. Furthermore, the biological complexity of anti-dsDNA antibodies themselves—including their polyclonality, affinity heterogeneity, and fluctuating levels in relation to disease activity—adds an additional layer of difficulty to method harmonization and cross-platform comparability [10]. Therefore, even methods that nominally report results in IU/mL cannot be assumed to produce equivalent diagnostic information.
Finally, the limitations of this study must be acknowledged. One limitation is the single-center design and the exclusive use of the ZENIT RA platform. Therefore, our findings may not be fully generalizable to other laboratory settings or to alternative CLIA platforms.
Another limitation of our study is the marked imbalance between RIA-positive and RIA-negative samples (7.4% vs. 92.6%), which reflects the low prevalence of anti-dsDNA positivity in the routine testing population. This imbalance may influence certain diagnostic performance metrics; in particular, the high NPV of CLIA may be partially inflated due to the low prevalence of positives, while the PPV is inherently limited under such conditions. Although the large sample size supports statistical robustness, interpretation of predictive values should consider the influence of disease prevalence and class imbalance, as is standard in diagnostic test evaluation.
A further limitation of the study is the lack of detailed clinical data. Although basic demographic information (age and sex) was available, no specific diagnosis, disease activity scores, or treatment history could be retrieved. This reflects a common limitation in retrospective laboratory-based studies. However, this limitation also strengthens the external validity of our findings, as the data originate from an unselected population referred for routine testing—a scenario that mirrors daily clinical practice. Consequently, our results are directly applicable to the typical decision-making context in diagnostic laboratories, where test performance must be interpreted in patients with a broad spectrum of clinical suspicion and limited pre-test information. Rather than allowing definitive classification of discrepancies as false positives or false negatives, our design highlights the interpretive challenges faced in routine practice, thereby enhancing the practical relevance of our findings.
CONCLUSION
CLIA cannot be considered an interchangeable substitute for RIA without compromising diagnostic accuracy. Although its operational advantages are undeniable, the 9% discordance rate observed between CLIA and RIA further underlines the clinical risk of uncritical implementation.
Laboratories transitioning to CLIA must carry out rigorous validation studies, establish appropriate local cut-off values, and communicate clearly with clinical teams regarding the interpretation of results. Until broader harmonization is achieved, anti-dsDNA testing should not be approached merely as a numerical result, but rather as a complex biomarker whose diagnostic significance is intrinsically tied to the method used for its detection.
In this context, the use of the Crithidia luciliae method may represent a valuable complementary tool in discordant or clinically uncertain cases. This indirect immunofluorescence assay uses a flagellated parasite as a substrate, whose kinetoplast contains exclusively double-stranded DNA, providing very high specificity for detecting high-affinity anti-dsDNA antibodies. A positive fluorescence signal localized in the kinetoplast confirms the presence of autoantibodies truly directed against dsDNA, rather than against other nuclear components [11]. Therefore, Crithidia luciliae is especially useful for confirming positive results obtained by CLIA or other more specific but less sensitive methods and can add diagnostic value in SLE, particularly when greater diagnostic certainty is required, such as in early presentations or atypical cases. However, it should be noted that its sensitivity is limited, and it may not detect low-affinity antibodies or those present at low concentrations.
 XML Download