



 PDF
 Citation
 Print


Introduction
Knowledge of anatomy is key to successful regional anaesthesia. A successful erector spinae plane block (ESPB) requires the administration of local anaesthetic at the tip of the transverse process in the fascial plane deep to the erector spinae muscle [1]. ESPB is a relatively new technique that has received considerable attention in regional anaesthesia research. However, the majority of studies have focused on their application in the thoracic region (89.95%). In comparison, fewer studies have explored its efficacy in the lumbar region (9.3%), while the cervical region has received the least attention, accounting for only 0.8% of the studies [2]. This suggests the need for further exploration of the ESPB in the cervical region.
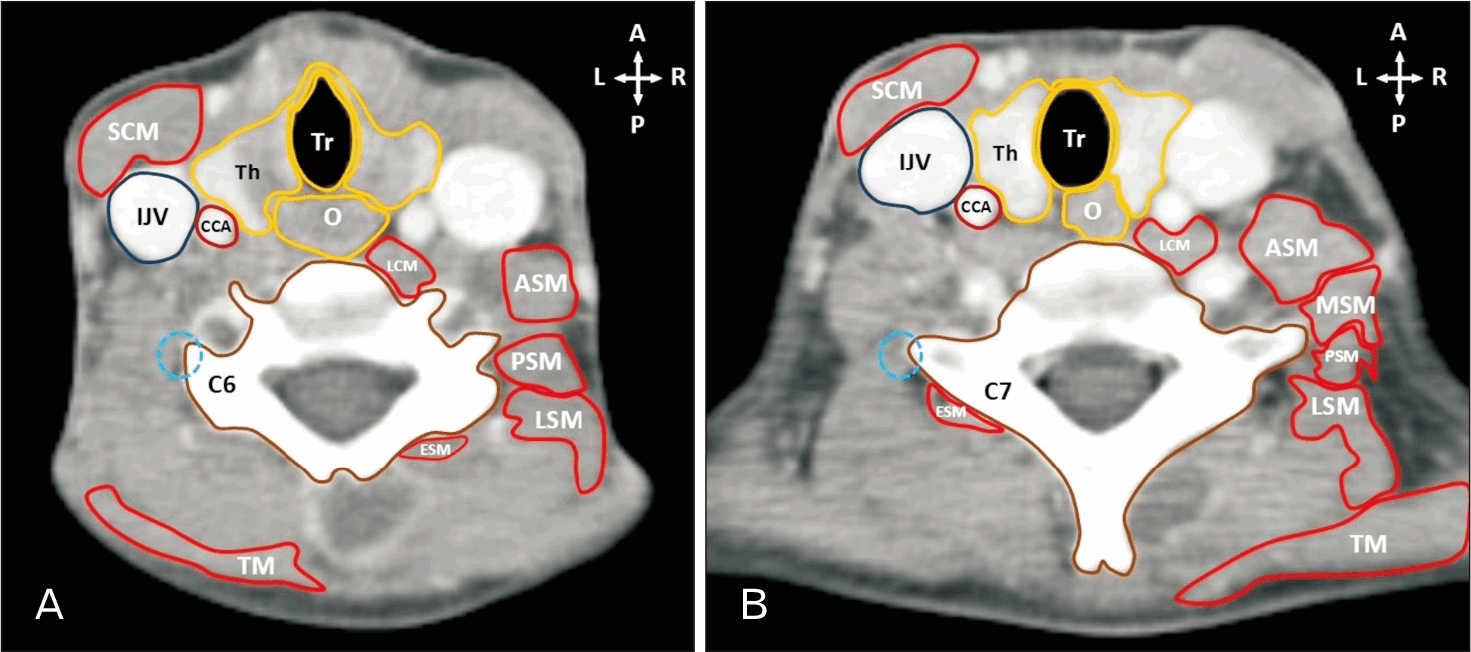
A cervical ESPB can be performed by placing local anaesthetic at the posterior tip of the anterior tubercle of the transverse process of the C6 vertebra (Fig. 1A) or at the tip of the posterior aspect of the transverse process of the C7 vertebra (Fig. 1B) [3]. A successful block affects the anterior branches of the C3 spinal nerve cranially down to the T4 spinal nerve caudally [4]. A posterior approach that targets the posterior tip of the transverse process of the C7 vertebra or the posterior tubercle of the transverse process at the C6 vertebral level results in fewer anterior branches being blocked compared to the number of posterior branches [4].
The ESPB is effective in anaesthetising both anterior and posterior rami of the spinal nerves. As a consequence, somatic and visceral pain can be blocked through the administration of a local anaesthetic agent in the erector spinae plane [5]. Typically, the ESPB is performed under anaesthesia in paediatric patients by utilising an ultrasound-guided technique. A low complication rate has been reported [6].
The ESPB has also been used for enhanced recovery following surgery as part of multimodal analgesia [7]. The ESPB is a viable option should paravertebral and epidural blocks be contraindicated, i.e., thrombocytopenia, anticoagulation therapy, antiplatelet therapy, coagulopathy, or parental refusal [8].
Furthermore, it is shown to be a successful option for patients who are at high risk from general anaesthesia [1]. Nerve blocks performed for neck surgeries pose a greater challenge and higher risk for injury due to the presence of vital structures in the area [9]. Insufficient pain management in paediatric patients has been associated with the triggering of physiological and biochemical stress responses that can cause impairments in cardiovascular, pulmonary, neuro-endocrinal, immunological, gastrointestinal, and metabolic functions. Due to the lack of cognitive and communicative abilities, neonates cannot self-report pain, and observational assessments are often required [10].
Apart from many case reports, only 23 out of the 242 studies reviewed by Tsui et al. (2019) [2] were performed on children. Most studies published in the past regarding the ESPB in paediatric patients have focused on case reports, primarily in the thoracic region [11]. These studies included utilising the ESPB as postoperative analgesia following oncological thoracic surgery [12], for inguinal hernia repair surgeries in preterm infants [13, 14], posterior thoracic wall [15] and general thoracic surgery [16], and a sternotomy [17]. There is, therefore, a need for further studies to determine the anatomy related to the cervical ESPB in children.
The primary aim of this study was to measure important anatomical structures relevant to the cervical ESPB utilising retrospective paediatric computed tomography (CT) scans. These measurements included the distance from the spinous process (SP) to the tip of the transverse process at the C6 and C7 vertebral levels, the depth from the skin to the most medial points of the erector spinae muscle, and the most posterior points of the sternocleidomastoid muscle at the C6 and C7 vertebral levels. The secondary aim was to determine if there were correlations between the measurements obtained for age and sex of the patients.
Materials and Methods
Ninety axial CT images were selected from the database of radiographic images at the Department of Radiology, Steve Biko Academic Hospital. All records obtained were kept confidential. The data in this article were obtained as part of a PhD (Anatomy) study. This retrospective study was approved by the PhD and Research Ethics Committee, University of Pretoria, South Africa (ethics reference number 257/2023), and the requirement for informed consent was waived by the Ethics Committee due to the retrospective nature of the study. The CT scans used in the current study were not selected using a purely random or stratified random sampling method. The dataset was first stratified into the following age groups as defined by the American Medical Association, and included neonates (age range, 0–2 months) (males, n=18; females, n=12), infants (age range, 2 months–2 years) (males, n=13; females, n=17), and children (age range, 2–12 years) (males, n=9; females, n=21) [18]. This ensured an appropriate representation of each developmental stage. Within each of the age groups, scans were identified by a radiologist, who sequentially accessed available scans. Scans that exhibited atypical vertebral column development diagnosed by a consulting radiologist, including scoliosis, kyphosis, and space-occupying lesions, were excluded. Due to the selection of the scans being dependent on the order in which the investigators determined the eligible scans, the method is best described as stratified convenience sampling rather than random sampling. This is a method that is commonly used in retrospective studies, where the eligibility of the scans can only be determined upon reviewing each scan manually.
All CT scans used in the study were department-acquired scans that were performed according to standard paediatric protocol. The patients were in a supine position with their arms abducted when performing the scans. Furthermore, to limit the variability caused by diaphragmatic motion, the scans were obtained at end-tidal inspiration.
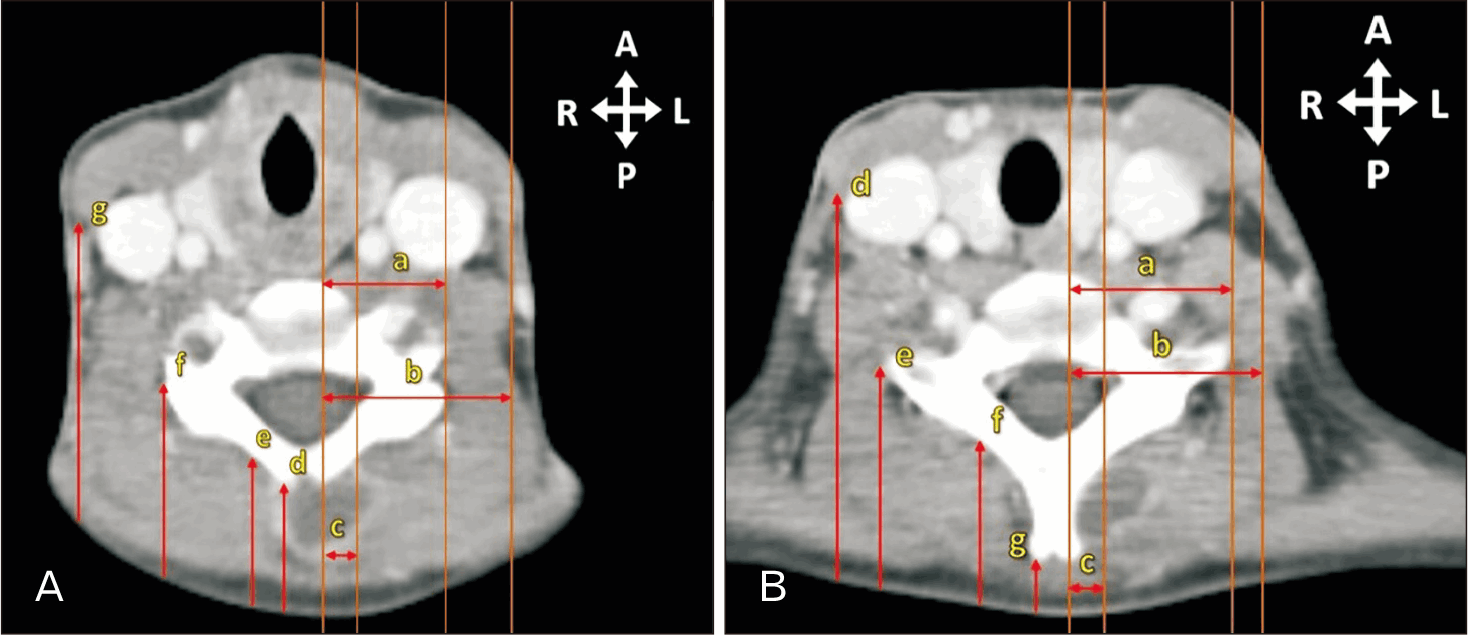
The C6 vertebral level was identified as the most caudal vertebra demonstrating both anterior and posterior tubercles on the transverse process, together with a bifid SP, by sequentially reviewing the CT slices in RadiAnt Digital Imaging and Communication in Medicine (DICOM) Viewer (Medixant). The C7 vertebral level was then located by moving inferiorly from C6 to the next vertebra displaying a single SP without bifurcation. To standardise measurements, gridlines were aligned over the tips of the left and right transverse processes, the SP, the sternocleidomastoid muscles, and the erector spinae muscle ensuring perpendicular orientation to the structures (Fig. 2). After placement of the gridlines, the horizontal distances between the gridlines were measured. Bilateral measurements were then obtained (Fig. 2). Accurate identification of these vertebral landmarks is clinically significant, as it enhances precision in needle placement for cervical ESPB and reduces the risk of inadvertent injury to adjacent vital structures.
Measurements include, as seen in Fig. 2:
• The distance from the SP—left SP (L-SP), right SP (R-SP), or single SP—to the tip of the left and right transverse process (Line a).
• The distance from the SP—L-SP, R-SP, or single SP—to the most posterior point of the sternocleidomastoid muscle (Line b).
• The distance from the SP—L-SP, R-SP, or single SP—to the most medial point of the erector spinae muscle (Line c).
• The depth from the skin to the posterior-most point of the sternocleidomastoid muscle (Line d).
• The depth from the skin to the lateralmost point of the transverse process (Line e).
• The depth from the skin to the most medial point of the erector spinae muscle (Line f).
• The depth from the skin to the most superficial point of the SP—L-SP, R-SP, or single SP (Line g).
For measurements involving the SP, the measurement was obtained from the posterior-most point of the left and right projections, should the process be clearly separated by a cleft, resulting in a bifid SP.
The CT images were analysed using RadiAnt version 2023.1—a viewer for DICOM files. The measuring functions were recalibrated for each image before performing the measurements.
All measurements were recorded in Microsoft Excel and analyzed using IBM SPSS 29.0 (IBM Co.). Reliability was assessed through intra- and inter-observer checks using the Wilcoxon signed-rank test, with 10% of measurements repeated by both the primary investigator and an independent researcher.
Normality was tested with the Shapiro–Wilk test. Depending on the data distribution, left and right measurements were compared using either a paired t-test (for normally distributed data) or a Wilcoxon signed-rank test (for non-normally distributed data). Non-significant side differences were pooled for mean calculations.
For age group comparisons, normality (Shapiro–Wilk) and homogeneity (Levene’s) were tested. If assumptions were not met, the Kruskal–Wallis or Welch ANOVA tests were used; otherwise, a one-way ANOVA was performed. Non-significant age group differences were pooled for mean and standard deviation calculations.
R2 values were calculated to assess linear correlations between measurements and demographic variables (sex, age). Power analysis (effect size=0.35, α=0.05, n=30) indicated high statistical power: 0.993 for the paired t-test and 0.991 for the Wilcoxon test (G*Power 3.1.9.7).
Results
Results from the Wilcoxon signed-rank test revealed a P>0.05 for both intra- (P=0.511) and inter-reliability (P-value=0.445) checks, indicating no statistically significant differences between the sets of data. The measurements obtained in the study were therefore consistent between the observers.
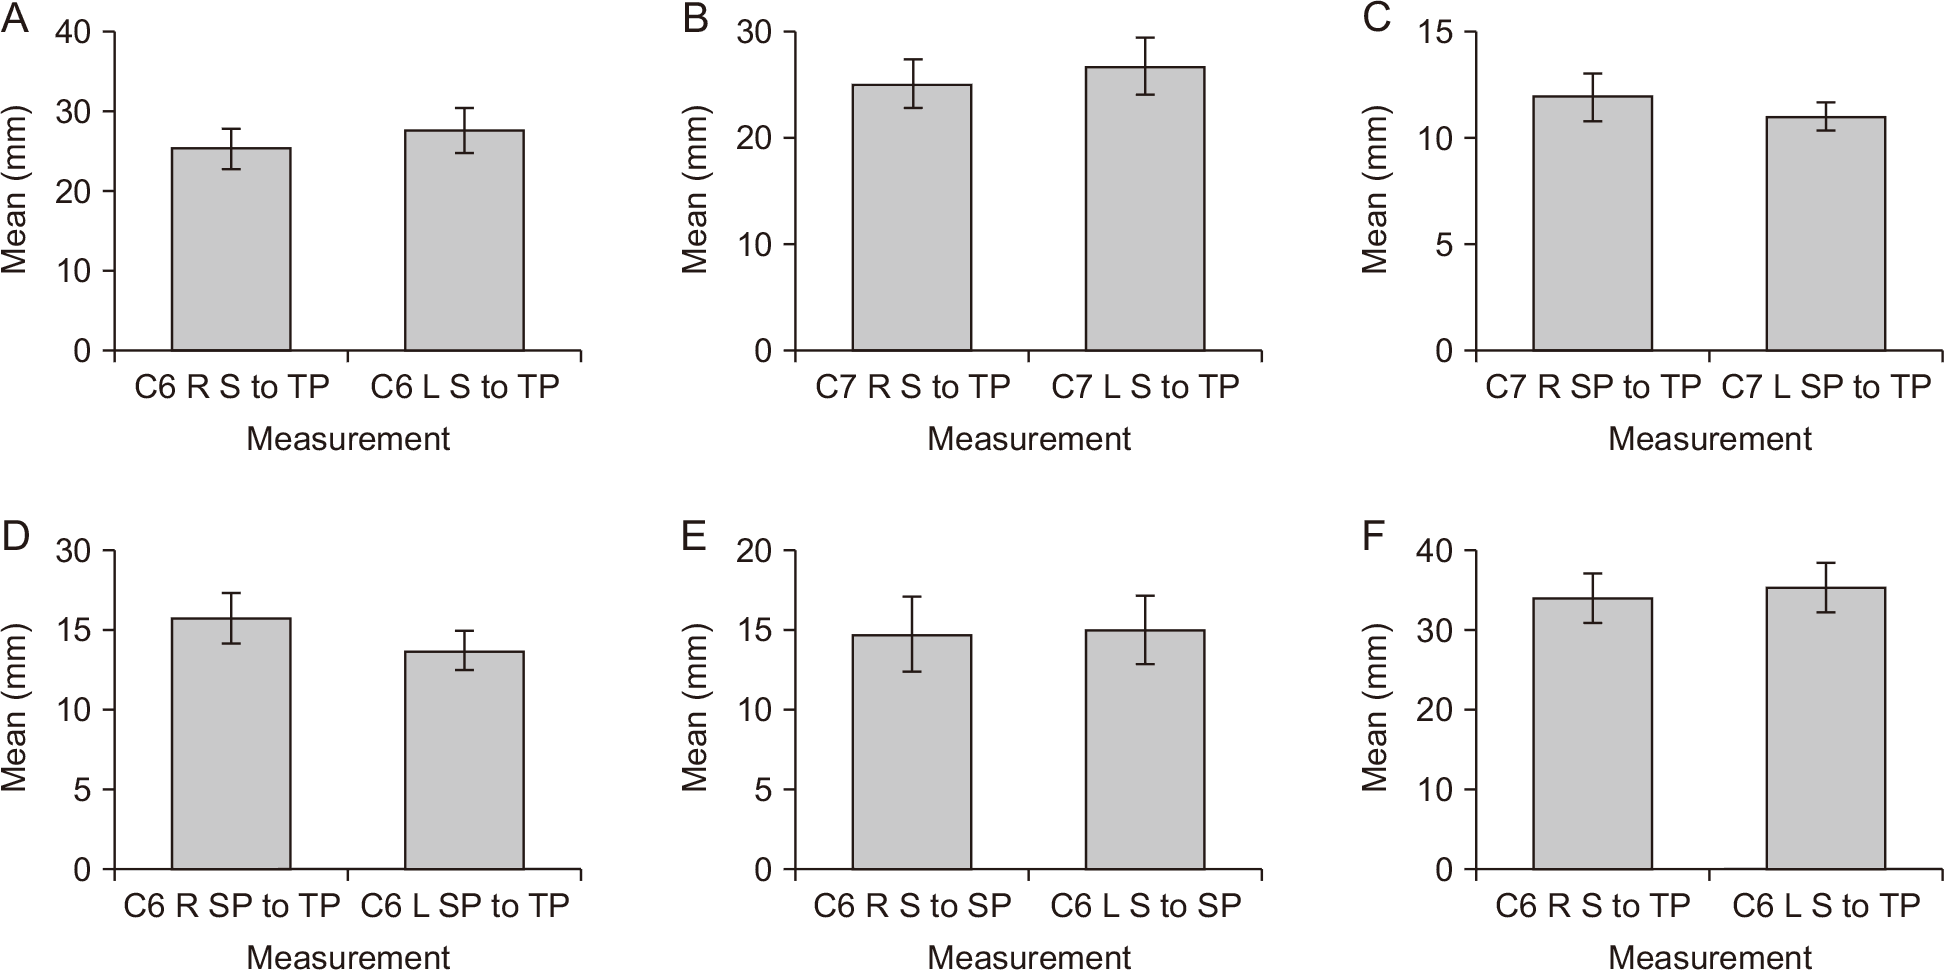
Paired t-tests or Wilcoxon signed-rank tests were used, based on data normality (Shapiro–Wilk test; P<0.05 indicating skewed data), to assess significant differences between left and right measurements in neonates (0–2 months), infants (2 months–2 years), and children (2–12 years) (Tables 1-3). The statistically significant measurements were plotted on a bar graph reflecting the standard deviation and mean (Fig. 3). As the error bars for both sets of measurements do not overlap when comparing left and right-sided measurements, the difference between the two sides is more likely to be statistically significant. The sample size from which the measurements could be obtained for the study varied due to the muscle layers being indistinguishable in certain instances.
Statistically significant differences were noted when comparing the left and right sides for the depth of the transverse process at C6 (Fig. 3A) and C7 vertebral levels (Fig. 3B), and the distance between the SP and transverse process at C7 vertebral level (Fig. 3C) in neonate patients (18 males and 12 females). Similarly, significant differences were observed between the left and right sides for the distance between the SP and transverse process at the C6 vertebral level (Fig. 3D) and the depth from the skin to the SP (Fig. 3E) at the C6 level in infant patients (14 males and 16 females). Furthermore, significant differences were noted when comparing the depth from the skin to the TP at the C6 level in child patients (21 females and 8 males) (Fig. 3F). All data were assessed, and outliers were excluded from the analysis. The investigators assessed the scans to ensure quality images were used; however, scans are often distorted by movement in this age group. As such, extreme outliers were identified through assessment of large differences in left and right-sided measurements in a particular individual, revealing potential image distortion. This ensured a more accurate assessment of the findings in this study. The statistically significant measurements were plotted on a bar graph reflecting both the standard deviation and the mean.
From the graphs, the depth of the transverse process at C6 (Fig. 3A) and C7 (Fig. 3B) vertebral levels in neonates, as well as at the C6 vertebral level in children (Fig. 3F), the measurement was greater on the left side in all instances. When comparing the bar graphs, the distance from the SP to the transverse process at the C7 vertebral level (infants) (Fig. 3C) and the C6 vertebral level (children) (Fig. 3D) was greater on the right than on the left. The opposite can be seen for the depth from the skin to the SP at the C6 vertebral level, where the left side was larger than the right in infant patients (Fig. 3E). The spread of the data around the means in both instances is minimal. Due to the lack of overlapping of the error bars in either comparison for Fig. 3B, the difference between the left and right sides for these measurements is more likely to be significant. The depth from the skin to the transverse process at the C6 vertebral level is demonstrated to be larger on the left than on the right, as per Fig. 3C. The spread of the data around the means is minimal, and due to the lack of overlapping of the error bars, the significant differences in the data sets are more probable.
A comparative analysis was done between the data from the different age categories using an independent t-test (for normally distributed data) and a Kruskal–Wallis test (for non-normally distributed data) to determine if there are significant differences between the categories. Significant differences (P<0.05) were observed for all measurements (P≤0.001) except for the measurement of the depth of the SP on the left (P=0.422) and right sides (P=0.200) at C6 vertebral level, depth of the sternocleidomastoid muscle at C6 vertebral level (P=0.835) and C7 vertebral level (P=0.248), and the distance between the SP and erector spinae muscle at C7 vertebral level (P=0.386).
Due to the differences observed in the majority of the measurements, the data were not pooled for further statistical analysis. Consequently, all subsequent analyses were conducted separately for each age group.
The measurements for age groups with no statistically significant differences observed were pooled, and the mean and standard deviation for each measurement were calculated (Table 4).
Results from the correlation analysis revealed a very weak correlation—adjusted R2≤0.3—between all measurements and sex, except for the distance between the SP and the erector spinae muscle (R2=0.79; strong correlation) and the depth of the erector spinae muscle from the skin (R2=0.57; moderate correlation) at vertebral level C6.
When testing for correlations between age categories and the measurements it was found that all measurements had weak correlations—adjusted R2≤0.3—except for the distance from the SP to the transverse process on the right side (R2=0.65; strong correlation) and on the left side (R2=0.62; strong correlation) at vertebral level C6, distance from the SP to the sternocleidomastoid process at C6 vertebral level (R2=0.50; moderate correlation), and the distance from the SP to the transverse process at C7 vertebral level (R2=0.62; strong correlation). In all instances, as expected, the older the individual, the larger the measurement became.
The adjusted R2 indicate how much of the attribution is caused by sex or age. Therefore, 79% of the variation between the distance from the SP to the erector spinae muscle and 57% of the variation between the depth of the erector spinae muscle from the skin at vertebral level C6 can be explained by sex. In addition to this, 65% of the variation in the distance from the SP to the transverse process on the right side and 62% of the variation on the left side at vertebral level C6, as well as 50% of the variation in the distance from the SP to the sternocleidomastoid process at C6 vertebral level and 62% of the variation in the distance from the SP to the transverse process at C7 vertebral level can be explained by the age category the individual fell into.
Discussion
Our results revealed a statistically significant difference between the right and left measurements for the depth of the TP from the skin at both C6 (P≤0.001) and C7 vertebral levels (P=0.033) in neonates. Furthermore, significant differences were observed when comparing the left and right-sided measurements for the distance between the SP and the TP (P=0.047) at the C7 vertebral level. The differences in all instances were, however, small. In infants, a small, however, significant difference was observed when comparing left and right-sided measurements for the distance between the SP and the TP (P=0.008) and the depth of the SP (P=0.011) at vertebral level C6. Lastly, in children, a significant difference was observed when comparing left and right-sided measurements for the depth of the TP at vertebral level C6 (P=0.044). In all the instances, the differences observed were small and clinically insignificant.
When comparing measurements for the different age categories, significant differences were observed for most measurements (P≤0.001). The data obtained for the different age categories should, therefore, be applied only to that age category and cannot be grouped for these measurements. All other measurements had means for grouped results documented in Table 4.
There has been an increase in the popularity of interfascial plane blocks in recent years. The interfascial planes have become more easily identifiable with the use of ultrasound-guided techniques, allowing anaesthesiologists to access the target areas [19]. The ESPB specifically has decreased the risk of spinal cord injury, central infections, and epidural hematomas. Effective analgesia can be accomplished by performing peripheral nerve blocks and avoiding the adverse events that are linked to systemic medications [20].
The investigator could not find any past studies reporting the means and standard deviations for the measurements done in this study in children. Zhang et al. (2018) [21], however, reported the distances between the SP and transverse process in an adult population from 3D reconstructed CT scans at the C7 vertebral level. In their study, the measurements they obtained were the vertical distance rather than the horizontal distance, as per the current study.
The measurements in this study were based on a perpendicular approach to the transverse process that would be utilised should ultrasound not be available. The estimated depths obtained from this study may also act as a useful guide to perform ultrasound-guided injections at vertebral levels C6 and C7. The results obtained in this study are useful, as there is a lack of research reporting the measurements to aid ESPB in pediatric patients. Future investigations should focus on larger sample sizes, additional demographics being available, and alternative imaging modalities. Patients are in the prone or lateral decubitus position when undergoing ESPBs [22]. Positioning of pediatric patients for CT scans is often challenging, and the radiology department may use pads and cushions to position the patient or otherwise sedate the patient [23]. The positioning of the patients for which the scans were obtained for this study differed from the standard positioning of patients undergoing ESPB. When performing the cervical ESPB, the patient would typically be in a prone position with their arms adducted, which is the opposite of the positioning of patients in the study. The patient’s position when obtaining the measurements may influence the results. The measurements were taken by the authors under the guidance of radiologists.
Magnetic resonance imaging is a more comprehensive imaging modality when looking at the intraspinal and paraspinal soft tissues in comparison to CT scans [22]. CT measurements do not account for tissue compressibility or probe pressure during ultrasound, which can alter skin-to-target depth in clinical settings. The investigators could not perform all measurements for all scans in the study due to the clarity of the scans. As such, the sample size for the different measurements obtained varied.
Due to limited resources being available in some instances, it is not always feasible to perform ultrasound-guided ESPB. The use of loss-of-resistance or landmark-based techniques can be used as an alternative method in such instances [24]. The ESPB can be performed across different age groups and is considered a novel technique.
In young children, the transverse process is not clearly defined due to its cartilaginous nature; however, it can still be used as an anatomical landmark. The measurements obtained from this study may assist to help accurately place the needle when using an ultrasound-guided approach. Similarly, if ultrasound is not available, they have the potential to reduce the risk of complications.
The morphometric data presented in this study may provide clinically relevant reference values for the ESPB at the C6 and C7 vertebral levels in neonates, infants, and children. These measurements have the potential to serve as a guide for safe needle advancement in landmark-based or ultrasound-assisted approaches, particularly in settings where imaging resources are limited, ultimately improving perioperative pain management in pediatric patients.
 XML Download