

Journal List > Int J Stem Cells > v.19(2) > 1516095787

Roh, Ha, Kim, Kim, Kim, Kim, Hwang, Yang, Jang, and Kim: Anti-Obesity Effects of Pear Extract (Pyrus pyrifolia): Clinical Implications and Therapeutic Potential

Abstract

Mitigating obesity is a pivotal strategy for addressing metabolic diseases, including cardiovascular diseases, liver diseases, and diabetes. Although pear extract exhibits various pharmacological effects in regenerative diseases, such as skin, nerve, and adipose tissue dysfunction, by eliminating excessive reactive oxygen species, its exact clinical role in obesity has not been well studied. In this study, we investigated the efficacy and safety of pear extract (UPhenonⓇ), a dietary ingredient extracted from unripe pear (Pyrus pyrifolia), in Korean participants with obesity. The participants underwent a 12-week, randomized, double-blind placebo-controlled trial. Body fat mass, body weight, body mass index (BMI), and hematological and blood chemistry parameters were assessed. No adverse effects or significant changes were observed in the supplementation or placebo groups. Additionally, the two groups did not differ significantly in body fat mass, body weight, BMI, hematological parameters, or blood chemistry parameters, except for the liver-specific enzyme, aspartate aminotransferase. Interestingly, compared with the supplementation and placebo groups, after 12 weeks of pear extract administration, a significant decrease in aspartate aminotransferase levels was recorded, indicating that pear extract partially attenuates obesity-induced liver damage. Furthermore, when compared with baseline measurements, a significant reduction in body fat mass (−802.61±1,460.82 g, p<0.0007), body weight (−1.28±1.29 kg, p<0.0001), and BMI (−0.46±0.46 kg/m2, p<0.0001) was observed after 12 weeks of pear extract administration. Taken together, our results suggest that pear extract supplementation may effectively reduce obesity without adverse effects and it may be a promising alternative to synthetic anti-obesity drugs.

Introduction

Over the past few decades, obesity, which results from excessive white adipose tissue expansion, has steadily increased worldwide (1-3). The World Health Organization defines overweight and obesity as a body mass index (BMI, i.e., the ratio of the body weight [kg] to height squared m2) of 25∼30 kg/m2, and >30 kg/m2, respectively. It is estimated that by 2030, approximately 60% of the world’s adult population will be obese or overweight (4, 5), which are considered risk factors for obesity-associated morbidities, including type 2 diabetes, insulin resistance, cardiovascular diseases, and metabolic dysfunction-associated steatotic liver disease (MASLD) (6-9). Recently, many research groups have focused on clinical and mechanistic studies aimed at overcoming metabolic diseases by identifying potential therapeutic targets (10-13).
Traditionally, obesity treatment is based on lifestyle changes, nutritional education, and increased physical activity, which are all necessary for long-term success (4). However, because many obesity control methods have limited success, there has been an increased focus on the use of drugs with anti-obesity effects, including those that suppress appetite, reduce food intake, and limit the absorption (14, 15). Although various chemicals have been employed for this, they can cause adverse effects, including headaches, insomnia, and increased blood pressure (16). Therefore, the development of novel, safe, and effective therapeutic interventions targeting the intricate pathophysiology of obesity is required (17, 18).
Recent evidence suggests that the flavonoids and phenolic compounds in natural products and medicinal plants with anti-obesity activities are promising therapeutic agents against obesity and obesity-associated morbidities. In vitro and in vivo studies show that these compounds can significantly reduce adipocyte growth and differentiation, and improve glucose metabolism and insulin sensitivity (11, 19-21), highlighting their promise as adjuvant treatments for obesity management and prevention.
Pears (Pyrus spp.) are rich in bioactive phenolic compounds, such as flavan-3-ols, flavonoids, and phenolic acids, which have antioxidant, antimicrobial, and anti-inflammatory roles (22-24). Previous studies have shown that pear extract affects various physiological systems. An in vitro study found that treating 3T3-L1 adipocytes with pear pomace extract inhibited adipogenesis and induced mature adipocyte apoptosis via AMPK activation (25). Additionally, in obese mice, pear extract supplementation led to significant weight loss and improved metabolic parameters, including glucose tolerance and insulin sensitivity (26). However, further studies are needed to identify the biologically active compounds causing the observed effects and to evaluate the long-term safety and efficacy of pear extract in human clinical trials. Here, we show that pear extract reduces obesity without adverse side effects or undesirable changes.

Materials and Methods

Study design and population

Participants who voluntarily signed the consent form for the human application trial were assessed for compliance with the exclusion criteria through a site visit evaluation. Those who met the criteria were randomly assigned to the experimental or control groups based on the order of registration. Participants took pear extract or the placebo designated for the human application trial for 12 weeks. The inclusion criteria were: 1) an age of ≥19 years and ≤65 years; 2) a BMI of ≥25 kg/m2 and <35 kg/m2 at visits 1 and 2; 3) waist circumferences of ≥90 cm and ≥85 cm for male and female, respectively; and 4) consent to participate in the human application trial before it began and signing of a written informed consent form. The following were excluded: 1) those undergoing treatment for severe diseases of the cardiovascular, immune, respiratory, gastrointestinal/liver and biliary, renal and urinary, nervous, and musculoskeletal systems; 2) those undergoing treatment for psychiatric diseases, infectious diseases, or malignant tumors although depending on their condition, they could be included at the investigator’s discretion; 3) those using medications that affect body weight (e.g., anti-obesity drugs like appetite suppressants, fat absorption inhibitors, and GLP-1 receptor agonists, drugs for psychiatric conditions like depression or schizophrenia, as well as beta-blockers, diuretics, contraceptives, steroids, and female hormones); 4) those on health functional foods/supplements for weight control, herbal medicine, or diet-formulated foods for weight control in the month (30 days) before visit 1; 5) those with uncontrolled hypertension (systolic blood pressure of ≥160 mmHg or diastolic blood pressure of ≥100 mmHg) based on measurements taken after a 10-minute rest; 6) those with fasting blood glucose levels ≥126 mg/dL, or were taking anti-diabetic medications (e.g., oral hypoglycemic agents and insulin); 7) those with TSH levels of ≤0.1 μIU/mL or ≥10 μIU/mL; 8) those with creatinine levels more than twice higher than the upper limit for normal levels at the trial site; 9) those with aspartate aminotransferase (glutamic oxaloacetic transaminase) (AST [GOT]) or alanine aminotransferase (glutamic pyruvic transaminase) (ALT [GPT]) levels more than thrice higher than the upper limit for normal levels at the trial site; 10) those with an alcohol use disorder or central nervous system disorders; 11) those judged to be unable to exercise because of musculoskeletal disorders; 12) those with a body weight change of >10% in the three months before visit 1; 13) those who participated in a commercial weight-loss program in the three months before visit 1; 14) those who participated in another interventional clinical trial (including human application trials) in the month (30 days) before visit 1 or planned to participate in one after the start of this trial; 15) those who were pregnant, breastfeeding, or planning to become pregnant during the trial period; 16) those with sensitivity or allergy to any ingredients in this trial’s test food; and 17) those the investigator deemed unsuitable for other reasons. The trial was approved by the Institutional Review Board (HKS 2021-06-007-008 and GIRB-22418-HM).

Treatment

UPhenonⓇ (Suheung Co., Ltd.), a coated tablet with a unique flavor, is free of off-taste or smell and has a dark gray-brown color (27). Each tablet contained 800 mg, and participants were directed to take one tablet once daily with water. Corn starch, in the form of a dark gray-brown coated tablet with a unique flavor and free of off-taste or smell, was used as the control. The consumption period was 12 weeks. The effective intake was based on a study in which six-week-old C57BL/6 mice were fed a high-fat diet for six weeks, followed by daily consumption of the test food at 100 and 200 mg/kg of bw/day for five weeks. Significant toxicity was not observed in any group, and similar body fat-reducing efficacy was observed across all groups. Therefore, it was concluded that regarding the food’s efficacy, 100 and 200 mg/kg bw/day were appropriate (26). Based on FDA conversion guidelines, the preclinical effective dose of 200 mg/kg/day in mice corresponds to a human equivalent dose of approximately 975.6 mg/day for a 60 kg adult. To ensure both safety and formulation feasibility, the daily intake was conservatively set at 800 mg/day, close to the preclinical efficacy level.

Safety evaluation

To assess UPhenonⓇ’s safety, hematology and blood chemistry parameters were tested during screening. The levels of white blood cells, red blood cells, hemoglobin, platelets, neutrophils, lymphocytes, eosinophils, basophils, AST, ALT, total protein, albumin, ALP, Ca, creatine kinase, blood urea nitrogen, creatinine, uric acid, gamma-glutamyl transferase, glucose, Na, K, and Cl were evaluated at the 0- and 12-week intervention periods.

Statistical analysis

Statistical analyses were performed using SASⓇ version 9.4 (SAS Institute). Within-group comparison of changes in body fat mass before and after intake, measured using dual-energy X-ray absorptiometry (the primary efficacy evaluation variable), was done using the paired t-test. At each time point, the statistical significance of the degree of change in the experimental vs. control group was evaluated using a two-sample t-test or Wilcoxon rank sum test, depending on whether normality assumptions were met. Additionally, a generalized linear model (GLM; equivalent to ANCOVA) was used with baseline values as covariates. If the baseline characteristics were statistically significantly different between the groups, the corresponding variables were considered covariates in the GLM. For secondary efficacy evaluation variables, such as weight, waist circumference, hip circumference, waist-to-hip ratio, BMI, lean mass, blood lipids (total cholesterol, high- and low-density lipoprotein cholesterol, and triglycerides), high-sensitivity C-reactive protein, adiponectin, and leptin, the within-group comparison of the before and after intake changes were analyzed using a paired t-test. At each time point, depending on normality assumptions, the statistical significance of the degree of changes in the experimental vs. control group was evaluated using a two-sample t-test or Wilcoxon rank sum test. Any baseline characteristics with statistically significant differences between the groups were used as covariates in the GLM. All adverse reactions that occurred after test food intake were tabulated and their incidence rates were evaluated. The proportion of participants with adverse reactions in each group was then calculated and compared between the groups using a chi-square test or Fisher’s exact test. For clinical pathology tests (hematological, biochemical, and urinalysis), the within-group comparison of changes in hematological and biochemical test values before and after intake was done using the paired t-test. The statistical significance of the degree of change in the experimental vs. control groups was evaluated using the two-sample t-test or Wilcoxon rank sum test, depending on normality assumptions. Urinalysis results were classified as normal or abnormal, and within-group differences were compared using the McNemar’s test. For the vital signs, blood pressure and pulse, the within-group comparison of changes before and after intake was analyzed using the paired t-test. The statistical significance of the degree of change in the experimental vs. control groups was evaluated using the two-sample t-test or Wilcoxon rank sum test, depending on normality assumptions.

Results

Subject characterization

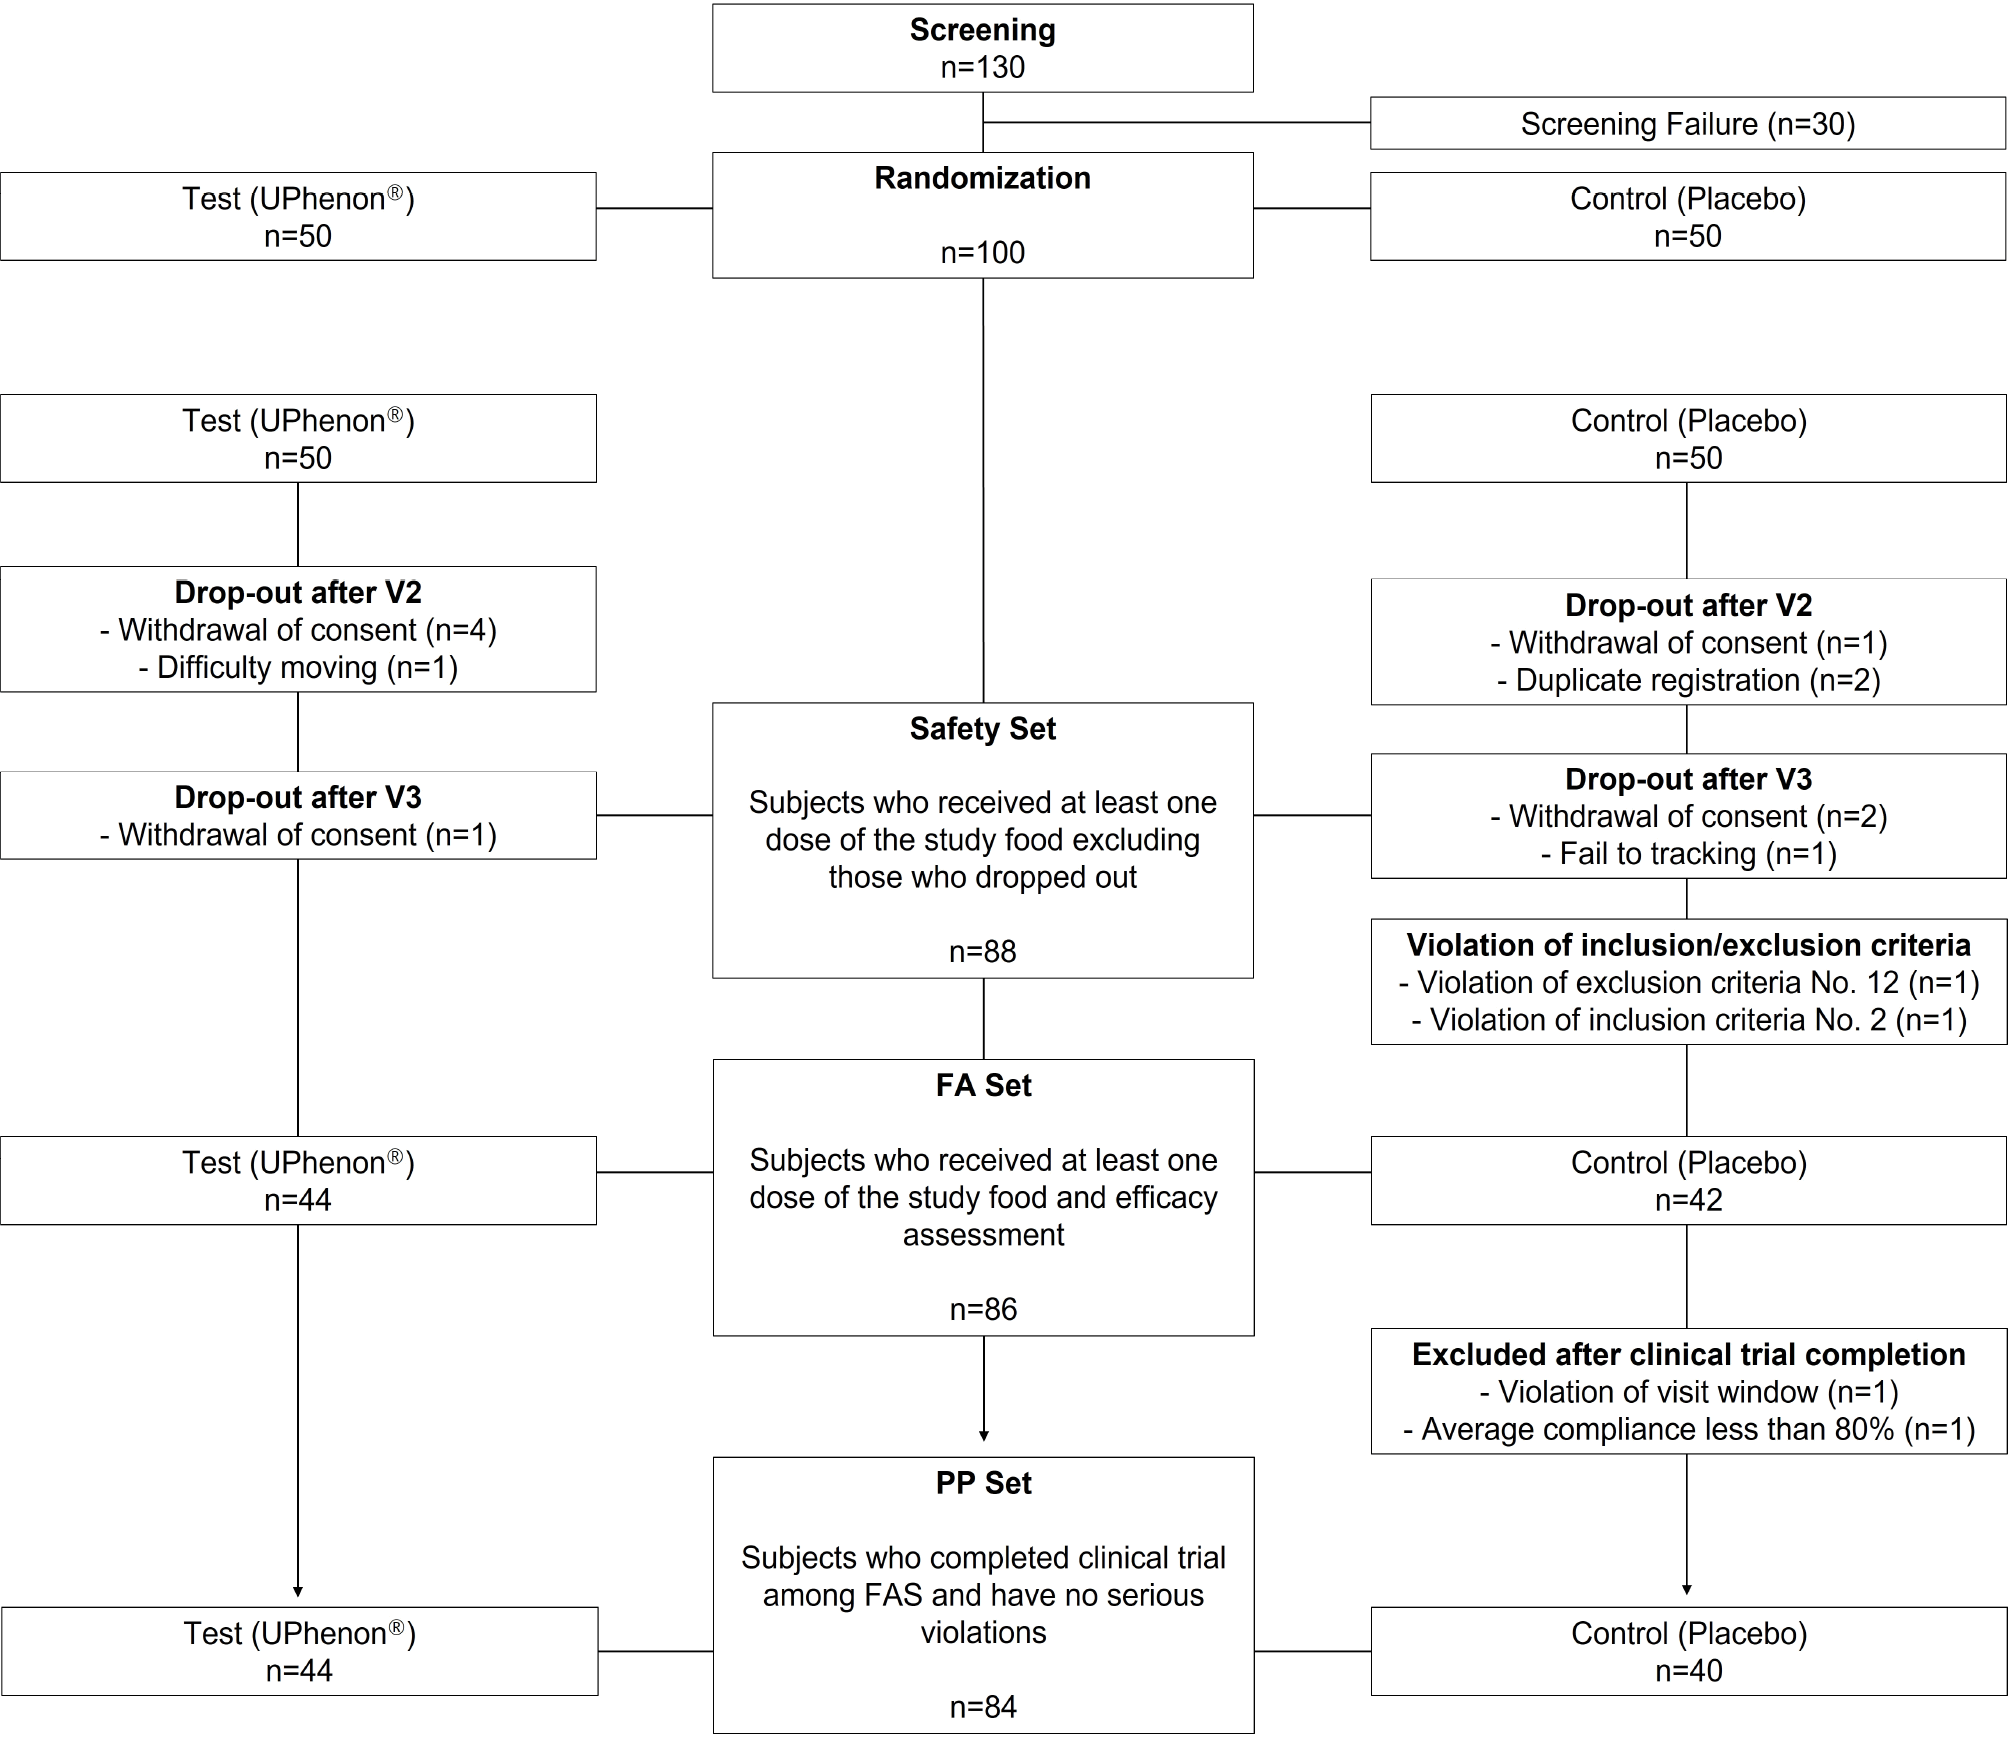
This was a randomized, double-blind, placebo-controlled parallel study with four visits. Recruitment took place between October 2021 and September 2022. Upon voluntarily signing an informed consent form, the participants underwent demographic and lifestyle surveys, medical history and medication use assessments, vital sign (blood pressure and pulse) measurements, physical examinations, clinical pathology tests, pregnancy tests (for female of childbearing age), anthropometric measurements, and BMI calculations. If they met the inclusion and exclusion criteria, they were registered in the trial through random assignment. The participants assigned to the experimental and control groups (at a 1:1 ratio) consumed the test food or the placebo, for 12 weeks respectively. The flow of participants in the trial is shown in Fig. 1. A total of 100 participants volunteered for the study and of these, 14 withdrew consent because of personal reasons or were lost to follow-up without any reason being given, and they were excluded before the release of the double-blinding.

Baseline clinical characteristics

The baseline clinical characteristics of the study participants appeared to be well-matched across several parameters (Table 1). Body weight, BMI, sex, and drinking and smoking status were similar between the two groups (Table 1). Age was also similar between the two groups (mean age: approximately 43 and 42 years for the pear extract and placebo groups, respectively.

Effect of pear extract on body weight and body mass index

Table 2 shows the changes in biomarkers after 6 and 12 weeks of pear extract supplementation. No significant differences were found between the test and placebo groups and there were no apparent pear extract adverse effects. However, when compared with baseline measurements, body fat mass (−802.61±1,460.82 g, p<0.0007), body weight (−1.28±1.29 kg, p<0.0001), waist round (−1.66±2.17 cm, p<0.0001), hip round (−1.30±2.18 cm, p<0.0003), and BMI (−0.46±0.46, p<0.0001) were significantly reduced after 12 weeks of pear extract administration (Table 2). We further investigated age and sex differences in this trial; however, no significant differences were observed between the groups (Table 3, 4).

Effect of pear extract on hematological parameters

Table 5 shows hematological parameter changes after pear extract supplementation for 12 weeks. No significant differences were found in the test vs. placebo groups, indicating no adverse effects or significant changes in the supplementation and placebo groups.

Effect of pear extract on blood chemistry parameters

Table 6 shows blood chemistry parameter changes after pear extract supplementation for 12 weeks. No significant differences were found in the test vs. placebo groups, indicating no adverse effects or significant changes in the supplementation or placebo groups, except for AST (GOT) levels, which were significantly decreased (−1.28±1.29 IU/L, p<0.0314) in the pear extract group when compared with the placebo group (Table 6). Since AST levels are strongly associated with liver injury and damage, this suggests that pear extract has potential therapeutic efficacy against obesity-induced liver diseases.

Discussion

Metabolic syndrome is defined by a cluster of risk factors that increase the likelihood of developing cardiovascular diseases, type 2 diabetes, and vascular abnormalities (28, 29). It is diagnosed when a person exhibits at least three of the following medical conditions: abdominal obesity, hypertension, hyperglycemia, high serum triglycerides, and low serum high-density lipoprotein cholesterol. Abdominal obesity, which plays a pivotal role in metabolic syndrome diagnosis, is assessed using common measurements, including waist circumference, BMI, and waist-to-hip ratio, which are widely used to evaluate obesity (30-32).
Obesity treatment often begins with lifestyle changes that incorporate diet, exercise, and behavioral modifications. Nutritional education and modification play a key role, with strategies like caloric restriction through low-calorie and carbohydrate- or fat-restricted diets. Other treatment options include anorectic drugs, probiotic/prebiotic supplementation, and bariatric surgery, a digestive system-altering weight loss procedure (31, 33, 34). However, most studies show that traditional treatments have limited success. Therefore, to effectively address obesity, combining various approaches has become increasingly important in recent years.
Natural compounds are increasingly recognized as promising therapeutic agents for obesity and associated health conditions. Numerous studies have demonstrated that these compounds can significantly help prevent and manage obesity and type-2 diabetes (11, 33). These findings suggest that natural compounds can be valuable adjunctive metabolic syndrome treatments. Our trial shows that in patients with obesity, pear extract administration for 12 weeks resulted in reduced body weight and BMI when compared with baseline measurements. Importantly, there were no significant differences observed in the pear extract vs. placebo groups, indicating that neither group experienced adverse effects or significant physiological changes, which underscores pear extract’s safety profile.
Adipocytes are differentiated from mesenchymal stem cells (MSCs) derived from tissues such as bone marrow, adipose tissue, and muscle (35). Adipocyte differentiation plays a central role in regulating energy metabolism and the development of metabolic disorders (36). MSCs initially differentiate into preadipocytes, which subsequently mature into adipocytes in response to signals such as insulin, glucocorticoids, and PPARγ. Accordingly, the expression levels of key adipogenic transcription factors, such as PPARγ, C/EBPα, and FABP4, as well as lipogenic enzymes and regulatory proteins including FAS, SCD1, ACC1 and the lipogenesis-associated transcription factor SREBP-1c, are critical for adipocyte differentiation (37). Previous studies have demonstrated that pear extract suppresses the expression of key adipogenic transcription factors, lipogenic enzymes and regulatory proteins. Furthermore, pear extract improves the expression of metabolic regulators leptin and adiponectin, enhances glycemic homeostasis and insulin sensitivity, and effectively reduces body fat accumulation by modulating energy metabolism (26). Therefore, the clinical findings obtained in this study provide compelling evidence for the therapeutic potential of pear extract in the prevention and management of obesity and metabolic disorders.
Our study has several limitations. First, the supplementation and placebo groups did not differ significantly in body fat mass, body weight, BMI, hematological parameters, or blood chemistry parameters. However, when compared with baseline measurements, a significant reduction in body fat mass, body weight, and BMI was observed after 12 weeks of pear extract administration. It is noteworthy that several metabolic parameters also improved within the placebo group. This observation may be largely explained by behavioral phenomena such as the placebo effect and the Hawthorne effect, wherein individuals alter their lifestyle practices simply due to their awareness of participating in a clinical trial. Evidence from a large-scale meta-analysis involving over 20,000 subjects in weight loss interventions supports this interpretation, reporting significant decreases in BMI, body weight, and waist circumference among placebo recipients, changes likely driven by increased motivation, attention, and self-monitoring (38). Accordingly, the biomarker reductions observed in our placebo group may reflect such non-specific behavioral influences rather than any intrinsic physiological effect. By contrast, the selective and significant decrease in body fat mass observed exclusively in the pear extract-treated group indicates a potential compound-specific mechanism of action that cannot be fully explained by behavioral factors alone. Second, because human clinical trial participants are generally influenced by their expectations and willingness to experience the functional effects of the test food, changes in their daily life and behavior may occur, which can impact the results. Although efforts are made to minimize these effects by controlling and managing the participants’ daily routines, the limitation remains. For example, in trials assessing fat loss functions, participants may engage in additional diet management and exercise to enhance the effects of fat loss. Third, after pear extract supplementation, we found a slight decrease in AST (GOT) levels, suggesting a potential association with reduced MASLD, a key metabolic syndrome-related disease. Interestingly, several studies reported that pear extract exerts beneficial effects on MASLD. For example, You et al. (39), demonstrated that pear pomace water extract suppresses liver lipid peroxidation and protects against liver injury by enhancing hepatic antioxidants. Similarly, Basit et al. (40), reported that pear extract, which contains polyphenols such as Chlorogenic acid, confers hepatoprotective effects by inhibiting the TLR4/NF-κB signaling pathway and activating the Nrf2 pathway. However, in our study, although pear extract may have the potential to reduce MASLD, no participants were evaluated as having clinically significant findings by the examiner.”
In conclusion, our findings indicate that pear extract supplementation may effectively reduce obesity without side effects, making it a promising alternative to synthetic anti-obesity medications.
Notes

Potential Conflict of Interest

KK, SRK, and DHK are employees of Suheung Technology Research Institute (Gwacheon, Korea), which developed and provided the pear extract formulation (UPhenonⓇ) used in this study. This study was conducted as a collaborative research project between academic institutions and Suheung Co. Ltd. However, Suheung Co. had no role in the study design, data analysis, data interpretation, or manuscript preparation. All other authors declare no conflicts of interest.

Authors’ Contribution

Conceptualization: YKR, SJ, SJK. Data curation: YKR, YSH, TKK, SRY. Formal analysis: YSH, TKK, SH, SRY. Funding acquisition: SJ, SJK. Investigation: YKR. Methodology: KK, SRK, DHK, YKR. Project administration: SJ, SJK. Resources: KK, SRK, DHK. Software: YSH, TKK. Supervision: SJ, SJK. Validation: YSH, SH. Visualization: SRY, TKK. Writing – original draft: YKR, SJK. Writing – review and editing: YSH, SRY, SH, SJ, SJK.

Funding

This work was supported by the National Research Foundation of Korea (NRF) grant funded by the Korean government (MSIT) (NRF-2022R1C1C1002819), the Korea Basic Science Institute (National Facilities and Equipment Center) grant funded by the Ministry of Science and ICT (RS-2024-00401816), and a grant funded by the Ministry of Education (2021R1A6C101A442). This research was also supported by the Regional Innovation System & Education (RISE) program through the Gangwon RISE Center, funded by the Ministry of Education (MOE) and the Gangwon State (G.S.), Republic of Korea (2025-RISE-10-004).

References

1. Flegal KM, Graubard BI, Williamson DF, Gail MH. 2007; Cause-specific excess deaths associated with underweight, overweight, and obesity. JAMA. 298:2028–2037. DOI: 10.1001/jama.298.17.2028. PMID: 17986696. PMCID: PMC5408160.
2. Pischon T, Boeing H, Hoffmann K, et al. 2008; General and abdominal adiposity and risk of death in Europe. N Engl J Med. 359:2105–2120. DOI: 10.1056/NEJMoa0801891. PMID: 19005195.
3. Laplante M, Horvat S, Festuccia WT, et al. 2012; DEPTOR cell-autonomously promotes adipogenesis, and its expression is associated with obesity. Cell Metab. 16:202–212. DOI: 10.1016/j.cmet.2012.07.008. PMID: 22883231. PMCID: PMC3463374.
4. Dyer RG. 1994; Traditional treatment of obesity: does it work? Baillieres Clin Endocrinol Metab. 8:661–688. DOI: 10.1016/S0950-351X(05)80290-3. PMID: 7980351.
5. Singh HJ, Ghani RA, Ramli AS, Durairajanayagam D. 2024; Revisiting the name, definition and classification of obesity. J Clin Health Sci. 9:1–5. DOI: 10.24191/jchs.v9i1.25785.
6. Hajer GR, van Haeften TW, Visseren FL. 2008; Adipose tissue dysfunction in obesity, diabetes, and vascular diseases. Eur Heart J. 29:2959–2971. DOI: 10.1093/eurheartj/ehn387. PMID: 18775919.
7. Yang M, Liu S, Zhang C. 2022; The related metabolic diseases and treatments of obesity. Healthcare (Basel). 10:1616. DOI: 10.3390/healthcare10091616. PMID: 36141228. PMCID: PMC9498506.
8. Ranganathan S, Krishnan T, Radhakrishnan S. 2015; Comparison of dyslipidemia among the normal-BMI and high-BMI group of people of rural Tamil Nadu. Med J Dr DY Patil Univ. 8:149–152. DOI: 10.4103/0975-2870.153140.
9. Abdelaal M, le Roux CW, Docherty NG. 2017; Morbidity and mortality associated with obesity. Ann Transl Med. 5:161. DOI: 10.21037/atm.2017.03.107. PMID: 28480197. PMCID: PMC5401682.
10. Kim SJ, Feng D, Guillot A, et al. 2019; Adipocyte death preferentially induces liver injury and inflammation through the activation of chemokine (C-C motif) receptor 2-positive macrophages and lipolysis. Hepatology. 69:1965–1982. DOI: 10.1002/hep.30525. PMID: 30681731. PMCID: PMC6461506.
11. Ha YS, Kim TK, Park KS, Hwang S, Kim J, Kim SJ. 2022; Inhibitory effects of Rocaglamide-A on PPARγ-driven adipogenesis through regulation of mitotic clonal expansion involving the JAK2/STAT3 pathway. Biochim Biophys Acta Mol Cell Biol Lipids. 1867:159148. DOI: 10.1016/j.bbalip.2022.159148. PMID: 35248800.
12. Ha YS, Kim TK, Heo J, et al. 2024; Rocaglamide-A mitigates LPS-induced hepatic inflammation by modulating JNK/AP-1 signaling cascade and ROS production in hepatocytes. Toxicol Res. 41:47–59. DOI: 10.1007/s43188-024-00263-y. PMID: 39802115. PMCID: PMC11717754.
13. Li YT, Shao WQ, Chen ZM, et al. 2025; GOLM1 promotes cholesterol gallstone formation via ABCG5-mediated cholesterol efflux in metabolic dysfunction-associated steatohepatitis livers. Clin Mol Hepatol. 31:409–425. DOI: 10.3350/cmh.2024.0657. PMID: 39657752. PMCID: PMC12016653.
14. Laouani A, Nasrallah H, Sassi A, et al. 2024; Antiobesity and hypolipidemic potential of nitraria retusa extract in overweight/obese women: a randomized, double-blind, placebo-controlled pilot study. Nutrients. 16:317. DOI: 10.3390/nu16020317. PMID: 38276555. PMCID: PMC10818277.
15. Pilitsi E, Farr OM, Polyzos SA, et al. 2019; Pharmacotherapy of obesity: available medications and drugs under investigation. Metabolism. 92:170–192. DOI: 10.1016/j.metabol.2018.10.010. PMID: 30391259.
16. Kim SY, Oh MR, Kim MG, Chae HJ, Chae SW. 2015; Anti-obesity effects of Yerba Mate (Ilex paraguariensis): a randomized, double-blind, placebo-controlled clinical trial. BMC Complement Altern Med. 15:338. DOI: 10.1186/s12906-015-0859-1. PMID: 26408319. PMCID: PMC4583719.
17. Kazemipoor M, Cordell GA, Sarker MMR, Hajifaraji M, En Kiat P. Radzi CwJBWM. 2015; Alternative treatments for weight loss: safety/risks and effectiveness of anti-obesity medicinal plants. Int J Food Prop. 18:1942–1963. DOI: 10.1080/10942912.2014.933350.
18. Shende P, Narvenker R. 2021; Herbal nanotherapy: a new paradigm over conventional obesity treatment. J Drug Deliv Sci Technol. 61:102291. DOI: 10.1016/j.jddst.2020.102291.
19. Zielinska-Blizniewska H, Sitarek P, Merecz-Sadowska A, et al. 2019; Plant extracts and reactive oxygen species as two counteracting agents with anti- and pro-obesity properties. Int J Mol Sci. 20:4556. DOI: 10.3390/ijms20184556. PMID: 31540021. PMCID: PMC6770307.
20. Saadeldeen FSA, Niu Y, Wang H, et al. 2020; Natural products: regulating glucose metabolism and improving insulin resistance. Food Sci Hum Wellness. 9:214–228. DOI: 10.1016/j.fshw.2020.04.005.
21. Arya A, Nahar L, Khan HU, Sarker SD. Sarker SD, Nahar L, editors. 2020. Chapter Thirteen - Anti-obesity natural products. Annual Reports in Medicinal Chemistry. Academic Press;p. 411–433. DOI: 10.1016/bs.armc.2020.02.006. PMCID: PMC7240777.
22. Li X, Wang T, Zhou B, Gao W, Cao J, Huang L. 2014; Chemical composition and antioxidant and anti-inflammatory potential of peels and flesh from 10 different pear varieties (Pyrus spp.). Food Chem. 152:531–538. DOI: 10.1016/j.foodchem.2013.12.010. PMID: 24444971.
23. Wang T, Li X, Zhou B, Li H, Zeng J, Gao W. 2015; Anti-diabetic activity in type 2 diabetic mice and α-glucosidase inhibitory, antioxidant and anti-inflammatory potential of chemically profiled pear peel and pulp extracts (Pyrus spp.). J Funct Foods. 13:276–288. DOI: 10.1016/j.jff.2014.12.049.
24. Sun L, Tao S, Zhang S. 2019; Characterization and quantification of polyphenols and triterpenoids in thinned young fruits of ten pear varieties by UPLC-Q TRAP-MS/MS. Molecules. 24:159. DOI: 10.3390/molecules24010159. PMID: 30609827. PMCID: PMC6337724.
25. Rhyu J, Kim MS, You MK, Bang MA, Kim HA. 2014; Pear pomace water extract inhibits adipogenesis and induces apoptosis in 3T3-L1 adipocytes. Nutr Res Pract. 8:33–39. DOI: 10.4162/nrp.2014.8.1.33. PMID: 24611103. PMCID: PMC3944154.
26. Truong XT, Nguyen TTP, Kang MJ, et al. 2019; Pear extract and malaxinic acid reverse obesity, adipose tissue inflammation, and hepatosteatosis in mice. Mol Nutr Food Res. 63:e1801347. DOI: 10.1002/mnfr.201801347. PMID: 31034714.
27. Park J, Kim D, Lee M, et al. 2023; Unripe pear extract suppresses UVB-induced skin photoaging in hairless mice and keratinocytes. J Med Food. 26:902–910. DOI: 10.1089/jmf.2023.K.0168. PMID: 38010847.
28. Grundy SM, Brewer HB Jr, Cleeman JI, Smith SC Jr, Lenfant C. 2004; Definition of metabolic syndrome: report of the National Heart, Lung, and Blood Institute/American Heart Association conference on scientific issues related to definition. Arterioscler Thromb Vasc Biol. 24:e13–e18. DOI: 10.1161/01.ATV.0000111245.75752.C6.
29. Kassi E, Pervanidou P, Kaltsas G, Chrousos G. 2011; Metabolic syndrome: definitions and controversies. BMC Med. 9:48. DOI: 10.1186/1741-7015-9-48. PMID: 21542944. PMCID: PMC3115896.
30. Reaven GM. 2006; The metabolic syndrome: is this diagnosis necessary? Am J Clin Nutr. 83:1237–1247. DOI: 10.1093/ajcn/83.6.1237. PMID: 16762930.
31. Bray GA, Tartaglia LA. 2000; Medicinal strategies in the treatment of obesity. Nature. 404:672–677. DOI: 10.1038/35007544. PMID: 10766254.
32. Scott CL. 2003; Diagnosis, prevention, and intervention for the metabolic syndrome. Am J Cardiol. 92:35i–42i. DOI: 10.1016/S0002-9149(03)00507-1. PMID: 12867253.
33. Vasudeva N, Yadav N, Sharma SK. 2012; Natural products: a safest approach for obesity. Chin J Integr Med. 18:473–480. DOI: 10.1007/s11655-012-1120-0. PMID: 22821661.
34. Wiciński M, Gębalski J, Gołębiewski J, Malinowski B. 2020; Probiotics for the treatment of overweight and obesity in humans-a review of clinical trials. Microorganisms. 8:1148. DOI: 10.3390/microorganisms8081148. PMID: 32751306. PMCID: PMC7465252.
35. Berry R, Rodeheffer MS. 2013; Characterization of the adipocyte cellular lineage in vivo. Nat Cell Biol. 15:302–308. DOI: 10.1038/ncb2696. PMID: 23434825. PMCID: PMC3721064.
36. Billon N, Dani C. 2012; Developmental origins of the adipocyte lineage: new insights from genetics and genomics studies. Stem Cell Rev Rep. 8:55–66. DOI: 10.1007/s12015-011-9242-x. PMID: 21365256.
37. Rosen ED, Spiegelman BM. 2014; What we talk about when we talk about fat. Cell. 156:20–44. DOI: 10.1016/j.cell.2013.12.012. PMID: 24439368. PMCID: PMC3934003.
38. Chin YH, Ng CH, Chew NW, et al. 2022; The placebo response rate and nocebo events in obesity pharmacological trials. A systematic review and meta-analysis. EClinicalMedicine. 54:101685. DOI: 10.1016/j.eclinm.2022.101685. PMID: 36193169. PMCID: PMC9526167.
39. You MK, Rhuy J, Kim HA. 2017; Pear pomace water extract suppresses hepatic lipid peroxidation and protects against liver damage in rats fed a high fat/cholesterol diet. Food Sci Biotechnol. 26:801–806. DOI: 10.1007/s10068-017-0084-4. PMID: 30263606. PMCID: PMC6049591.
40. Basit A, Shahzad R, Mueed A, et al. 2025; A critical review on pear Fruit's polyphenols and its chlorogenic acid: composition, bioavailability, and pharmacological potential. Food Biosci. 68:106407. DOI: 10.1016/j.fbio.2025.106407.

Fig. 1
CONSORT flow diagram of the clinical trial. The diagram summarizes the number of participants who completed each phase of the trial, including dropouts, exclusions due to protocol violations, and the final number of subjects included in the safety, full analysis (FA), and per-protocol (PP) sets.
ijsc-19-2-242-f1.tif
Table 1
Baseline clinical characteristics between the test product and placebo groups
Test (n=44) Placebo (n=40) p-valueb
Sex
Male 14 (31.82) 9 (22.50) 0.3388 (C)
Female 30 (68.18) 31 (77.50)
Fertility statusa
Yes 20 (66.67) 25 (80.65) 0.2147 (C)
No 10 (33.33) 6 (19.35)
Age (yr) 42.20±11.69 43.28±10.17 0.6570 (T)
Birth statusa
Yes 21 (70.00) 22 (70.97) 0.9340 (T)
No 9 (30.00) 9 (29.03)
Drinking status
Yes 21 (47.73) 21 (52.50) 0.6622 (C)
No 23 (52.27) 19 (47.50)
Smoking status
Never smoke 40 (90.91) 34 (85.00) 0.7316 (F)
Quit (≥1 yr) 0 (0.00) 0 (0.00)
Quit (<1 yr) 1 (2.27) 1 (2.50)
Current smoker 3 (6.82) 5 (12.50)
Body weight (kg) 77.85±10.12 75.93±13.51 0.1610 (W)
Body mass index (kg/m2) 28.33±2.15 28.12±2.60 0.3445 (W)
Serum lipid
Total cholesterol (mg/dL) 198.20±31.13 194.38±37.04 0.6083 (T)
HDL-cholesterol (mg/dL) 52.50±10.64 54.10±10.86 0.4976 (T)
LDL-cholesterol (mg/dL) 119.91±30.62 118.35±30.72 0.8166 (T)
Triglyceride (mg/dL) 142.41±91.08 121.33±60.58 0.6003 (W)
hs-CRP (mg/L) 1.72±3.23 1.57±2.46 0.8648 (W)
Adiponectin (ng/mL) 8.41±3.22 8.22±3.04 0.7916 (W)
Leptin (ng/mL) 15.50±11.49 14.17±7.84 0.9251 (W)

Values are presented as number (%) or mean±standard deviation.

HDL: high-density lipoprotein, LDL: low-density lipoprotein, hs-CRP: high-sensitivity C-reactive protein.

aOnly subjects with sex ‘female.’

bCompared between groups; p-values for chi-square test (C), Fisher’s exact test (F), two-sample t-test (T), or Wilcoxon rank sum test (W).

Table 2
Changes in biomarkers at baseline, week 6, and week 12 after supplementation
Per-protocol set analysis

Test (n=44) Placebo (n=40) p-valuea

(% change)b (% change)b
Body fat mass (g)
Baseline 28,434.62±5,430.00 27,646.19±6,058.90
12 weeks 27,632.01±5,750.02 27,258.38±6,146.94
Changes from baseline −802.61±1,460.82 (−2.82) −387.81±1,433.42 (−1.4) 0.1934 (T)
p-value 0.0007 0.095
Body weight (kg)
Baseline 77.85±10.12 75.93±13.51
6 weeks 76.98±10.12 75.42±13.59
Changes from baseline −0.87±1.23 (−1.12) −0.51±1.06 (−0.67) 0.1616 (T)
p-value <0.0001 0.0042
12 weeks 76.57±10.12 75.12±13.59
Changes from baseline −1.28±1.29 (−1.64) −0.82±1.68 (−1.08) 0.1613 (T)
p-value <0.0001 0.0039
Waist round (cm)
Baseline 94.88±5.92 94.53±7.77
6 weeks 93.86±6.25 93.74±7.84
Changes from baseline −1.02±1.50 (−1.08) −0.79±1.02 (−0.84) 0.4042 (T)
p-value <0.0001 <0.0001
12 weeks 93.22±6.37 93.18±7.84
Changes from baseline −1.66±2.17 (−1.75) −1.35±1.47 (−1.43) 0.4427 (T)
p-value <0.0001 <0.0001
Hip round (cm)
Baseline 104.88±5.47 103.98±5.56
6 weeks 103.84±5.16 103.54±5.48
Changes from baseline −1.04±1.47 (−0.99) −0.44±0.97 (−0.42) 0.0272 (T)
p-value <0.0001 0.0068
12 weeks 103.58±4.95 102.88±5.62
Changes from baseline −1.30±2.18 (−1.24) −1.10±1.32 (−1.06) 0.5725 (W)
p-value 0.0003 <0.0001
Body mass index
Baseline 28.33±2.15 28.12±2.60
6 weeks 28.01±2.29 27.94±2.71
Changes from baseline −0.32±0.45 (−1.13) −0.19±0.40 (−0.68) 0.1568 (T)
p-value <0.0001 0.0055
12 weeks 27.86±2.32 27.83±2.69
Changes from baseline −0.46±0.46 (−1.62) −0.30±0.61 (−1.07) 0.1123 (W)
p-value <0.0001 0.0036

Values are presented as mean±standard deviation.

aCompared between groups; p-values for two-sample t-test (T) or Wilcoxon rank sum test (W).

bPercent change=(12 weeks measurement–initial measurement)/initial measurement×100%.

Table 3
Fat mass (g) measured by dual-energy X-ray absorptiometry, by age group (per-protocol set)
Per-protocol set analysis

Test Placebo p-valuea

(% change)b (% change)b
Body fat mass (g)_age 20∼44
Number 24 21
Baseline 28,685.36±5,671.74 28,013.73±7,389.89
12 weeks 27,354.42±5,805.77 27,261.72±7,174.37
Change from baseline −1,330.95±1,413.42 (−4.64) −752.0±1,117.58 (−2.68) 0.1387 (T)
p-value 0.0001 0.0059
Body fat mass (g)_age 45∼65
Number 20 19
Baseline 28,133.72±5,254.84 27,239.97±4,304.54
12 weeks 27,965.12±5,814.54 27,254.70±4,967.56
Change from baseline −168.61±1,278.86 (−0.6) 14.73±1,654.78 (0.05) 0.7021 (T)
p-value 0.5624 0.9695

Values are presented as mean±standard deviation.

aCompared between groups; p-values for two-sample t-test (T).

bPercent change=(12 weeks measurement–initial measurement)/initial measurement×100%.

Table 4
Fat mass (g) measured by dual-energy X-ray absorptiometry, by sex (per-protocol set)
Per-protocol set analysis

Test Placebo p-valuea

(% change)b (% change)b
Body fat mass (g)_Male
Number 14 9
Baseline 25,422.85±6,249.47 27,461.51±9,959.54
12 weeks 24,638.41±6,744.19 27,459.32±10,012.68
Change from baseline −784.43±1,614.91 (−3.09) −2.19±2,113.82 (0.01) 0.3598 (T)
p-value 0.0923 0.9976
Body fat mass (g)_Female
Number 30 31
Baseline 29,840.11±4,448.45 27,699.81±4,610.74
12 weeks 29,029.02±4,721.17 27,200.05±4,729.73
Change from baseline −811.09±1,412.4 (−2.72) −499.76±1,192.49 (−1.8) 0.3555 (T)
p-value 0.0038 0.0265

Values are presented as mean±standard deviation.

aCompared between groups; p-values for two-sample t-test (T).

bPercent change=(12 weeks measurement–initial measurement)/initial measurement×100%.

Table 5
Changes in hematological parameters after 12 weeks supplementation
Safety set analysis

Test (n=44) Placebo (n=44) p-valuea

(% change)b (% change)b
WBC (103/μL)
Baseline 6.13±1.79 6.58±2.22
12 weeks 5.90±1.62 6.09±1.74
Changes from baseline −0.29±1.57 (−4.73) −0.33±1.51 (−5.02) 0.6826 (W)
p-value 0.2355 0.1527
RBC (106/μL)
Baseline 4.66±0.42 4.68±0.42
12 weeks 4.64±0.45 4.59±0.48
Changes from baseline −0.02±0.20 (−0.43) −0.06±0.24 (−1.28) 0.3046 (W)
p-value 0.4773 0.1064
Hb (g/dL)
Baseline 14.01±1.25 13.95±1.18
12 weeks 13.96±1.31 13.86±1.47
Changes from baseline −0.05±0.63 (−0.36) −0.07±0.79 (−0.5) 0.6400 (W)
p-value 0.6327 0.5438
Platelet (103/μL)
Baseline 270.62±79.18 275.48±73.28
12 weeks 262.93±66.09 273.05±74.08
Changes from baseline −0.66±28.28 (−0.24) −0.41±32.22 (−0.15) 0.9268 (W)
p-value 0.8779 0.9333
Neutrophil (%)
Baseline 56.67±8.01 55.26±7.36
12 weeks 54.75±8.22 54.23±7.81
Changes from baseline −1.78±7.75 (−3.14) −0.98±6.83 (−1.77) 0.6856 (W)
p-value 0.1358 0.3467
Lymphocyte (%)
Baseline 33.45±7.60 35.11±7.09
12 weeks 34.67±7.47 35.56±7.24
Changes from baseline 1.19±6.17 (3.56) 0.40±5.94 (1.14) 0.7322 (W)
p-value 0.2089 0.6574
Eosinophil (%)
Baseline 2.30±1.52 2.07±1.78
12 weeks 2.47±1.82 2.27±2.21
Changes from baseline 0.16±1.25 (6.96) 0.21±0.79 (10.14) 0.907 (W)
p-value 0.3909 0.0786
Basophil (%)
Baseline 0.69±0.39 0.65±0.30
12 weeks 0.64±0.30 0.61±0.27
Changes from baseline −0.05±0.34 (−7.25) −0.03±0.28 (−4.62) 0.7498 (W)
p-value 0.3404 0.454

Values are presented as mean±standard deviation.

WBC: white blood cell, RBC: red blood cell, Hb: hemoglobin.

aCompared between groups; p-values for two-sample t-test (T) or Wilcoxon rank sum test (W).

bPercent change=(12 weeks measurement–initial measurement)/initial measurement×100%.

Table 6
Changes in blood chemistry parameters after 12 weeks supplementation
Safety set analysis

Test (n=44) Placebo (n=44) p-valuea

(% change)b (% change)b
AST (GOT) (IU/L)
Baseline 24.40±10.56 23.02±7.81
12 weeks 21.73±5.70 23.14±9.09
Changes from baseline −2.66±9.48 (−10.9) 0.86±7.91 (3.74) 0.0314 (W)
p-value 0.0696 0.4729
ALT (GPT) (IU/L)
Baseline 23.62±15.90 24.20±18.41
12 weeks 19.25±7.50 22.52±16.91
Changes from baseline −3.82±13.66 (−16.17) −0.18±12.42 (−0.74) 0.1253 (W)
p-value 0.0705 0.9231
Protein (g/dL)
Baseline 7.13±0.40 7.15±0.35
12 weeks 7.12±0.37 7.20±0.40
Changes from baseline −0.01±0.29 (−1.12) 0.06±0.39 (−2.1) 0.3369 (T)
p-value 0.876 0.2837
Albumin (g/dL)
Baseline 4.37±0.20 4.34±0.20
12 weeks 4.35±0.24 4.42±0.32
Changes from baseline −0.02±0.21 (−0.23) 0.08±0.26 (0.46) 0.1768 (W)
p-value 0.5189 0.054
Total bilirubin (g/dL)
Baseline 0.68±0.27 0.57±0.19
12 weeks 0.72±0.25 0.63±0.25
Changes from baseline 0.05±0.21 (7.35) 0.05±0.24 (8.77) 0.6921 (W)
p-value 0.1072 0.1633
ALP (IU/L)
Baseline 57.60±21.36 56.34±16.19
12 weeks 56.61±20.04 57.41±16.15
Changes from baseline −1.93±6.73 (−3.35) 0.48±6.84 (1.14) 0.0694 (W)
p-value 0.0637 0.6459
Ca (mg/dL)
Baseline 9.34±0.37 9.23±0.40
12 weeks 9.24±0.29 9.28±0.37
Changes from baseline −0.08±0.35 (−0.86) 0.03±0.39 (0.33) 0.0761 (W)
p-value 0.1332 0.6463
CK (IU/L)
Baseline 111.66±61.08 105.74±67.47
12 weeks 106.02±53.88 120.09±75.94
Changes from baseline −3.82±44.22 (−3.42) 12.93±61.76 (12.23) 0.3785 (W)
p-value 0.5698 0.172
BUN (mg/dL)
Baseline 12.34±3.04 13.06±3.31
12 weeks 12.19±3.33 12.63±2.77
Changes from baseline −0.11±2.34 (−1.22) −0.64±3.69 (−3.29) 0.4301 (T)
p-value 0.7489 0.259
Creatinine (mg/dL)
Baseline 0.73±0.16 0.71±0.14
12 weeks 0.72±0.17 0.69±0.13
Changes from baseline −0.02±0.11 (−2.74) −0.01±0.10 (−1.41) 0.7198 (T)
p-value 0.1983 0.3862
Uric acid (mg/dL)
Baseline 5.37±1.25 5.31±1.32
12 weeks 5.48±1.38 5.43±1.33
Changes from baseline 0.10±0.76 (1.86) 0.16±0.76 (2.26) 0.7352 (W)
p-value 0.3867 0.1805
γ-GTP (IU/L)
Baseline 27.68±27.33 27.16±16.93
12 weeks 26.14±22.91 29.73±27.99
Changes from baseline −1.45±18.13 (−5.24) 2.82±15.92 (10.38) 0.9800 (W)
p-value 0.5973 0.2468
Glucose (mg/dL)
Baseline 96.44±10.77 97.06±9.62
12 weeks 96.34±11.84 98.77±10.92
Changes from baseline −0.68±6.90 (−0.71) 0.77±10.07 (1.76) 0.4316 (T)
p-value 0.5155 0.6132
Na (mmol/L)
Baseline 139.42±1.83 139.52±2.54
12 weeks 139.75±1.81 139.27±1.85
Changes from baseline 0.20±1.87 (0.14) −0.32±2.20 (−0.23) 0.2332 (T)
p-value 0.4732 0.3421
Cl (mmol/L)
Baseline 103.86±2.24 103.96±2.34
12 weeks 104.00±2.44 103.70±2.01
Changes from baseline 0.23±1.96 (0.22) −0.45±1.66 (−0.43) 0.1109 (W)
p-value 0.4467 0.0768

Values are presented as mean±standard deviation.

AST (GOT): aspartate aminotransferase (glutamic oxaloacetic transaminase), ALT (GPT): alanine aminotransferase (glutamic pyruvic transaminase), ALP: alkaline phosphatase, CK: creatine kinase, BUN: blood urea nitrogen, γ-GTP: gamma-glutamyl transferase.

aCompared between groups; p-values for two-sample t-test (T) or Wilcoxon rank sum test (W).

bPercent change=(12 weeks measurement–initial measurement)/initial measurement×100%.

TOOLS
Similar articles