



 PDF
 Citation
 Print


INTRODUCTION
Gallbladder and biliary diseases are classified as either benign or malignant entities. Benign diseases of the gallbladder and biliary (BGB) are among the most prevalent conditions affecting the digestive system. These disorders elevate the risk of developing severe sepsis and cancer, posing significant challenges for both healthcare professionals and patients [1,2]. Cholelithiasis, a common benign disorder of the gallbladder, affects about 20% of the Western population and is the primary reason for gastrointestinal disease-related hospital admissions in Europe [3]. Cholelithiasis has been most frequently observed in North American Indigenous populations, with reported rates of 64.1% in female and 29.5% in male [4]. Its etiology is multifactorial: non-modifiable risk factors include race, genetic predisposition, advanced age, and sex, while modifiable factors include dietary habits, physical activity level, and obesity.
Malignant neoplasms of the gallbladder and biliary tract (MGB) exhibit a relatively low incidence; however, they are notable for their subtle onset, aggressive invasive behavior, delayed clinical detection, and unfavorable prognosis [5]. Gallbladder carcinoma is recognized as the most prevalent and aggressive malignancy within the biliary tract. Global cancer statistics from 2022 indicate approximately 120,000 new diagnoses and 90,000 deaths attributable to gallbladder cancer [6]. There is substantial geographic variation in the incidence of gallbladder carcinoma. Notably, the highest burdens are seen among indigenous groups in South America, northern India, and East Asia [7]. Although chronic inflammation resulting from long-standing cholelithiasis persists as the leading risk factor, additional contributors—including sex, ethnicity, and metabolic conditions—also play significant roles in gallbladder carcinogenesis [5].
Analysis of affected populations, geographic distributions, and ethnic patterns for both BGB and MGB demonstrates numerous associations between these groups. Despite this, recent Global Burden of Disease (GBD) studies have generally examined either BGB or MGB individually, and many have not fully described the epidemiologic characteristics of the condition under investigation [8-12]. By utilizing the latest GBD dataset, the current study seeks to address these gaps.
MATERIALS AND METHODS
Data acquisition
The GBD 2021 study offers a comprehensive assessment of health impairment linked to 369 diseases, injuries, and damages, as well as 88 risk factors across 204 countries and territories. The methodological framework and analytic techniques used have been detailed in prior publications [1]. For this analysis, data were accessed by searching the keywords ‘Gallbladder and biliary diseases’ and ‘gallbladder and biliary tract cancer’ on the GBD website (https://www.healthdata.org/). Within the GBD study, BGB is identified by International Classification of Diseases 10th revision codes K80–K83.9 (Supplementary Table 1). MGB is defined using codes C23 (gallbladder cancer) and C24–C24.9 (biliary tract cancer) (Supplementary Table 2).
Given that certain patient information in the GBD data was already anonymized, the Institutional Review Board at the University of Washington indicated that additional researchers could be exempted from obtaining patient consent when analyzing these data [13]. All components of this study strictly followed the Guidelines for Accurate and Transparent Reporting of Health Estimates [14].
Estimation framework
The investigation applied robust modeling techniques to examine the burden of gallbladder and biliary disease [1]. Specifically, the Disease Modelling-Bayesian Meta-Regression 2.1 tool was used to estimate disease incidence and prevalence. This platform incorporated multiple variables, epidemiological associations, and geospatial information to enable reliable estimates.
Mortality estimates were generated using the CODEm framework, a comprehensive system for modeling causes of death that integrates data from vital registration and verbal autopsy sources. The approach used to calculate disability-adjusted life years (DALYs) is detailed in prior publications [15]. In summary, DALYs were derived by summing YLDs (years lived with disability) and YLLs (years of life lost). YLDs were obtained by multiplying the prevalence of each sequela by its designated disability weight, while YLLs were determined by multiplying the number of deaths by the standard life expectancy at the corresponding age of death [16].
Socio-demographic index (SDI)
By using indicators including the total fertility rate for female under 25, levels of educational attainment, and per capita income, the SDI quantifies the degree of development within a region. SDI scores, which range from 0 to 1, denote the level of socioeconomic development, where 0 signifies the lowest and 1 the highest development [16]. For this analysis, countries and subnational areas were categorized into five SDI groups (low, low-middle, middle, high-middle, and high) according to the definitions used in the GBD, in order to evaluate the relationship between socioeconomic status and gallbladder and biliary diseases.
Risk factors
The GBD 2021 study not only elucidated the core epidemiological characteristics of various diseases but also conducted a comprehensive evaluation of their related risk factors. Our investigation specifically focuses on the risk factors for BGB (smoking and high body mass index [BMI]) and MGB (high BMI). To ensure methodological consistency and robustness, our study aligns with established approaches documented in prior research [15]. Utilizing Disease Modelling-Bayesian Meta-Regression 2.1 and spatio-temporal Gaussian process regression, we assessed the exposure distribution for each individual risk factor while considering variables such as age, sex, year, and geographic region, and subsequently established the Theoretical Minimum Risk Exposure Level (TMREL). The population attributable fractions (PAFs) for these risk factors were calculated by integrating exposure data, relative risk estimates, and TMREL. The PAFs for hazardous elements were derived from an integrated approach that combined exposure metrics and relative risk assessments, along with TMREL. The PAFs specifically measured the proportionate change in gallbladder and biliary disease risk that could be achieved if the corresponding risk factors were reduced to the TMREL. Ultimately, the PAFs were multiplied by disease burden indicators (DALYs for this study) to quantify the attributable risk burden.
Forecasting
Drawing on global epidemiological data on gallbladder and biliary diseases spanning 1990–2021, the Bayesia analysis n age-period-cohort (BAPC) methodology was applied to project disease trends for the years 2022–2050. Future standardized population metrics were based on population projections for 2021 obtained from the GBD database. The BAPC approach was chosen for its proficiency in managing complex, high-dimensional data frequently encountered in large-scale epidemiological analyses [17].
The foundation of the BAPC model is the age-period-cohort analysis (APC). The classical APC model characterizes and forecasts disease trends according to age, period, and cohort effects. Given the intercorrelation among these three variables in the APC model, which complicates parameter estimation, integrating a Bayesian framework into the APC model is essential to resolve these estimation challenges.
In this study, we applied the BAPC package, which was developed by Riebler et al. [18], within the R statistical software environment. The model can be easily specified, and it provides direct access to summary plots and parameter estimates. Notably, the authors utilized the Integrated Nested Laplace Approximation (INLA) method to approximate the posterior marginal distributions, effectively bypassing the need for Markov Chain Monte Carlo (MCMC) sampling and eliminating issues inherent to MCMC approaches, including concerns about convergence and mixing. Comprehensive details on the INLA methodology can be found in Rue et al. [19] To examine differences in predictive performance across short-term and long-term intervals, we evaluated the cumulative average continuous ranked probability score and compared these findings with outcomes from a quasi-Poisson adaptation of the generalized Lee–Carter (LC) model.
Statistical analysis
Trends in age-standardized rates (ASRs) of prevalence, incidence, mortality, and DALYs for gallbladder and biliary disorders from 1990 to 2021 were reported as estimated annual percentage change (EAPC). The procedures for calculating EAPC have been extensively described elsewhere [20]. The ASR is considered to be increasing when both the EAPC and the lower bound of the 95% confidence interval (CI) are greater than zero. In contrast, when both the EAPC and the upper limit of the 95% CI are below zero, the ASR is interpreted as declining. If neither criterion is satisfied, the ASR is categorized as stable. Analyses and visualizations were performed using R software (version 4.3.1).
RESULTS
Global burden of gallbladder and biliary tract diseases
In 2021, gallbladder and biliary tract diseases continued to exert a considerable global burden, with a total of 251,889,322 recorded cases, including 251,574,856.96 BGB and 314,465.15 MGB cases. These values represent increases of 67.3% and 141.9%, respectively, relative to 1990. Notably, benign forms accounted for 99.88% of all gallbladder and biliary tract diseases, while 0.12% were classified as malignant (Supplementary Table 3, 4).
Benign diseases of the gallbladder and biliary
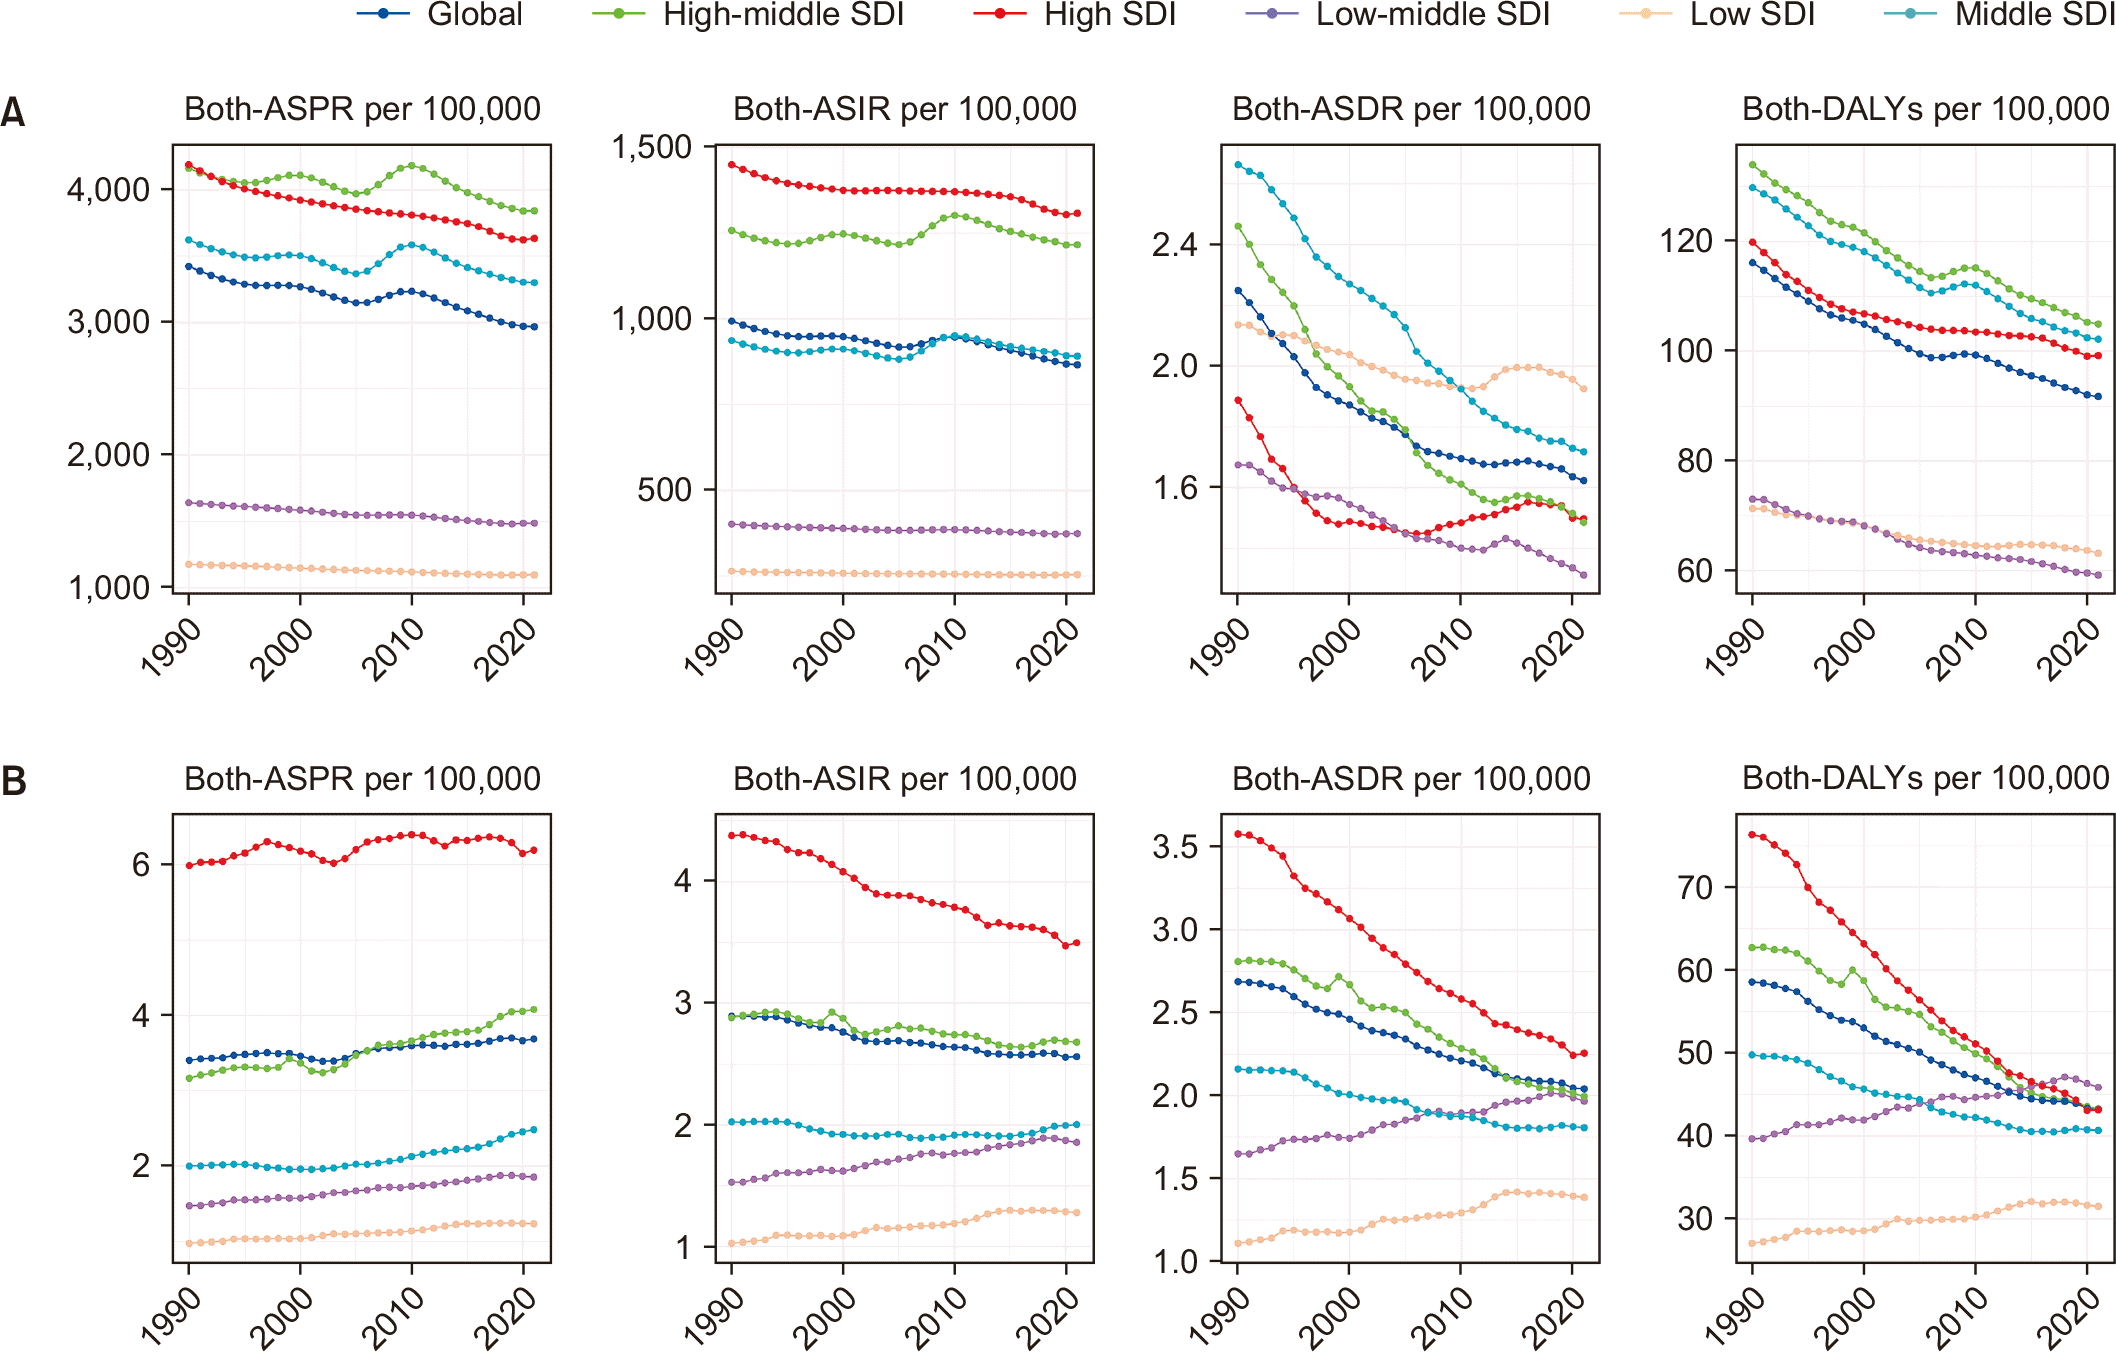
Although there was a significant increase in the total number of BGB cases, the age-standardized prevalence rate (ASPR) exhibited a modest decline, decreasing from 3,422.23 per 100,000 individuals in 1990 to 2966.67 per 100,000 individuals in 2021. The EAPC for ASPR was –0.38 (95% CI: –0.43 to –0.33). Analysis of the global BGB burden highlighted marked regional differences, closely aligned with SDI levels. A positive correlation was observed between ASPR and SDI (Supplementary Fig. 1A). In particular, in 2021 the highest rate was observed in high-middle SDI areas at 3,841.51 per 100,000, while low SDI areas recorded the lowest rate at 1,094.72 per 100,000 (Supplementary Table 3). Additionally, there were marked regional variations in ASPR trends across SDI strata between 1990 and 2021. Nevertheless, an overall downward trend was observed. The largest reduction in ASPR occurred in regions with a high SDI, as indicated by an EAPC of –0.4 (95% CI: –0.43 to –0.38). Specifically, in high SDI areas, the ASPR declined from 4,188.44 in 1990 to 3,633.4 per 100,000 in 2021 (Supplementary Table 3, Fig. 1A).
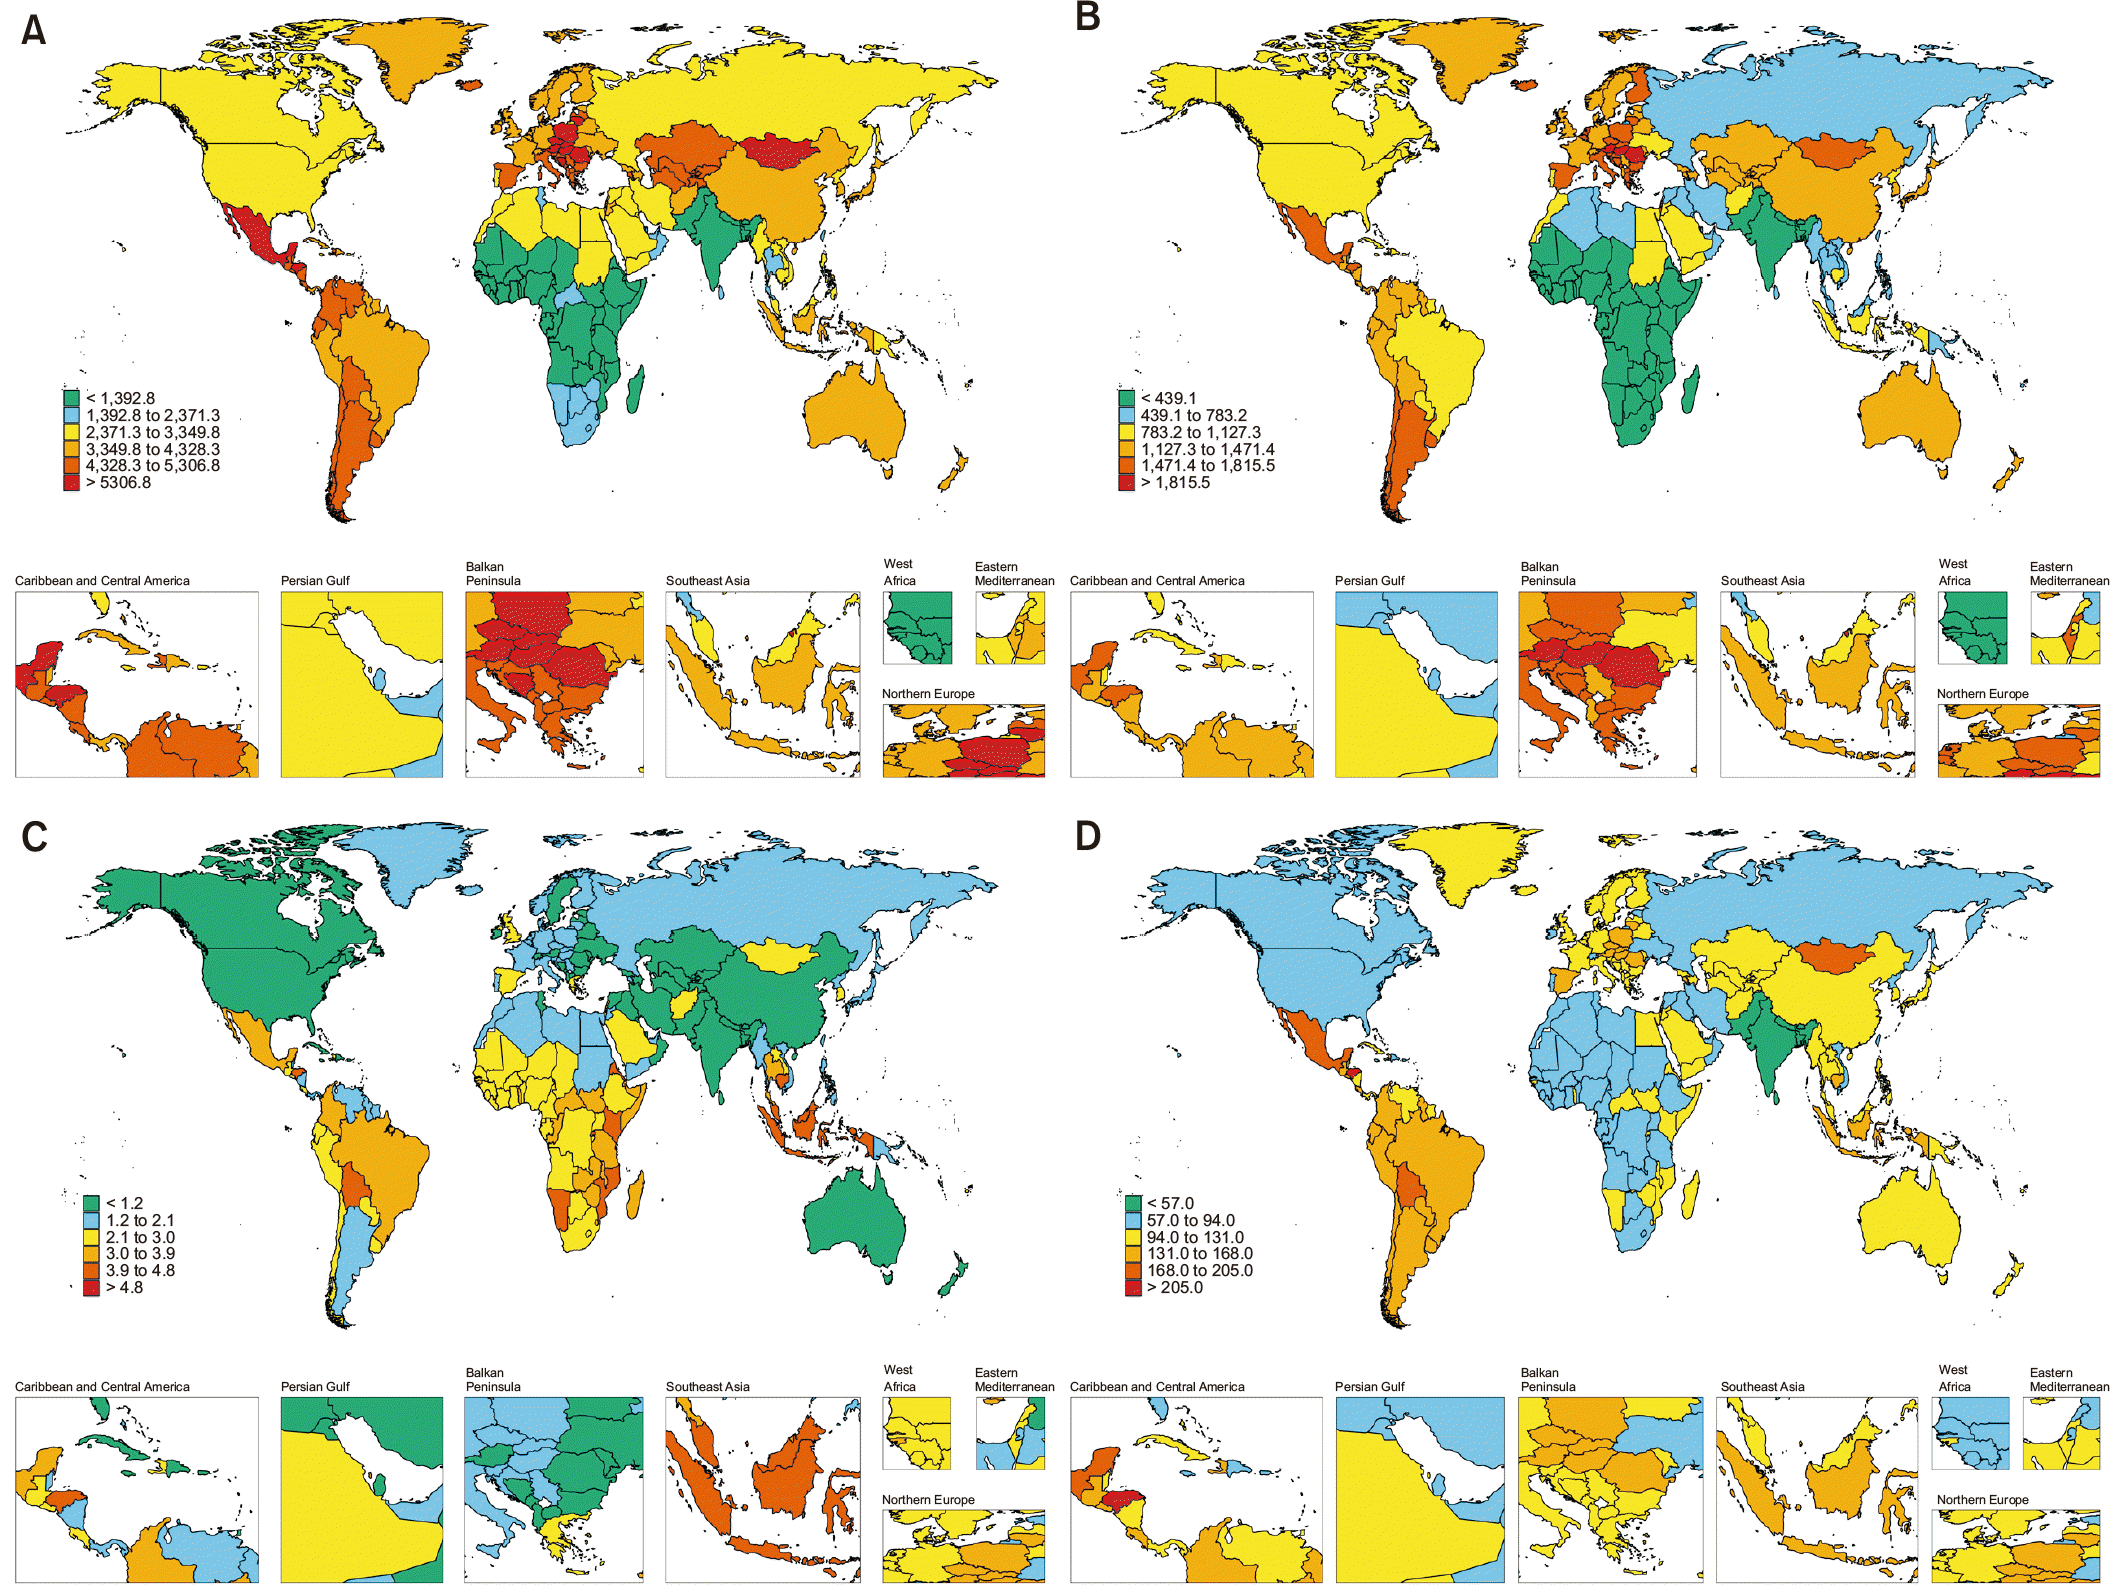
The 2021 findings demonstrate that the burden of BGB differs widely among the 21 GBD regions (Supplementary Fig. 1). Notably, Central Europe reported the highest ASPR at 5,356.27 per 100,000 (95% uncertainty interval [UI]: 4,678.87–6,186.83). South Asia displayed the lowest BGB ASPR, registering 426.7 per 100,000 population (95% UI: 363.33–506.01) (Table 1, Supplementary Fig. 1A). Of particular note, only Central Latin America and East Asia demonstrated an increasing ASPR, whereas all other regions experienced varying levels of decline from 1990 to 2021 (Table 1, Supplementary Table 3). Among 204 countries and territories examined, Honduras (6,285.5 per 100,000; 95% UI: 5,436.1–7,408.6), Mexico (5,731.2 per 100,000; 95% UI: 4,942.1–6,673.9), and Romania (5,722.5 per 100,000; 95% UI: 4,820.7–6,798.3) exhibited the highest ASPR in 2021 (Fig. 2A, Supplementary Table 5). Furthermore, Mexico not only had a higher ASPR but also demonstrated the most pronounced increase, reflected by an EAPC of 0.7 (95% CI: 0.6–0.7) (Supplementary Table 5, Supplementary Fig. 2A).
For BGB, the global incidence in 2021 reached 73,246,893.43 cases, marking a 60.11% increase compared to 1990. However, the age-standardized incidence rate (ASIR) declined from 992.88 in 1990 to 865.4 per 100,000 in 2021. The EAPC for ASIR was –0.32 (95% CI: –0.38 to –0.26), indicating a persistent reduction in BGB incidence (Table 1, Supplementary Table 3). As the SDI level increased, ASIR also rose, from a minimum of 253.7 cases to 1307.19 cases per 100,000 population in 2021 (Table 1, Supplementary Table 3, Fig. 1A). Consistent with ASPR patterns, the Central Europe region exhibited the highest ASIR, recorded at 1,732.69 per 100,000 (95% UI: 1,507.39–2,004.81) in 2021 (Table 1, Supplementary Table 3). Across all countries, Austria had the greatest ASIR (2,159.5 per 100,000) for BGB in 2021, with a downward trajectory over time (EAPC: –0.23, 95% CI: –0.26 to –0.2). While Mexico did not have the highest ASIR, with approximately 1,562.7 per 100,000, it showed the most substantial increase, with an EAPC of 0.83 (95% CI: 0.74–0.91). In contrast, the lowest ASIR values were observed in Pakistan (95 per 100,000), Bangladesh (97.4 per 100,000), and India (99.4 per 100,000) (Fig. 2B, Supplementary Table 6, Supplementary Fig. 2B).
In 2021, the estimated mortality for the disease was 131,110.4 cases, with an age-standardized death rate (ASDR) of 1.62 per 100,000 and an EAPC of –0.95 (95% CI: –1.07 to –0.84) (Table 1, Supplementary Table 3). Both the ASDR and age-standardized DALYs exhibited downward trends across the various SDI regions (Table 1, Supplementary Table 3, Fig. 1A). Furthermore, significant negative correlations were identified between the ASDR and SDI (ASIR: R = −0.475, p < 0.001) (Supplementary Fig. 3C). Geographically, the Eastern Sub-Saharan Africa region reported the highest ASDR at 3.35 per 100,000 (95% UI: 2.19–5.23), closely trailed by Tropical Latin America at 3.16 per 100,000. South Asia continued to register the lowest ASDR at 0.5 per 100,000 (Table 1, Supplementary Table 3). Of all the countries analyzed, Greece experienced the most pronounced surge in mortality cases, demonstrating a 402% increase. In contrast, Ukraine showed the greatest reduction in both death cases and DALYs (Supplementary Fig. 4C, 4D). Tonga, Vanuatu, and Kiribati reported the highest ASDR for BGB in 2021 among all countries. Importantly, each of these countries exhibited a continuous decrease in ASDR from 1990 to 2021 (Fig. 2C, Supplementary Table 7, Supplementary Fig. 2C). For age-standardized DALY rates, Central Latin America recorded the highest value and South Africa the lowest. During the period from 1990 to 2021, Western Sub-Saharan Africa had the greatest increase in age-standardized DALYs for BGB (EAPC: 0.37, 95% CI: 0.29–0.44), whereas South Asia experienced the sharpest decrease (EAPC: –1.71, 95% CI: –1.82 to –1.60) (Table 1, Supplementary Fig. 2D). It is important to highlight that Honduras and Mexico exhibited not only the highest ASPR, but also the highest age-standardized DALYs of BGB, with 242 and 198.2 per 100,000, respectively. India reported the lowest DALYs at 20 per 100,000 population (Fig. 2D, Supplementary Table 8).
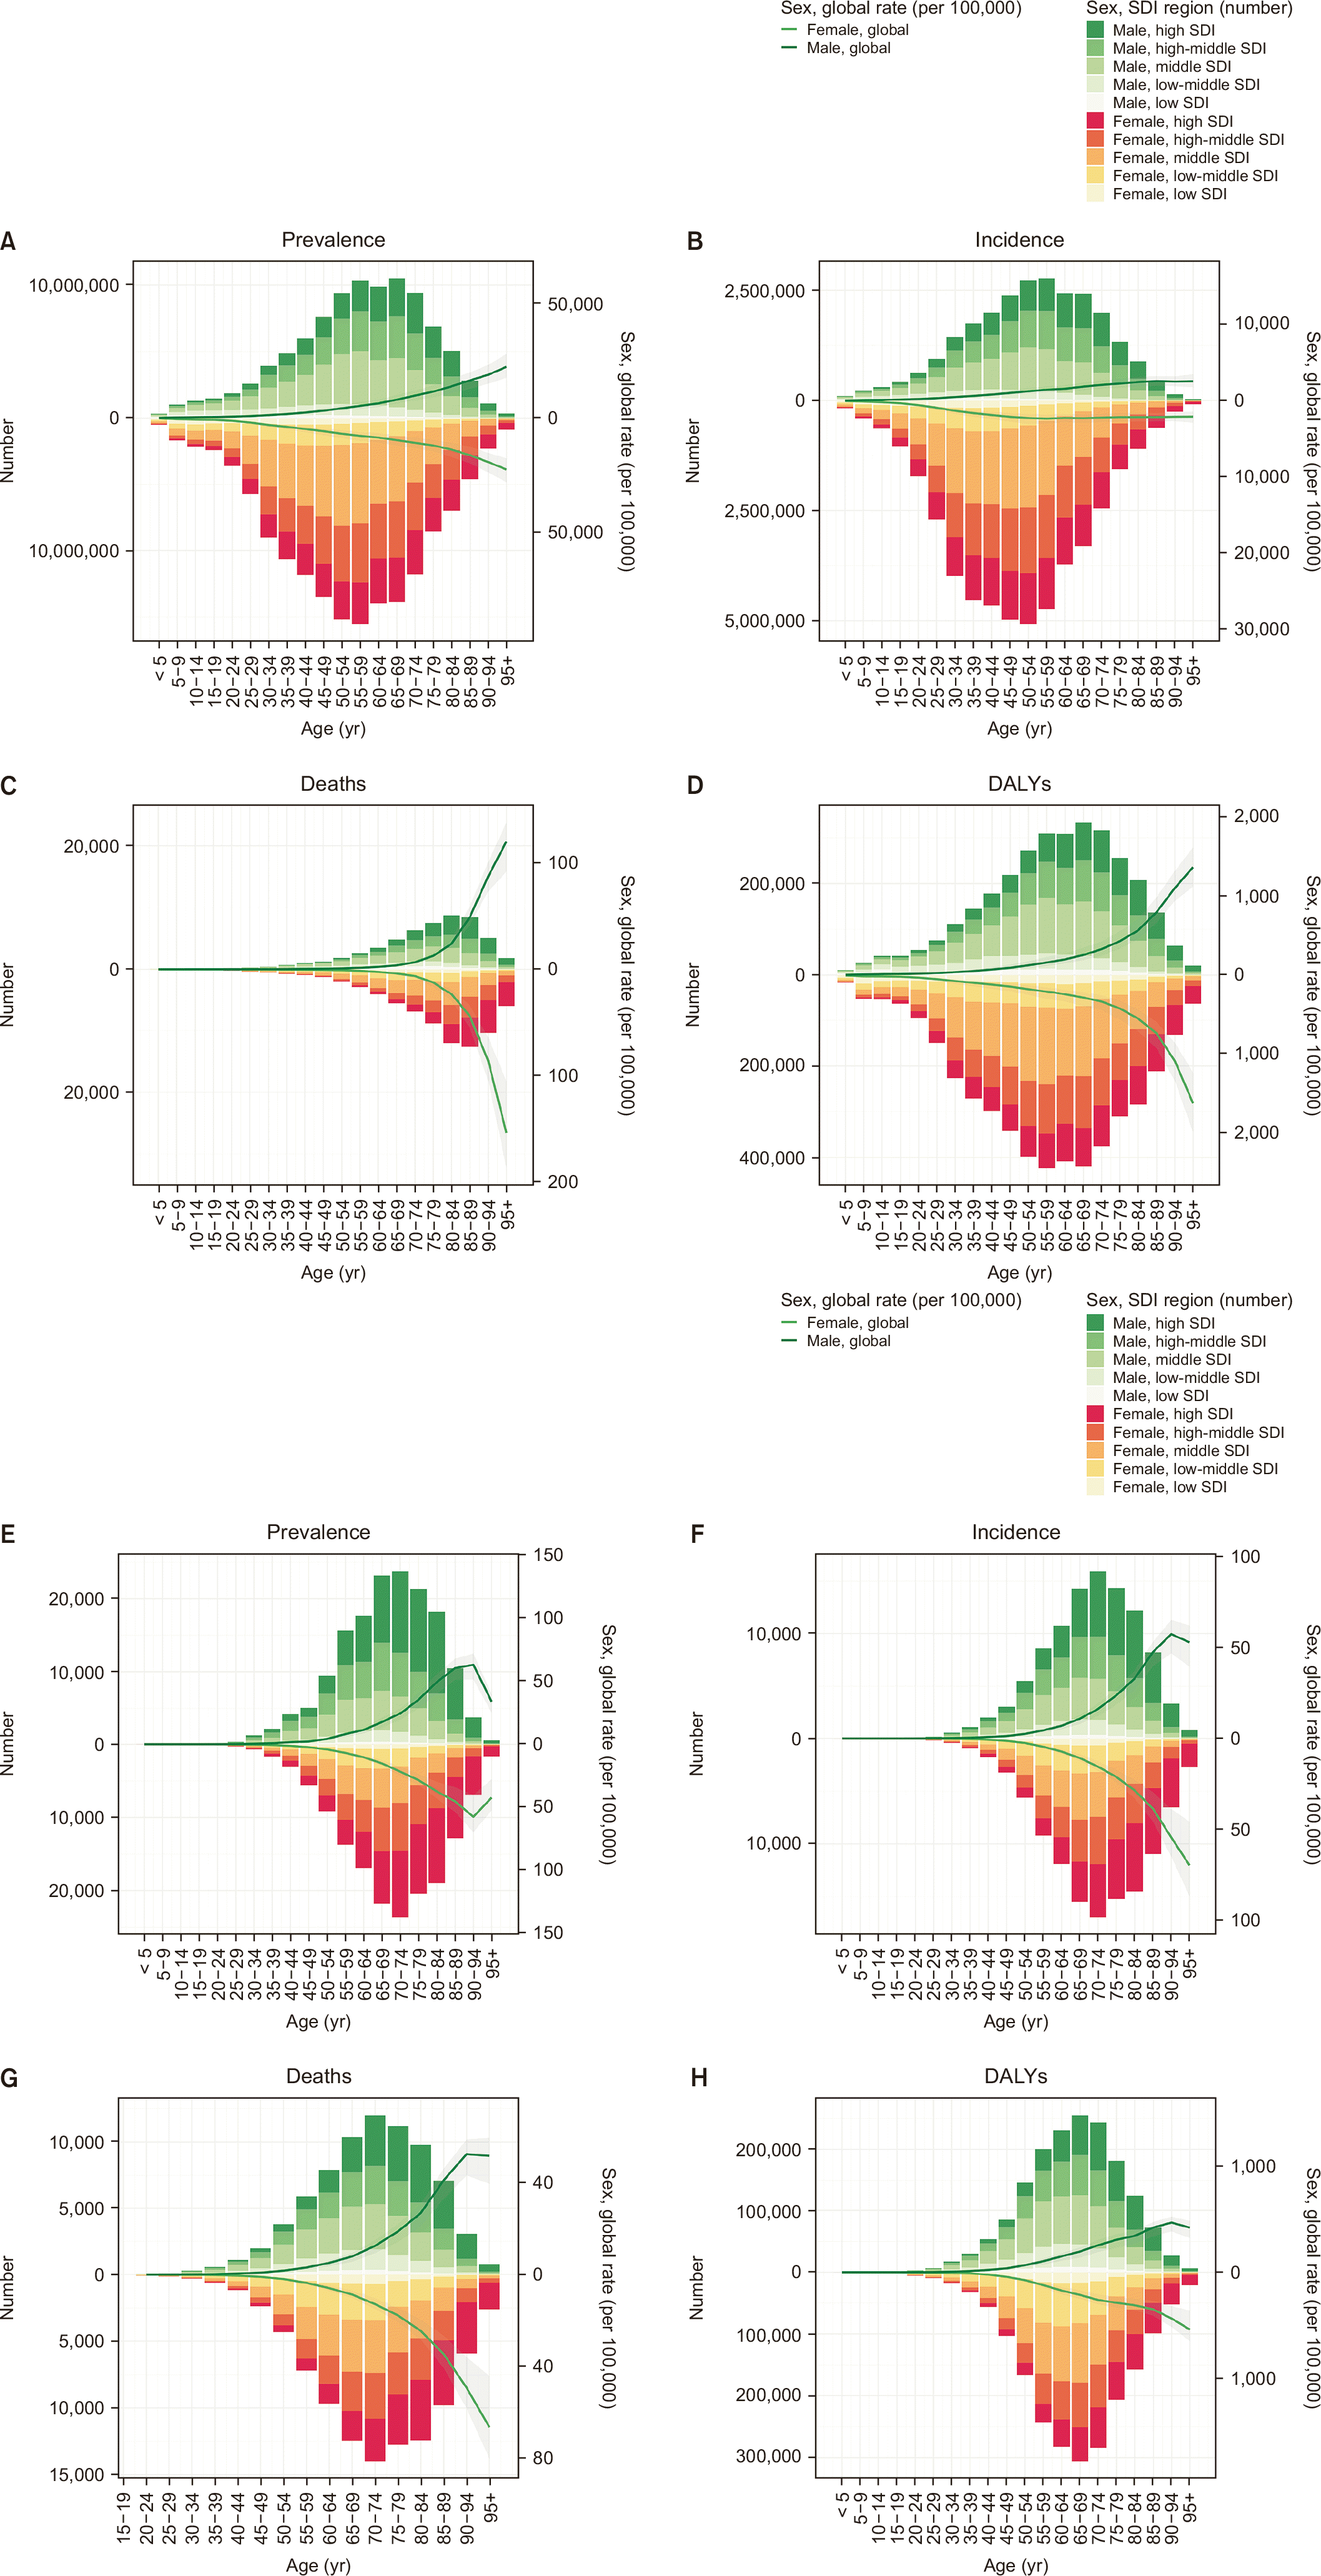
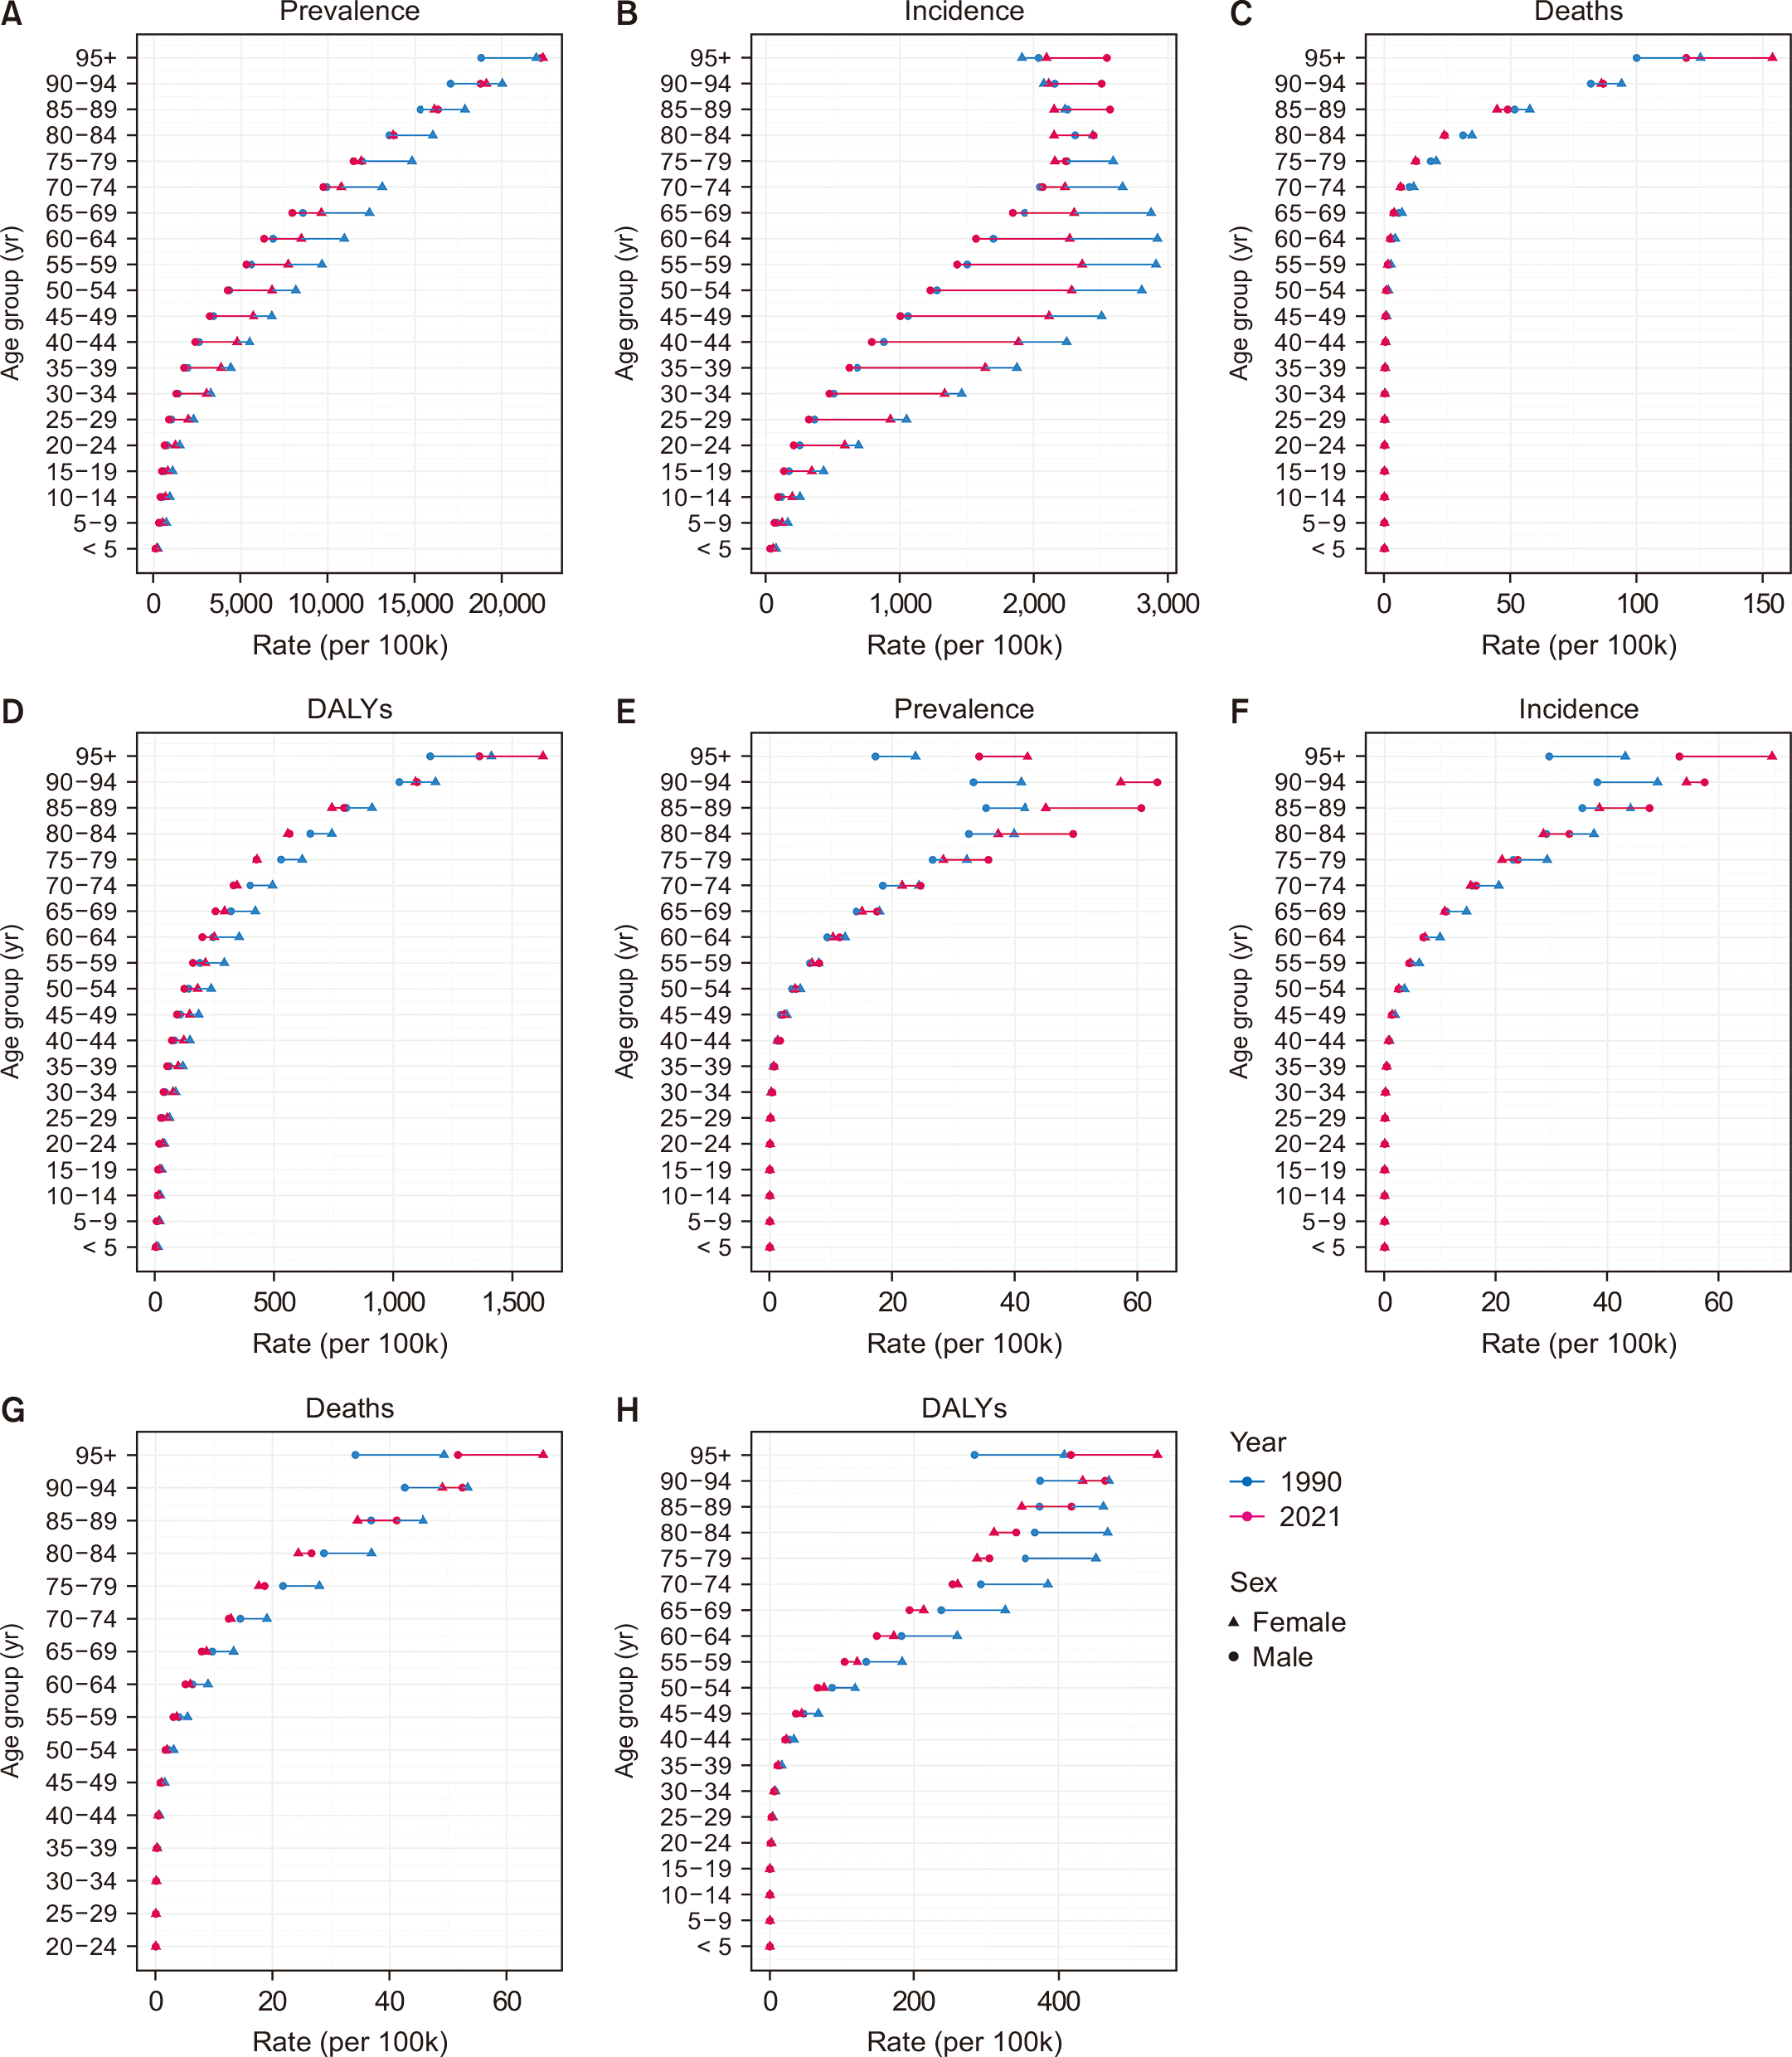
A significant association was identified between the epidemiologic features of BGB and both age and sex. In 2021, the majority of cases were concentrated among those aged 35 to 74 years (Fig. 3A, Fig. 4A, Supplementary Fig. 5A). With respect to sex, among the 20 to 79 year-old population, both prevalence rates and ASDR were found to be substantially higher in female than in male (Fig. 3A, 3C, 4A, 4C). In 2021, the incidence of BGB was primarily reported in individuals aged 25 to 69 (Fig. 3B). Overall, female had a higher ASIR than male across most age groups. However, this trend reversed after the age of 75 years, with male showing a higher ASIR compared to female (Fig. 4B, Supplementary Fig. 5B). The number of BGB-related deaths increased progressively with age (Fig. 3C). The ASDR gradually rose beginning at age 40 years and peaked at 95 years (Fig. 4C, Supplementary Fig. 5C). Likewise, both the mortality count and the ASDR were observed to be higher in female than in male (Fig. 3C, 4C, Supplementary Fig. 5C).
This study collected data on mortality and DALYs attributable to two risk factors for BGB in the GBD 2021: high BMI, and smoking, followed by stratification by region (Supplementary Fig. 6A). On a global scale, high BMI represented the leading cause of increased BGB mortality and DALYs in 2021, followed by smoking as the second most substantial contributor. Specifically, high BMI was responsible for 35.7% of all deaths globally. Among various geographic locations, North Africa and Middle East, high-income North America, and Southern Latin America demonstrated the greatest proportions of deaths from BMI, at 47.2%, 47.1%, and 46.7%, respectively. In contrast, South Asia had the lowest proportion, at 22.2%. Additionally, smoking was an important factor, with the highest rate of 5.4% in East Asia and the lowest of 1.1% in Western Sub-Saharan Africa. The global pattern of BGB DALYs paralleled that of mortality. Worldwide, high BMI remained the principal risk factor, associated with 15.5% of all DALYs.
Malignant neoplasms of the gallbladder and biliary tract
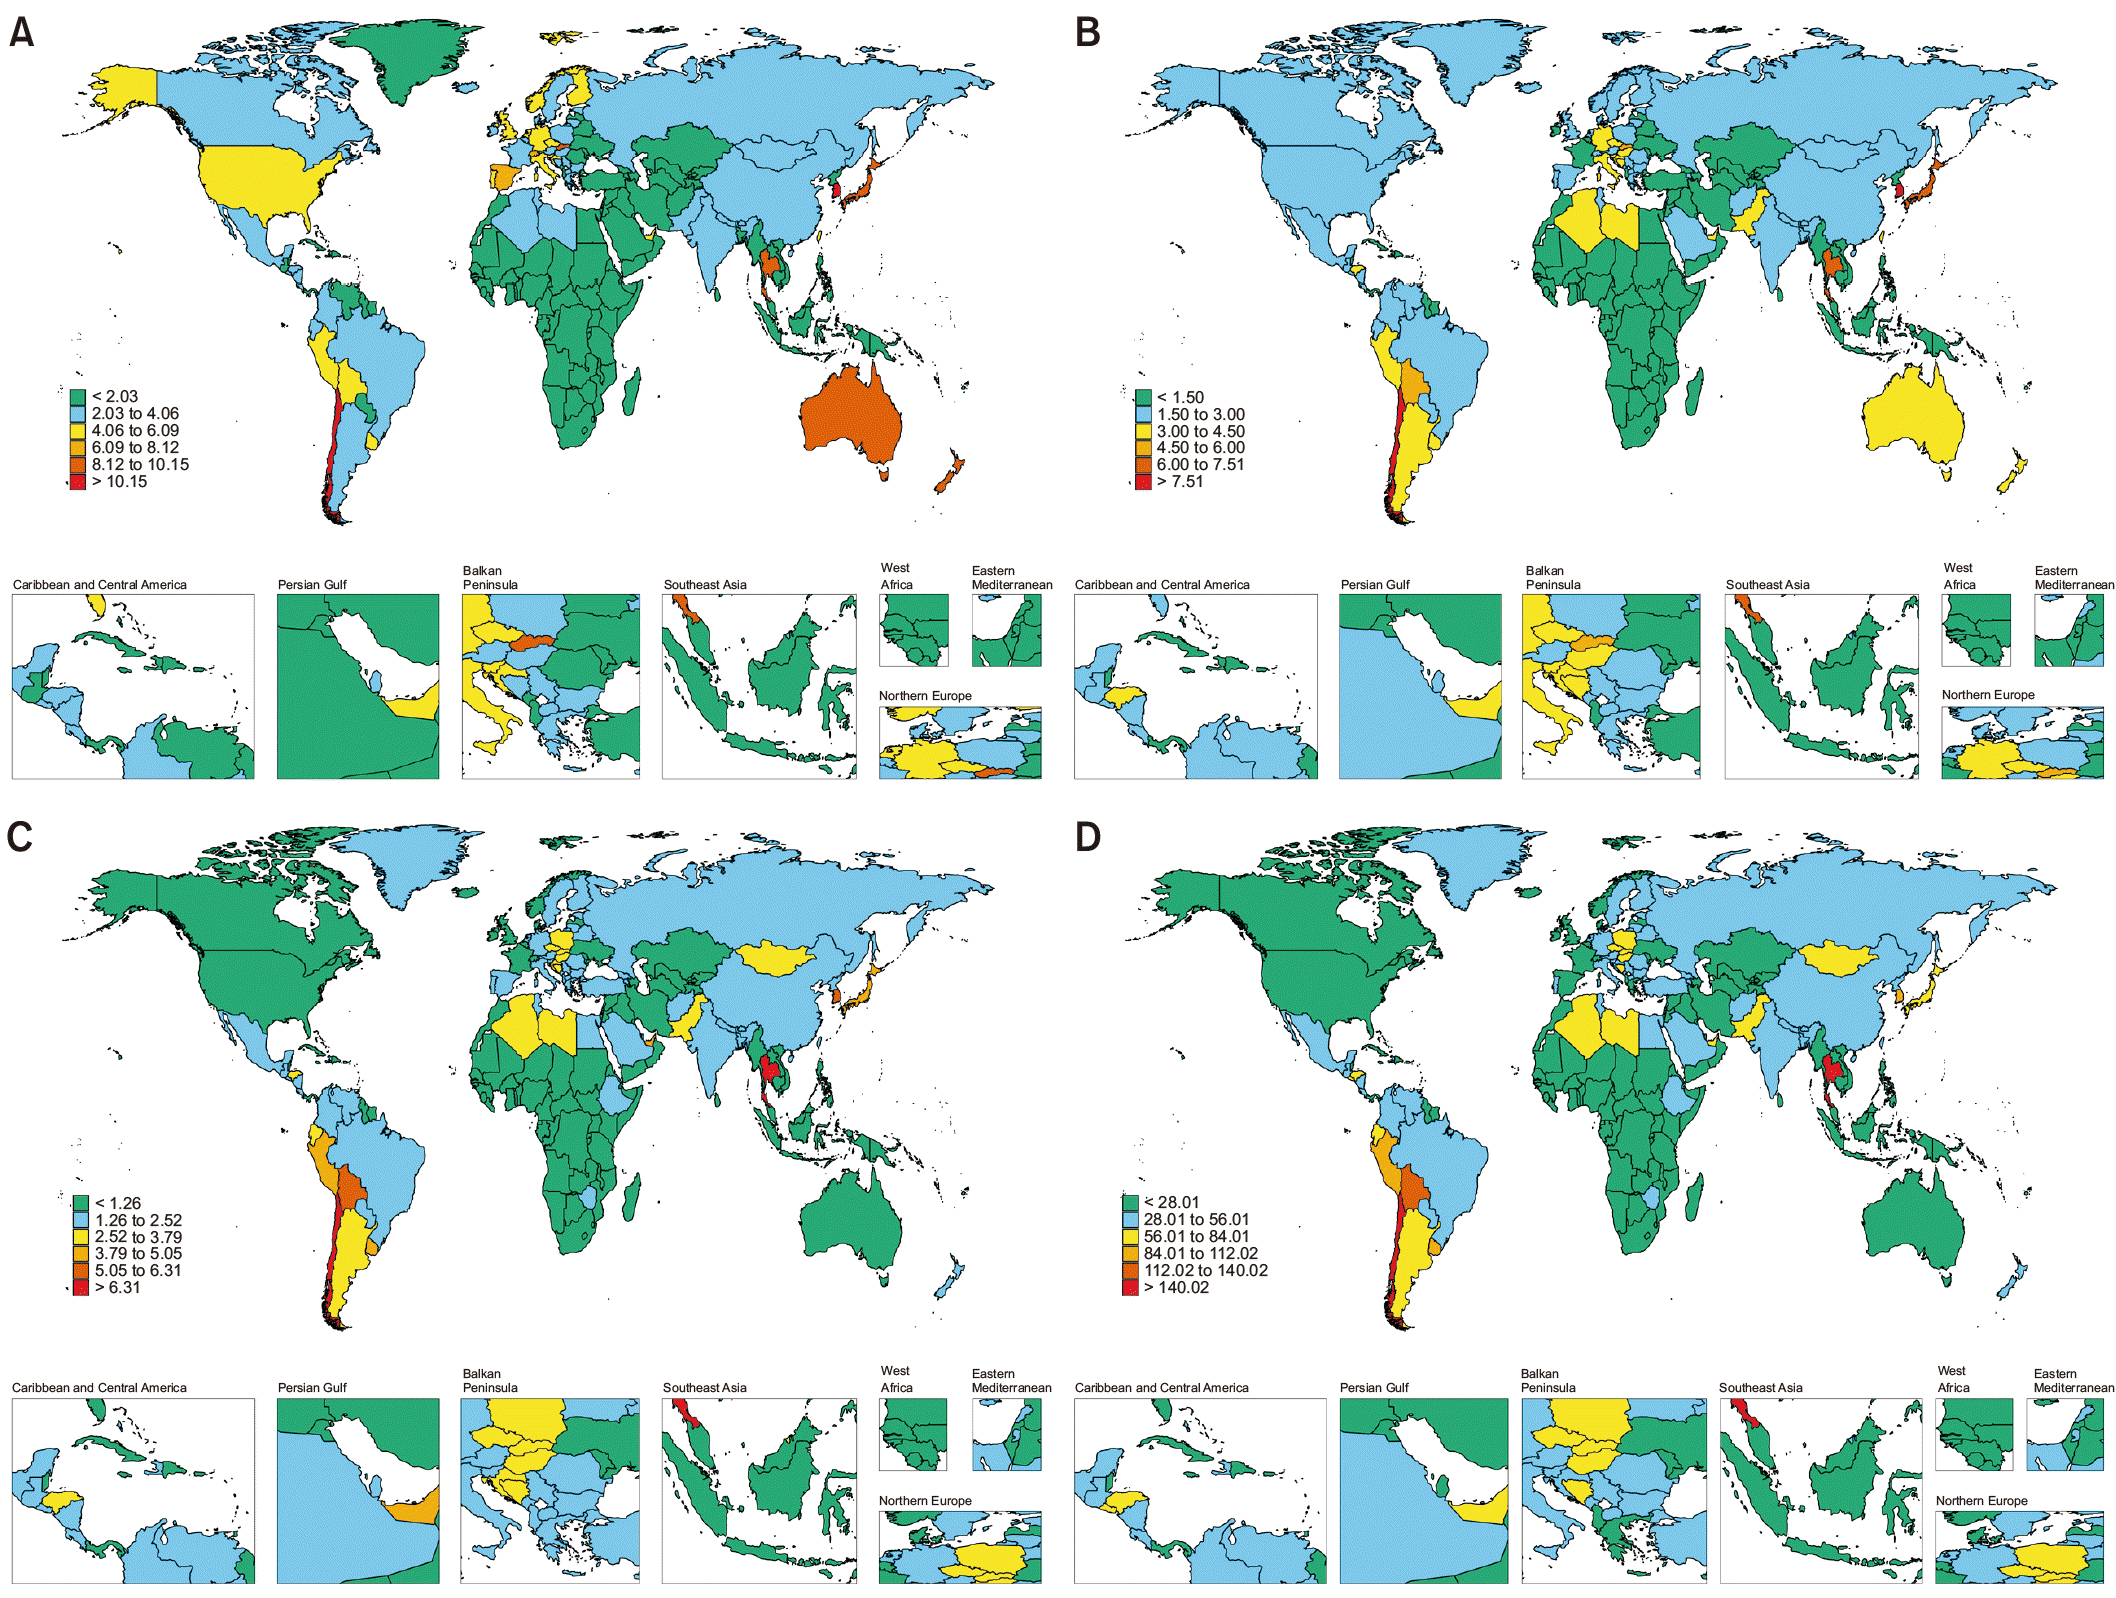
Unlike BGB, the ASPR for MGB has exhibited a modest increase, rising from 3.4 in 1990 to 3.69 per 100,000 individuals in 2021 (Table 1, Supplementary Table 3, 4). The burden of MGB was found to be significantly influenced by SDI levels. With increasing SDI levels, ASPR also increased (Fig. 1B, Supplementary Fig. 7A, 7B). In 2021, ASPR ranged from 1.23 cases per 100,000 (95% UI: 0.85–1.53) in the Low SDI region to 6.19 cases per 100,000 (95% UI: 5.59–6.67) in the high SDI region. Substantial geographical variation in MGB was observed. In 2021, the Republic of Korea reported the highest ASPR (12.18 per 100,000) for MGB, which increased over time (EAPC: 0.8, 95% CI: 0.67–0.92) (Fig. 5A, Supplementary Table 9, Supplementary Fig. 8A). Notably, between 1990 and 2021, nearly half of the 204 countries examined exhibited a rising ASPR. The most significant increase was observed in Cabo Verde, with an EAPC of 0.34 (95% CI: 0.13–0.46) (Supplementary Table 9, Supplementary Fig. 8A).
Regarding incidence, the global number of MGB cases exceeded 216,768.35 in 2021, representing a 101.09% rise compared to 1990. However, the ASIR showed a decline from 2.89 in 1990 to 2.56 per 100,000 in 2021. The EAPC for ASIR was –0.44 (95% CI: –0.48 to –0.41), indicating a consistent decrease in the incidence of MGB. Similarly, as SDI levels increased, ASIR also showed a rising trend (Fig. 1B, Supplementary Fig. 7A, 7B). The ASIR ranged from 1.28 cases per 100,000 (95% UI: 0.88–1.57) in the Low SDI region to 3.5 cases per 100,000 (95% UI: 3.11–3.8) in the high SDI region (Table 1).
Overall, MGB showed a steady decline in mortality and DALYs over the past three decades (Table 1, Supplementary Table 4). This epidemiological trend was similar to that observed with BGB. In 2021, estimates indicate that MGB resulted in 171,961.17 deaths, corresponding to an ASDR of 2.04 per 100,000, with an EAPC of –0.97 (95% CI: –1 to –0.94). Among the SDI categories, the high SDI regions exhibited the highest mortality rate at 1.28 per 100,000, while the low SDI regions recorded the lowest rate (Table 1). The age-standardized DALYs rates were highest in the Low-middle SDI regions, with the lowest observed in low SDI regions (Table 1, Supplementary Table 4, Fig. 1B).
Similarly, the global MGB burden showed substantial variation among the 21 GBD regions. The High-income Asia Pacific region reported the highest ASPR, ASIR, and ASDR values. The Western Sub-Saharan Africa region exhibited the lowest ASPR, ASIR, and ASDR values (Table 1, Supplementary Table 4). However, these two regions experienced distinctly different trends in change from 1990 to 2021. In particular, the high-income Asia Pacific showed a decreasing pattern, whereas Western Sub-Saharan Africa displayed an upward trend (Supplementary Fig. 7C). As of 2021, Southern Latin America had the highest age-standardized DALYs, with a rate of 102.44 per 100,000 (95% UI: 96.35–107.96). In contrast, Western Sub-Saharan Africa had the lowest rate at 1.3 (95% UI: 0.84–1.59) per 100,000, but the region demonstrated a continuous increase in this rate from 1990 to 2021 (EAPC: 0.89, 95% CI: 0.55–1.22) (Table 1, Supplementary Fig. 7D). Moreover, the epidemic trends of MGB differed significantly between the 204 countries included in the study. In 2021, Chile, the Republic of Korea, and Thailand all demonstrated notably high ASIR, ASDR, and age-standardized DALYs. In contrast, the lowest ASIR, ASDR, and age-standardized DALYs for MGB were documented in The Gambia (Fig. 5B–5D). It is important to highlight that Qatar, Iran (Islamic Republic of), Cabo Verde, and the United Arab Emirates experienced the greatest absolute increases in prevalence, incidence, and DALY cases among all countries over the period from 1990 to 2021 (Supplementary Fig. 9A, 9B, 9D). Cabo Verde also recorded the highest EAPC in ASIR (EAPC: 0.35, 95% CI: 0.13–0.46), ASDR (EAPC: 0.37, 95% CI: 0.14–0.5), and age-standardized DALYs (EAPC: 7.46, 95% CI: 2.86–10.06) (Supplementary Table 10–12, Supplementary Fig. 8B–8D). Collectively, these observations underscore that MGB constitutes a significant public-health concern in this area, necessitating increased vigilance. In 2021, details on the country-level distribution of ASIR, ASDR, and DALYs are illustrated in Fig. 3B–3D and Supplementary Table 10–12. Lastly, the correlation analysis identified a positive association between the SDI of countries and territories and their ASPR, ASIR, ASDR, and age-standardized DALYs, implying that higher SDI levels relate to greater burden (Supplementary Fig. 10).
Regarding age and sex, the peak prevalence, incidence, and mortality rates of MGB were observed in individuals aged 70–74 years (Fig. 3E–3G). The age group contributing the largest proportion of DALYs was 65–69 (Fig. 3H). In general, ASPR, ASIR, ASDR, and age-standardized DALYs all demonstrated an increasing trend with advancing age. Unlike the pattern in 1990, male exhibited higher ASPR and ASIR than female in nearly all age groups of MGB patients in 2021, except for those aged 95 years or older (Fig. 4E, 4F, Supplementary Fig. 11A, 11B). In 2021, data revealed that male had greater ASDR and age-standardized DALYs than female among individuals aged 75 to 94 years, while the reverse was true for the remaining age groups (Fig. 4G, 4H, Supplementary Fig. 11C, 11D).
Within GBD 2021, high BMI was identified as a significant risk factor for MGB (Supplementary Fig. 6B). The regional distribution of high BMI’s contribution to deaths and DALYs among MGB patients was consistent across regions. Notably, North Africa and Middle East, high-income North America, and Southern Latin America exhibited higher death and DALY rates attributable to high BMI, while the lowest rates were noted in the Low SDI regions. Relevant details can be found in Supplementary Fig. 6B.
Projections for the future global disease burden
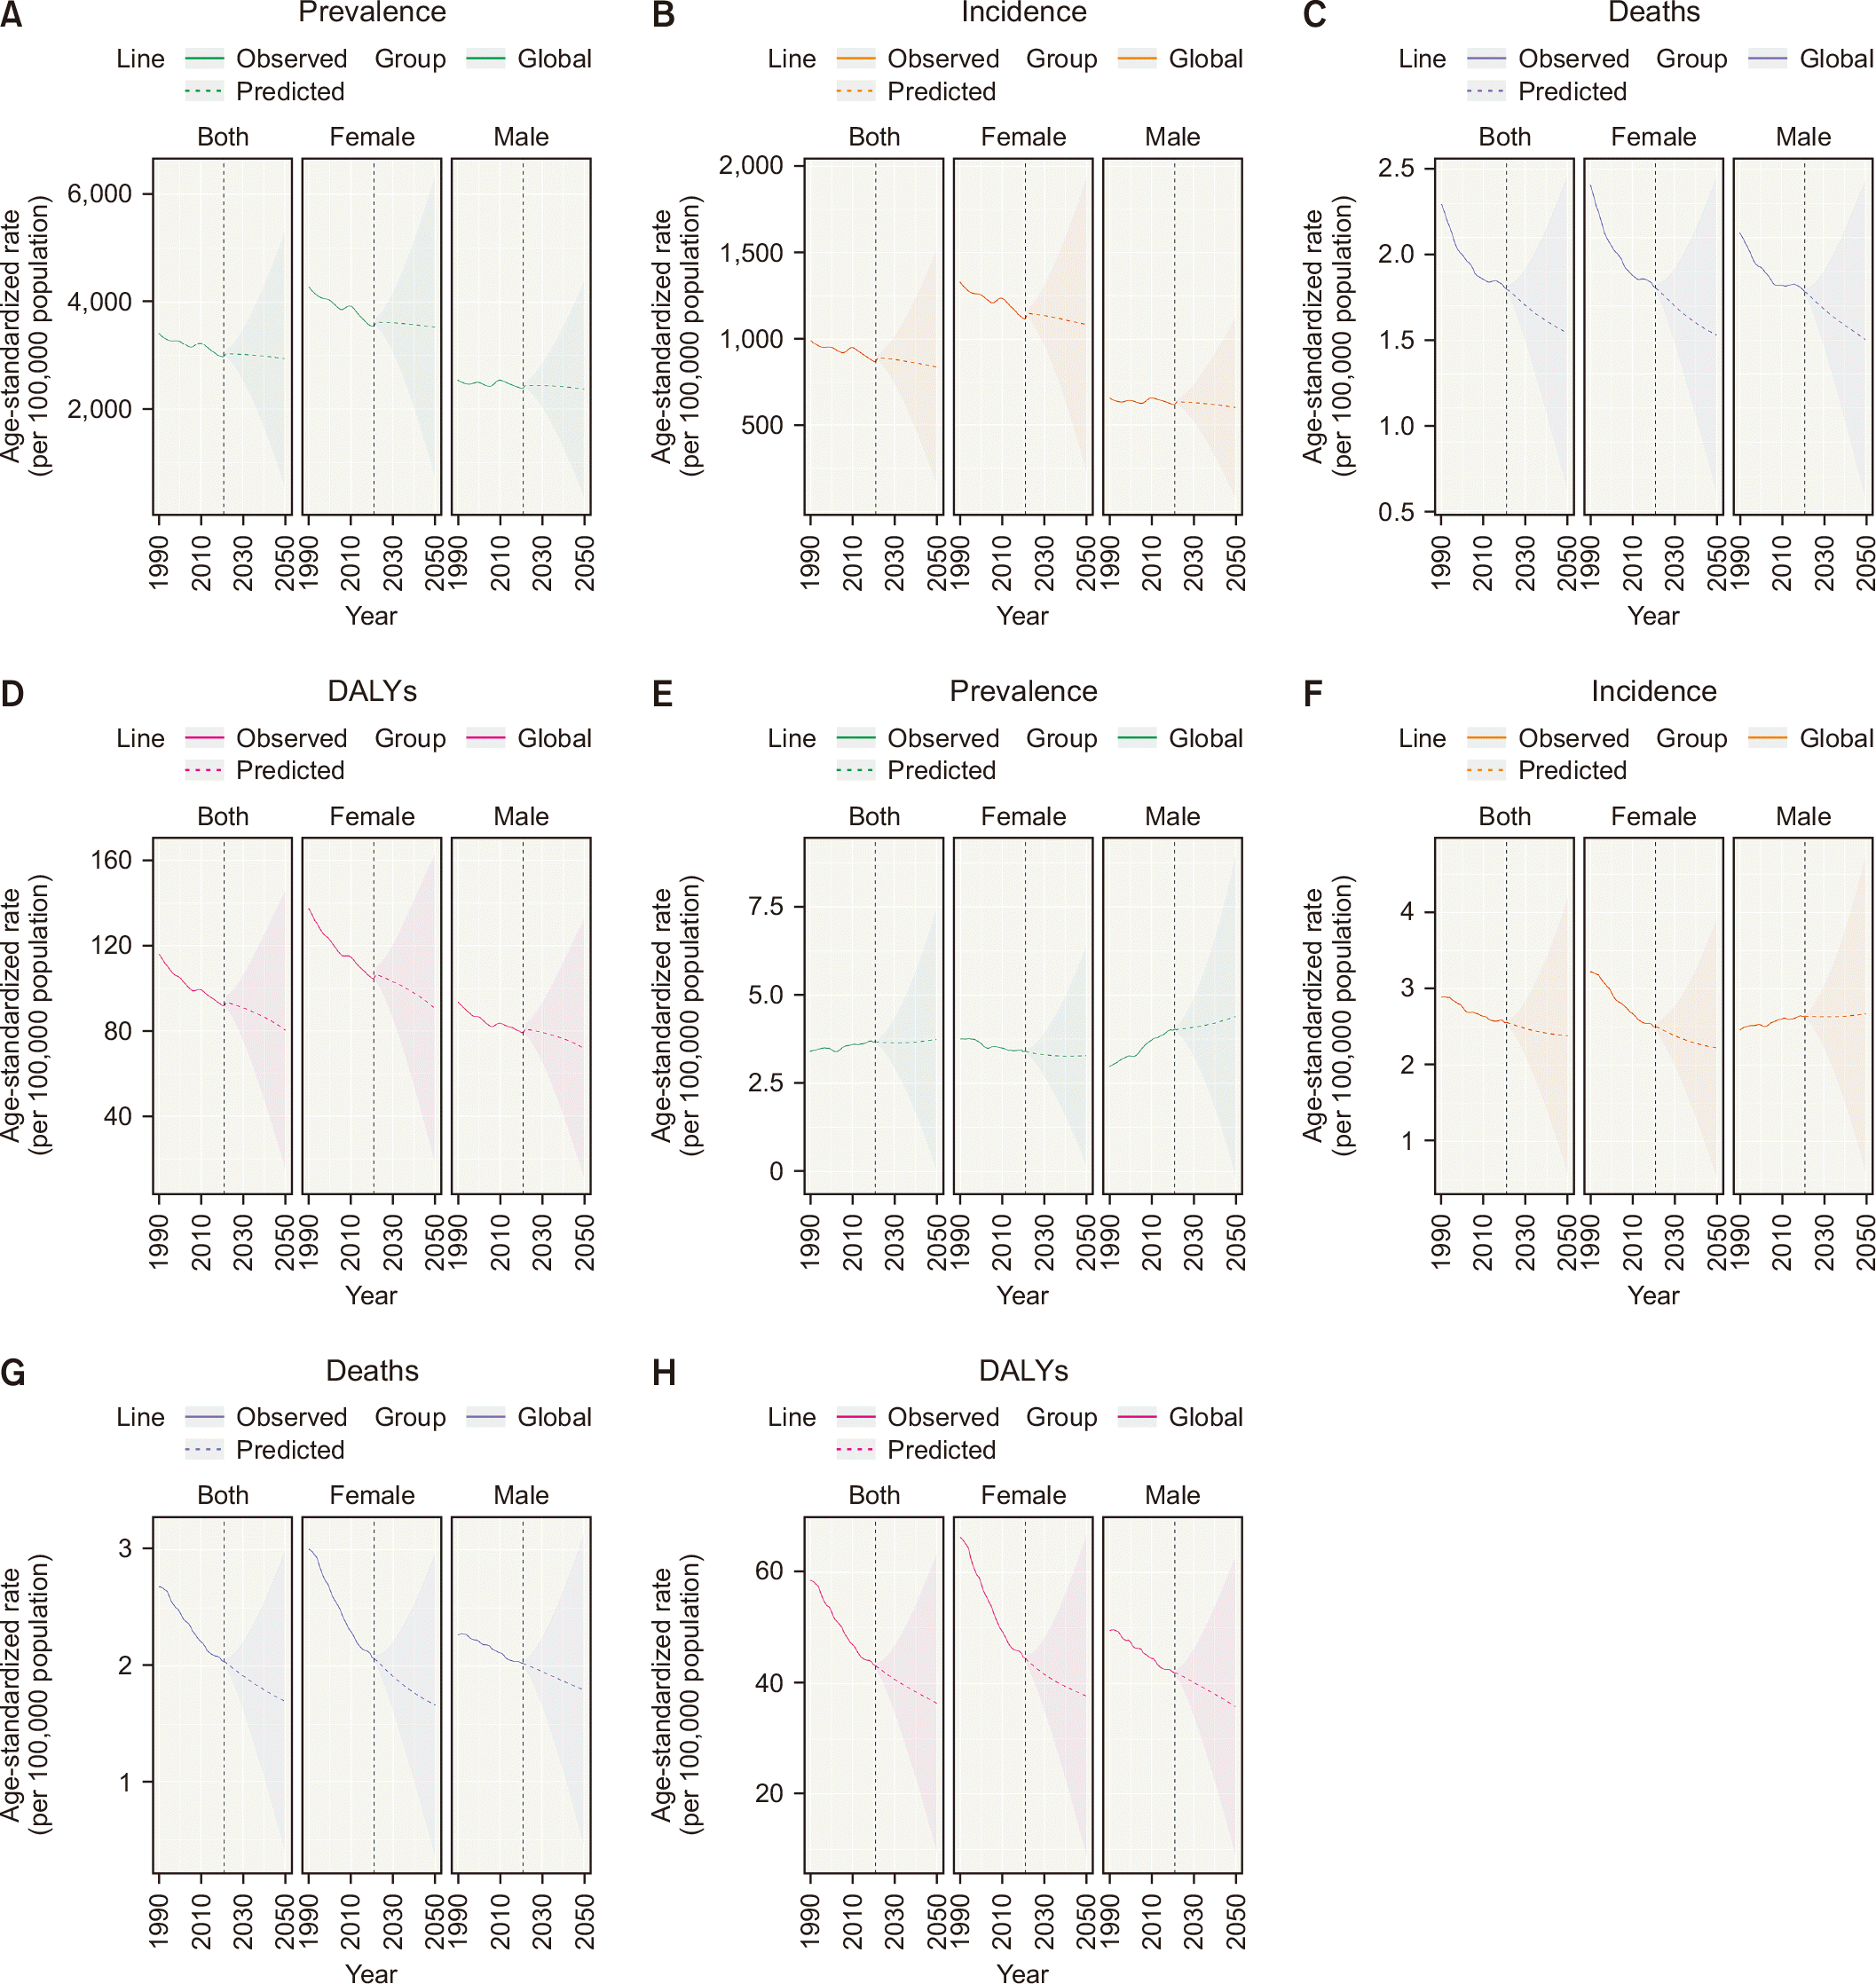
From 2022 to 2050, the global burden of BGB is predicted to decline to varying extents. ASPR for BGB is expected to gradually decrease from roughly 2,966.98 per 100,000 in 2021 to about 2,931.79 per 100,000 by 2050, marking an approximate 1.19% reduction over thirty years (Fig. 6A). Similarly, ASIR is projected to drop from nearly 865.51 per 100,000 in 2021 to approximately 836.07 per 100,000 by 2050. The decrease in ASIR is anticipated to be more pronounced among female compared to male (Fig. 6B).
The global burden of MGB is anticipated to exhibit varying trajectories between 2022 and 2050. The ASPR is projected to rise modestly, from around 3.68 per 100,000 in 2021 to about 3.74 per 100,000 in 2050, with this increase being more notable in male (Fig. 6E). Conversely, ASIR is expected to show a mild decline—remaining mostly unchanged for male but decreasing among female—dropping from roughly 2.56 per 100,000 in 2021 to approximately 2.38 per 100,000 by 2050 (Fig. 6F).
DISCUSSION
This study presents a detailed and methodical evaluation of global gallbladder and biliary disease patterns, utilizing the most recent publicly accessible data from the GBD 2021 study. Our findings demonstrate significant variations in the prevalence of these diseases based on geographic region, socioeconomic status, age, and sex. By highlighting these patterns, this study has two central objectives: firstly, to support clinicians in various regions in recognizing populations at higher risk and interpreting the epidemiological trajectories of gallbladder and bile duct diseases; and secondly, to provide strong evidence to enable policymakers in different areas to devise and implement appropriate healthcare strategies.
Overall, worldwide, ASPR, ASIR, ASDR, and age-standardized DALYs for BGB have decreased between 1990 and 2021. The ASPR of BGB is anticipated to decline by about 1.19% over the next 30 years. The reduction in ASIR is greater in female relative to male. This observation suggests that the health sector might consider adjusting medical resource allocation for benign gallbladder disease, especially in low-income regions with restricted healthcare capacity. In contrast to BGB, on a global scale, MGB’s ASPR has generally exhibited a fluctuating upward trend over the last 32 years. While both ASIR and ASDR for MGB have largely decreased, we observe that these rates have experienced a slight upward trend since 2020. This may indicate that clinicians, especially in high-prevalence areas such as the Republic of Korea and Thailand, should strengthen early intervention efforts for individuals at risk of MGB (e.g., patients with elevated BMI, gallbladder stones, or biliary tract infections) [5,21]. Simultaneously, local policymakers are advised to amplify educational initiatives regarding these diseases and improve physician training, aiming to restrain this increasing trend.
Higher SDI levels correlated with higher ASPR and ASIR of BGB. This indicates that the burden of BGB differs depending on the country’s economic status [22]. This association may be explained by the influence of obesity, which is recognized as a significant contributor to the development of BGB [23]. In contrast, the ASDR showed an inverse association with SDI, likely reflecting the superior healthcare systems generally available in countries with a high SDI, including timely diagnostic measures and cholecystectomy [22]. Likewise, the burden of MGB varies by region, ethnicity, and SDI level [24]. The High-income Asia Pacific region demonstrated the highest ASPR, ASIR, and ASDR, such as in the Republic of Korea. However, the overall incidence of MGB in the Republic of Korea is declining. This downward trend may be partly due to the expanded use of laparoscopic cholecystectomy, contributing to a reduced incidence of gallbladder cancer. Another plausible contributing factor is the reduced prevalence of Clonorchis sinensis infection and hepatitis B, each being significant risk factors for biliary tract cancers [25].
Additionally, the study demonstrated that in 2021, Chile continued to exhibit a high ASIR for MGB. Key contributors to the substantial MGB burden in this region are poverty, insufficient diagnostic infrastructure, and the significant prevalence of gallstones [21]. Given that both larger gallstones and prolonged disease duration are closely linked to an elevated risk of gallbladder cancer, interventions aimed at reducing gallstone prevalence may be effective in decreasing the regional burden of gallbladder cancer [26]. In this context, targeting obesity is particularly relevant due to its established association with both gallstones and gallbladder cancer [27,28]. Furthermore, more active consideration of cholecystectomy may represent an additional approach to decreasing the incidence of gallbladder cancer, particularly in female with high BMI who have gallstones. Reports indicate that, over recent decades, some countries have succeeded in lowering the rates of gallbladder cancer incidence and mortality by increasing the frequency of laparoscopic cholecystectomy [29]. Achieving this requires not only greater governmental investment in laparoscopic cholecystectomy but also enhanced surgical training initiatives. Nevertheless, there is evidence suggesting that patients may develop intrahepatic biliary strictures after cholecystectomy, which can subsequently elevate the risk for intrahepatic gallstones or intrahepatic bile duct cancer [30]. Therefore, optimizing strategies to reduce the overall burden of MGB necessitates careful consideration and balancing of these multiple factors.
There is a significant association between gallbladder and bile duct disease with both age and sex. The analysis indicated that, in 2021, the highest number of BGB cases was observed in patients aged 55 to 59 years. Additionally, the burden of gallbladder cancer increases with advancing age, and female represent the primary affected demographic [31]. About two-thirds of patients diagnosed with gallbladder cancer are over 65 years of age, with a mean age of 72 years [32]. This finding aligns with our observations that individuals aged 70 to 74 years exhibited the highest prevalence, incidence, and mortality rates for MGB. Regarding sex, the influence of estrogen and progesterone is linked to gallstone formation, which contributes to the higher prevalence observed in female. Furthermore, the results showed that, in 2021, female with BGB generally had a higher ASIR than male. After the age of 75, however, the trend shifted, with male exhibiting higher rates. This shift may be explained by age-related declines in hormone levels. Due to the lack of detailed MGB stratification in the GBD dataset, our analysis demonstrated a higher MGB burden among male than female. Meanwhile, the incidence of gallbladder cancer remained higher in female, especially among those aged 65 years and above [33]. In contrast, the burden of cholangiocarcinoma was generally found to be greater among male [34].
Risk factors identified for BGB are high BMI and smoking, whereas high BMI also emerged as a significant risk factor for MGB. High BMI is recognized as a key risk factor for gallstone disease and cholecystitis [23,35,36]. Therefore, targeted preventive measures should be directed at these populations, including promoting participation in physical exercise and advocating a Mediterranean diet [22]. Additionally, evidence indicates an association between smoking and the onset of gallstones [37]. The reduction in BGB prevalence observed over the past 30 years may be partly due to decreased tobacco use [38]. Furthermore, elevated BMI has been established as an important risk factor linked to MGB [39]. A large cohort study found that individuals with higher BMI displayed substantially greater relative risk of gallbladder cancer [40]. Studies have shown that obesity can induce insulin resistance and hormonal disturbances, which may ultimately contribute to the development of biliary tract cancer [40]. Over the past 30 years, the worldwide prevalence of high BMI among individuals aged ≥ 20 years has risen substantially [41]. Despite the association between high BMI and gallbladder as well as biliary tract diseases and the increasing trend in BMI, a progressive decline in the incidence of these diseases has been noted internationally. This pattern suggests that disease occurrence results from multiple interacting factors, including geography, sex, genetic background, and socioeconomic status [31]. These observations underscore the importance of multifaceted interventions by surgeons and policymakers to further alleviate the burden of these diseases.
As with other sources of public data, GBD data is subject to several limitations. Firstly, both the quality and quantity of raw data available differ markedly across countries and regions. Secondly, the GBD data does not provide a detailed separation between gallbladder and biliary tract cancer epidemiology. Multiple studies indicate that these conditions have distinct epidemiological characteristics [42]. Additionally, for certain GBD indicators, the estimation process involved assumptions and modeling methods, which may introduce uncertainty to the resulting data.
In summary, during the past 30 years, the overall disease burden of BGB has demonstrated a decreasing trend. Projections suggest that the burden of BGB will continue to decline over the next 30 years. Higher SDI levels are correlated with increased ASPR and ASIR of BGB. In contrast, MGB prevalence has continued to rise for more than 30 years. Asian populations generally show a higher prevalence of MGB than other groups. Future efforts should focus on standardized prevention and treatment of BGB, as well as early identification of MGB, by both researchers and policymakers.
SUPPLEMENTARY DATA
Supplementary data related to this article can be found at https://doi.org/10.14701/ahbps.25-142.
 XML Download