



 PDF
 Citation
 Print


Introduction
Radiolysis provides a powerful framework for determining the mechanisms by which radiation interacts with matter, including biological systems. Over the past several decades, Monte Carlo track-structure (MCTS) simulations have played a central role in this field, with progress accelerating recently owing to advances in computational efficiency. Various simulation toolkits such as Geant4-DNA [1-5], PARTRAC [6], TRAX-CHEM [7], RITRACKS [8], NASIC [9], and TOPAS-nBio [10] have been developed by researchers to model physicochemical processes following radiation exposure and, in some cases, to quantify the resulting biological damage. Of these, Geant4-DNA has emerged as a widely adopted open-source toolkit, providing full access to its source code and physics models, along with a high degree of extensibility that supports its continued development and application. Moreover, Geant4-DNA provides three distinct models for simulating the chemical stage, allowing users to select the best approach.
For the Monte Carlo simulations, reducing the size of the target of interest often results in reduced computational costs. This is particularly relevant for MCTS, where the target of interest is frequently at the submicrometer scale. To accurately analyze the radiation behavior within such small domains, an appropriate spatial scale must be selected. Recent studies—such as those involving ultrahigh dose rate irradiation—require considerably high computational resources for simulation [11]. Furthermore, although minimizing the target volume reduces the computational burden, it may also compromise the reliability and physical validity of the resulting chemical yield estimates.
This study aimed to investigate the effect of varying the size of the target volume on chemical yields across different computational models. In addition, it provides a reference for selecting the simulation parameters in the initial stage of MCTS-based modeling.
Materials and Methods
1. Simulation based on the “UHDR” example in Geant4-DNA
Geant4-DNA comprises three chemical-stage calculation models: the step-by-step (SBS) method, independent reaction time (IRT) method [12], and SBS–reaction–diffusion master equation (RDME) models [13]. In the present study, the Geant4-DNA example application “UHDR” was used as the simulation framework for assessing the three calculation models. Although the original “UHDR” example was implemented based on the SBS–RDME model, it was modified to enable simulations using the other two models. In particular, the IRT calculations were implemented by modifying the ConstructTimeStepModel method of the EmDNAChemistry class, while the SBS-based simulations were implemented by modifying the TimeStepAction class to prevent the initiation of compartment-based calculations. Furthermore, the chemistry simulations were performed within the region of interest, with the volume and world sizes set to be identical.
2. Volume-dependent chemical yields
In the Geant4-DNA example applications, the SBS and IRT methods are often implemented in quasi-infinite geometries, wherein the chemical yields are calculated only within a specific energy range using the PrimaryKiller class. It should be noted that the “UHDR” example performs simulations within a finite geometry. The particles that travel beyond the boundaries of the defined volume are terminated, and no restrictions on the energy range are considered for calculating the chemical yields. The simulation geometry comprises a cubic water phantom with side lengths ranging from 3.2 to 102.4 μm. A planar 1-MeV monoenergetic electron beam was incident perpendicularly on one face of the water phantom. Moreover, G4EmDNAphysics_option2 was used as the physics constructor, and G4EmDNAChemistry_option1 was used as the chemistry constructor. Table 1 summarizes the reactions used in this study. The chemical stage was simulated using the SBS and IRT methods. The yields of H3O+, •OH, H2, e−aq, •H, and H2O2 were evaluated up to 1 µs. After the simulation, the chemical yields were plotted as the time evolution of the G values. The G value was defined as the number of chemical species produced or eliminated per 100 eV of energy deposited in the medium. The number of histories was adjusted based on volume, ranging from 2,560 for the smallest volume to 640 for the largest.
3. Volume-dependent chemical yield with an intertrack effect
The “UHDR” example also allows for simulating the intertrack effects. In this mode, the radiative particles are sequentially irradiated until the dose deposited in the volume of interest reaches a predefined dose threshold (Dth) of 0.5–10.0 Gy. The accumulated tracks within the volume are then concurrently processed in the chemical stage, which allows the modeling of the intertrack interactions. The simulation setup remained consistent with that described in Section 2.2, in which a planar 1-MeV electron beam was incident perpendicularly on one face of a cubic water phantom. Moreover, the simulations were performed for cubic volumes with side lengths of 2.4, 3.2, and 4.0 μm. In practice, intertrack simulations are typically confined to micrometer-scale volumes due to the computational demands associated with memory and processing time. The simulations were performed up to 1 μs using an Intel Xeon Gold 6448H processor (Intel Corporation) with a maximum memory capacity of 256 GB. The number of histories was fixed at 64, which ensured statistical uncertainties of <1% for most data points. For small volumes and low Dth values, the uncertainties were <3%. The chemical yields were assessed at various Dth levels and volumes using the same chemical species as previously described.
Results
1. Volume-dependent chemical yields
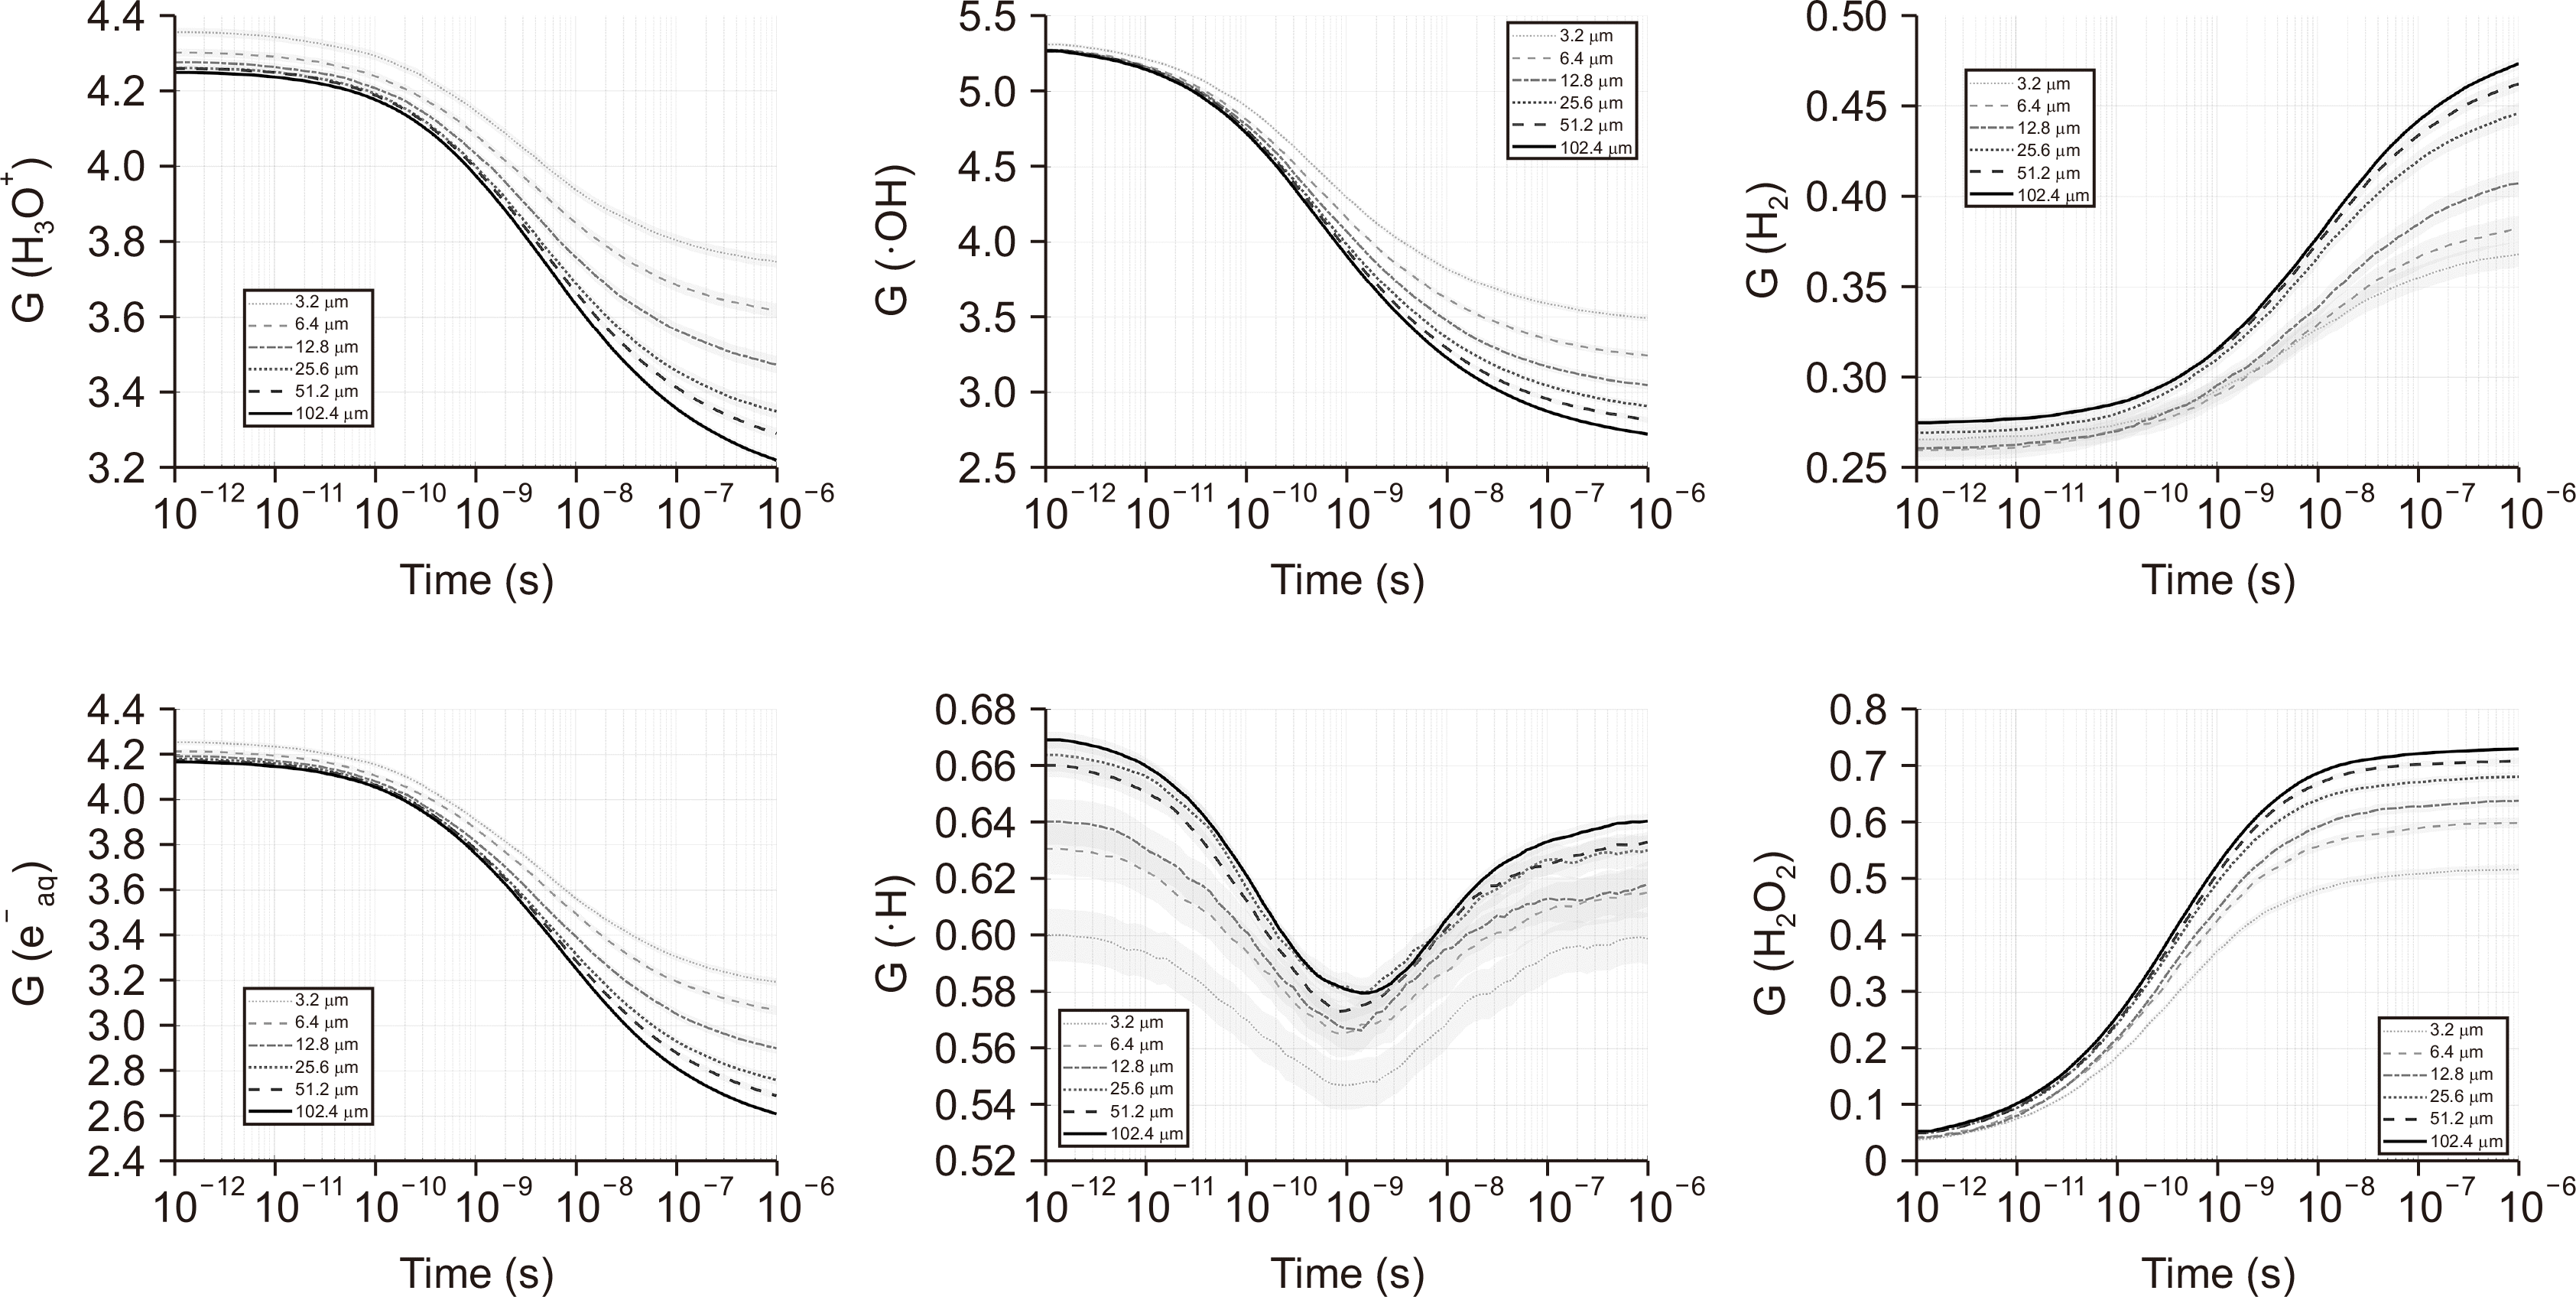
Fig. 1 shows the time evolution of the chemical yields that were calculated using the IRT method for different irradiated volumes. As the simulation volume increased, the initial chemical yields of H3O+, •OH, and e−aq decreased while those of H2, •H, and H2O2 increased. At 1 µs, when comparing the cubic volumes with side lengths of 3.2 and 102.4 µm, the yields of H3O+, •OH, and e−aq decreased by 16.4%, 28.2%, and 22.4%, respectively, whereas the yields of H2, •H, and H2O2 increased by 22.2%, 6.5%, and 29.2%, respectively. Moreover, the relative change was measured as (value at 3.2 µm−value at 102.4 µm) divided by the value at 102.4 µm. This trend arises from low-energy secondary electrons, which have a higher stopping power and generate more chemical species per unit track length. This improves the probability of recombination among chemical species. Based on the reactions listed in Table 1 (R1–R9), species such as H3O+, e−aq, and •OH decreased in yield, while H2, H2O2, and H• increased, which explains the yield patterns observed in Fig. 1.
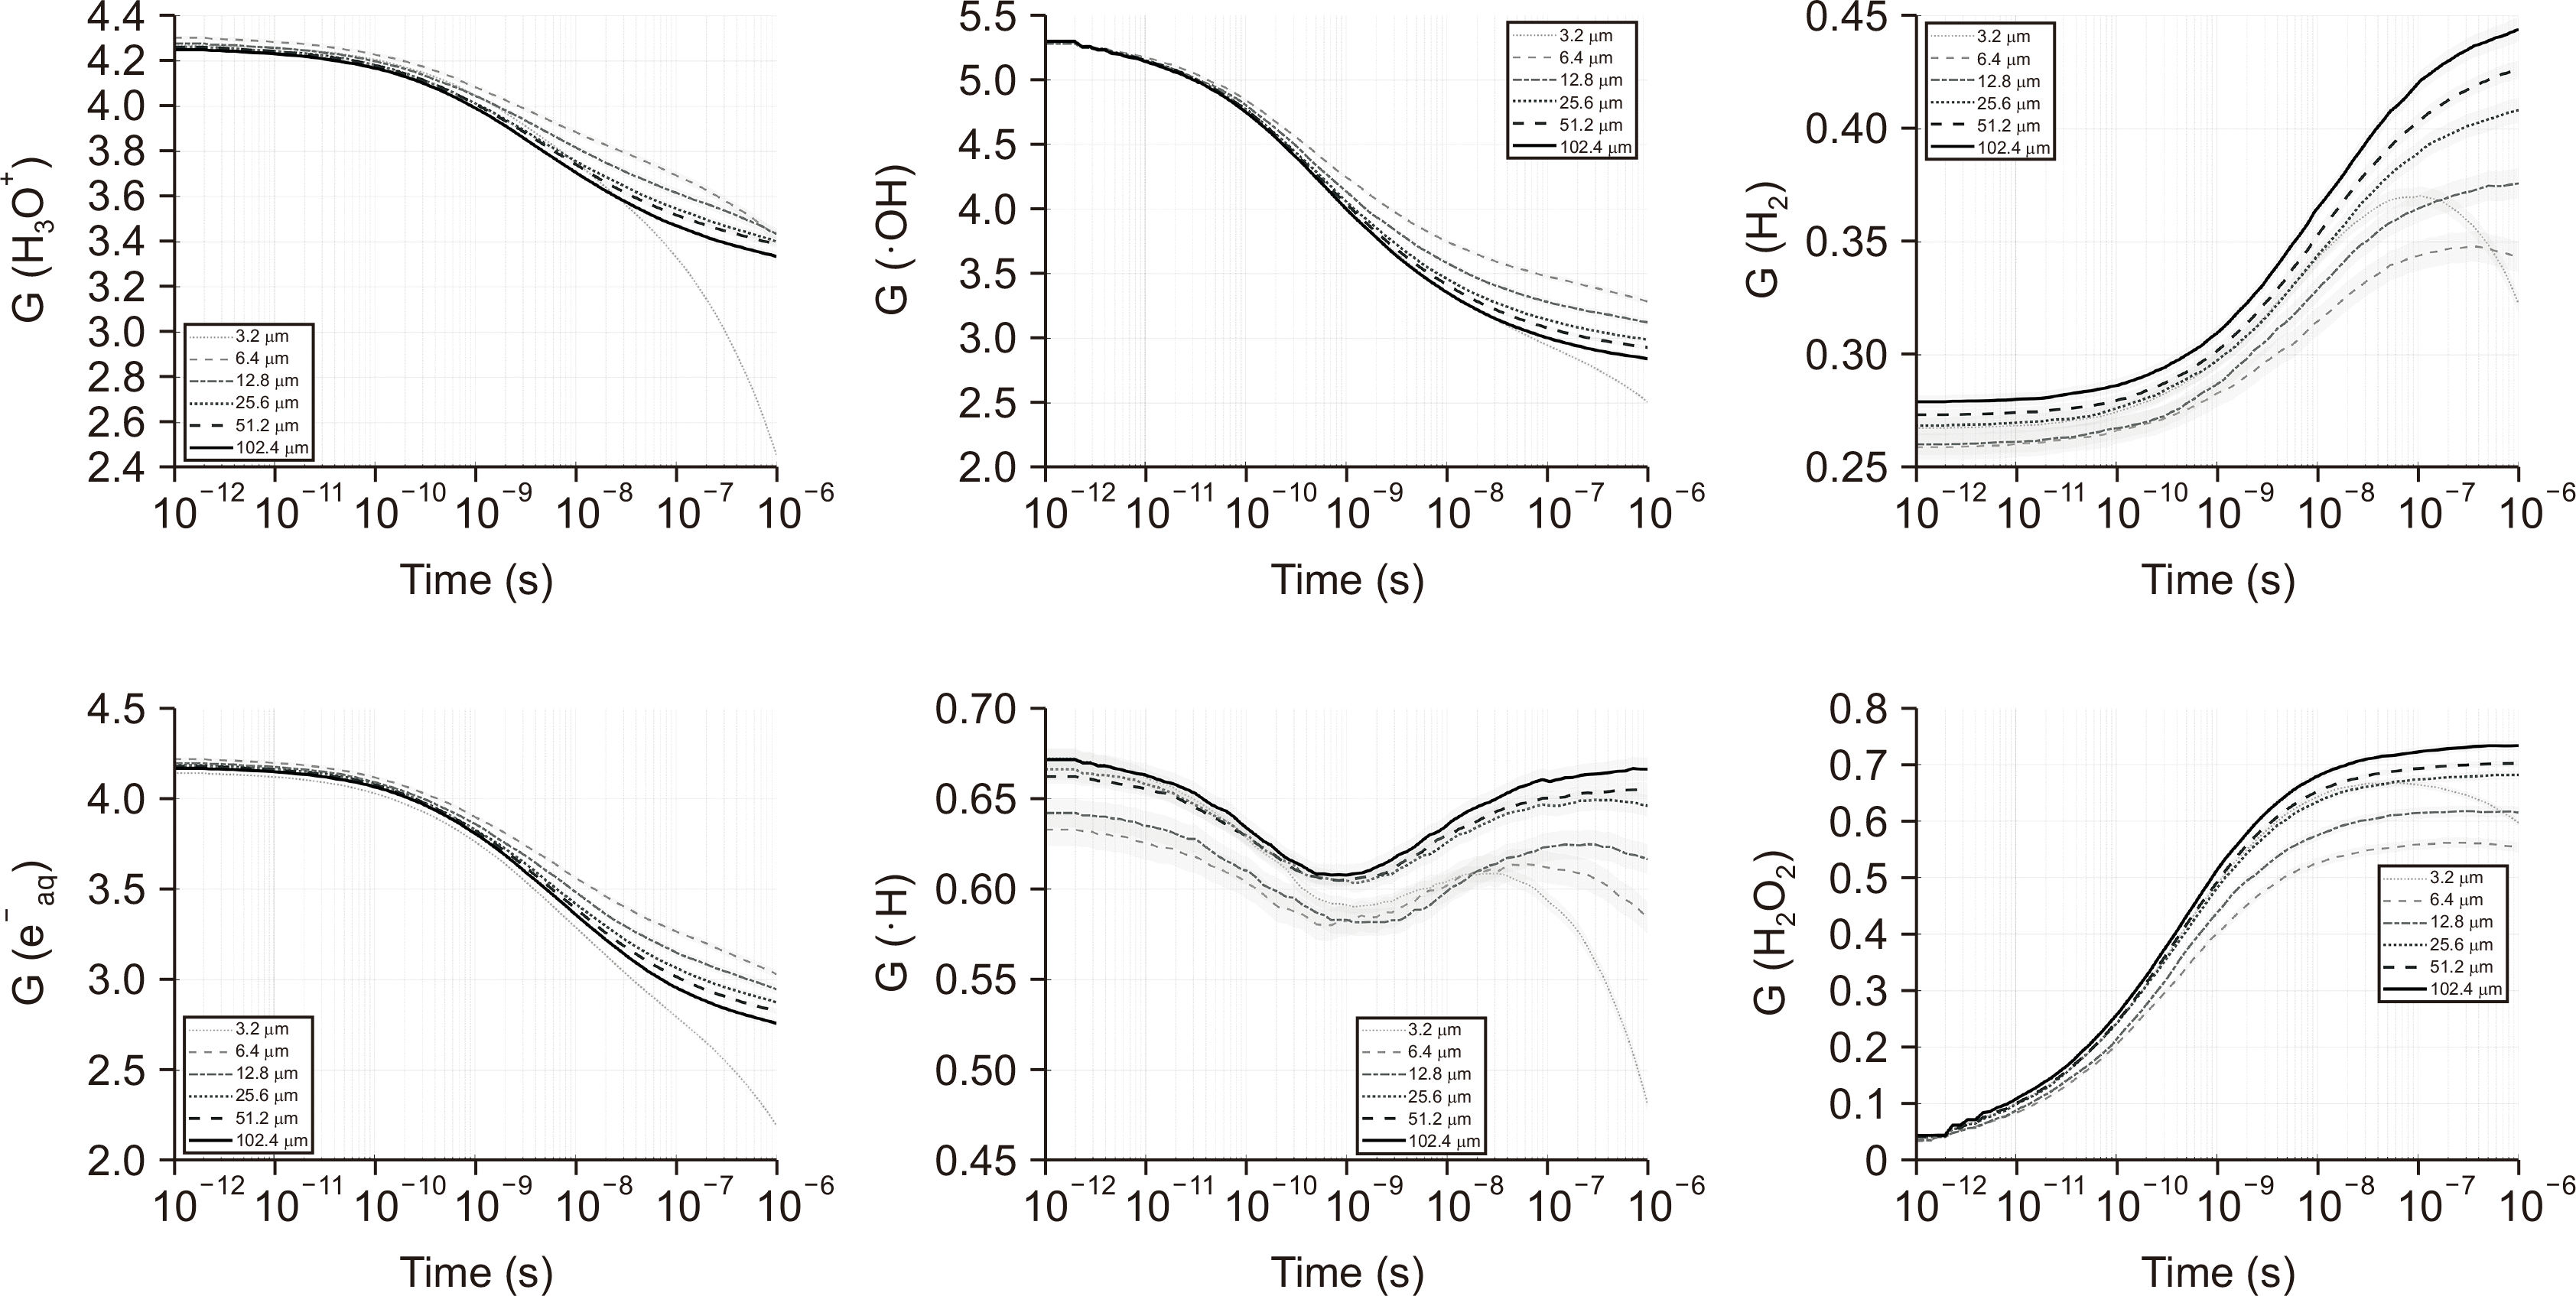
Fig. 2 shows the time-dependent chemical yields that were calculated using the SBS method for different volumes of interest. Overall, as the cubic volume increases, the contribution of low-energy electrons to yield formation becomes more important, resulting in a general trend of decreasing yields for H3O+, •OH, and e−aq and increasing yields for H2, H•, and H2O2; this is consistent with the observations from the IRT method. For the cubic volumes with side lengths of 3.2 µm, a decrease in the G values for all chemical species was observed between 10−8 and 10−8 seconds. This decrease can be attributed to the escape of chemical species from the volume of interest. In smaller geometries, planar source irradiation increases the likelihood of interactions near the boundaries, allowing the diffusing species to escape the volume. Furthermore, as the side length increases, the extent of this decrease becomes less pronounced, and the effect is nearly absent for a side length of 12.8 µm.
2. Volume-dependent chemical yield with an intertrack effect
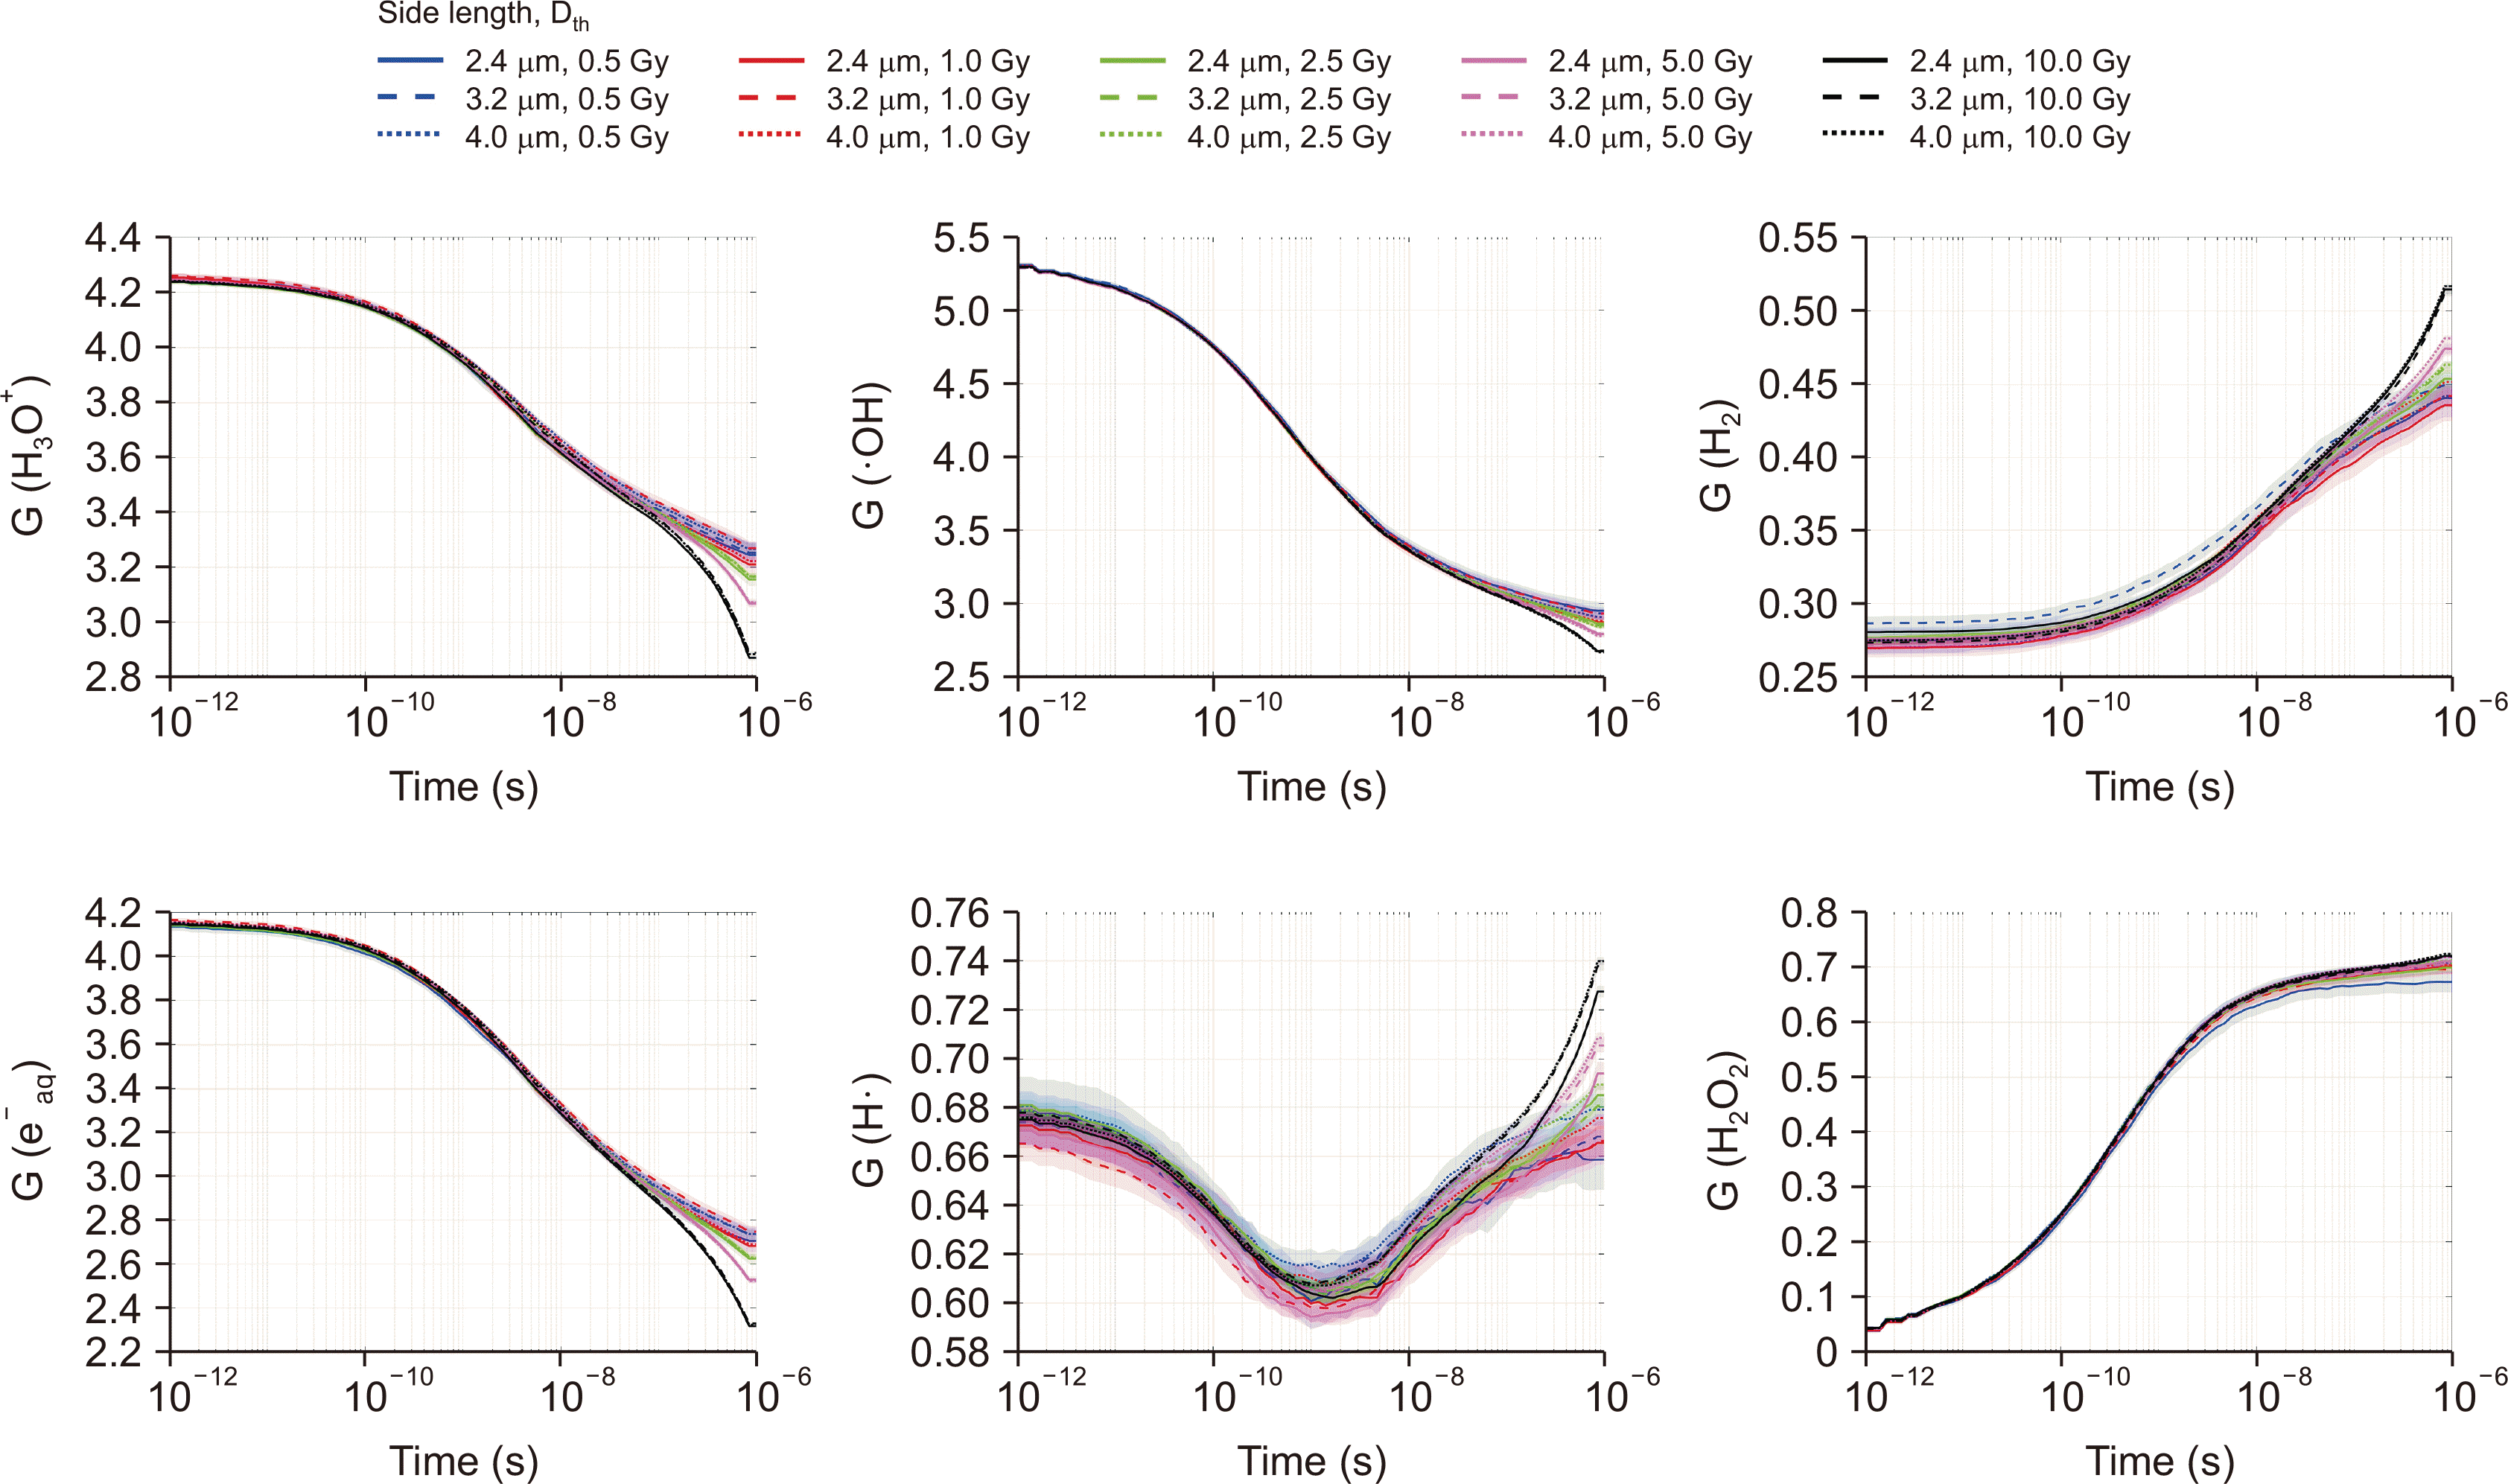
Fig. 3 shows the simulation results obtained using the SBS–RDME model, which incorporates intertrack effects while varying the volume. These results indicate that chemical yields are primarily influenced by the Dth rather than the volume size. As the volume decreases, the reduced distance between tracks causes more frequent radical–radical recombination, leading to a decrease in the yields of reactants involved in the chemical reactions listed in Table 1. Of the species, only •H showed a significant dependence on volume, showing a 1.6% increase in yield for the larger volume compared with the smaller one.
Discussion
In this study, we investigated how the chemical yields depended on the size of the volume of interest for each of the three chemical-stage simulation models implemented in Geant4-DNA. For the IRT and SBS models, the volumes were defined as cubes with side lengths ranging from 3.2 to 102.4 µm, increasing by powers of two, following the default settings of the “UHDR” Geant4-DNA example.
Under general conditions without intertrack effects, both the IRT and SBS simulations showed a consistent trend: as the volume increased, the yields of the reactants decreased, while the yields of the products increased. This trend likely reflects the greater contribution of low-energy secondary electrons, which deposit energy more locally and promote recombination among chemical species.
In SBS simulations for volumes of 3.2 and 6.4 µm, a sharp yield drop was observed between 10−8 and 10−8 seconds. This behavior was attributed to the escape of chemical species formed near the planar boundary, wherein electrons enter at oblique angles. As a result, a decrease in yield was observed regardless of whether the chemical species was a reactant or product. To minimize the loss of species in confined geometries during planar source irradiation with SBS, it is recommended to use a beam-irradiated area smaller than the average diffusion range of the fastest chemical species. The root mean square displacement of a chemical species in three-dimensional space is approximated by , where D is the diffusion coefficient and t is time. Furthermore, no notable yield drop was observed for volumes with side lengths of 12.8 µm or more.
These findings indicate that in cell-scale geometries (on the order of tens of micrometers), the effect of species loss across boundaries is minimal when using SBS for chemistry simulations under electron irradiation. However, using an irradiated area slightly smaller than the root mean square displacement is a prudent approach to reducing the boundary effects.
At 1 µs, the SBS model produced higher G values than those by the IRT model across all species. The yields from SBS were 3.4% higher for H3O+, 4.2% for •OH, 5.4% for e−aq, 3.9% for •H, and 0.4% for H2O2. By contrast, the yield for H2 was 6.6% lower. In terms of the initial yields, although the differences between the SBS and IRT models were minimal for H3O+ and e−aq (<0.1%), the SBS model produced 0.6%, 0.3%, and 1.5% higher values for •OH, •H, and H2, respectively. The H2O2 yield from the SBS model was 22.5% lower. These results indicate a more extensive recombination of reactants in IRT, which is consistent with the trends reported in a previous study [12].
At 1 µs in the 12.8-µm volume, the SBS model produced 2.4% and 1.6% higher yields for •OH and eaq−, respectively, but lower yields for H3O+ (1.1%), H2 (8.4%), •H (0.3%), and H2O2 (3.7%) compared with the IRT model. These outcomes differ from those at 102.4 µm, indicating that the discrepancies between the SBS and IRT models depend on the volume scale. Since IRT is based on Green’s function solutions that assume an infinite and homogeneous medium, caution is required when interpreting the volume-dependent results using this model.
In simulations that included the intertrack effects, the full volume-dependence analysis was limited by computational constraints. In the SBS–RDME model, which uses a compartment-based scheme, chemical species are reflected at the boundaries and do not escape. Accordingly, no sharp yield decreases were observed. As observed in previous studies, increasing the Dth has enhanced recombination. For example, the G value of H2O2 increased with higher threshold doses. Furthermore, this study investigated how chemical yields vary with simulating volume in three different chemistry simulation models. The results of this study provide a reference for researchers in selecting the appropriate volumes when using Geant4-DNA.
Conclusions
This study simulated chemical yield variations using the Geant4-DNA “UHDR” example and three calculation models while varying the volume of interest. The findings of this study can serve as a reference for researchers using Geant4-DNA and MCTS simulations to design appropriate geometric configurations.

 XML Download