Journal List > J Korean Med Sci > v.39(44) > 1516089011

Choi, Sempungu, Kim, Han, and Lee: Happiness and Its Association With Suicide Ideation and Attempt in Korea: The Roles of Socio-Environmental, Psychological, and Health-Related Factors

Abstract

Background

The association between happiness and suicide behaviour across different gender and age groups remains unclear, with few studies identifying potential confounding or mediating factors that explain this association. We aimed 1) to examine the association of happiness with suicide ideation/attempt and 2) to assess the relative contribution of potential factors in explaining the associations in South Korea.

Methods

We used data from the Korea Community Health Survey 2021, with 214,070 respondents aged over 20 years. Happiness was measured by using Cantril’s ladder of life satisfaction. Suicide ideation and suicide attempt were each measured by a single question. A hierarchical logistic regression model was used to identify the association between happiness and suicide ideation/attempt and estimate the relative importance of each socio-environmental, psychological, and health-related factor.

Results

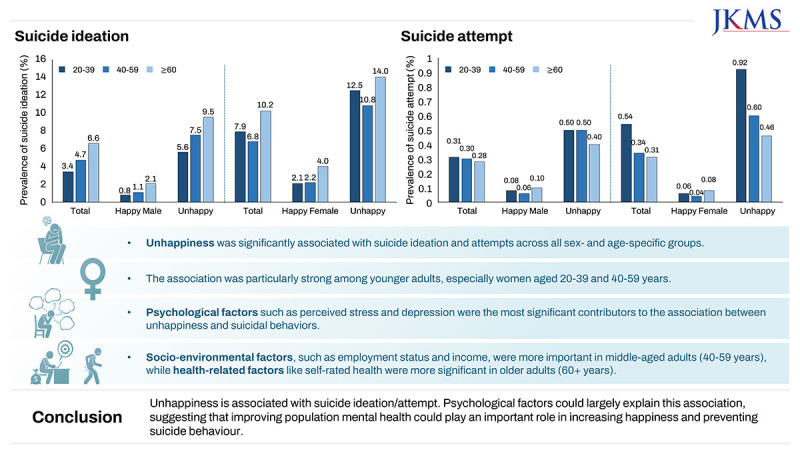
Unhappiness was associated with suicide ideation/attempt across gender and age groups. The associations appeared stronger in younger rather than older adults, particularly for women aged 20–39 and 40–59 years. Psychological factors contributed the most to explaining the association across all genders and age groups. Socio-environmental factors explained the associations more among individuals aged 40–59 years and health-related factors were more pronounced in explaining the association among those aged 60 years and above, compared to other age groups.

Conclusion

Unhappiness is associated with suicide ideation/attempt. Psychological factors could largely explain this association, suggesting that improving population mental health could play an important role in increasing happiness and preventing suicide behaviour.

Graphical Abstract

jkms-39-e283-abf001.jpg

INTRODUCTION

There has been a growing focus on happiness, or more broadly subjective well-being, in academia, governments, and international organisations.1 This shift occurs as societies transition into the post-industrial era, where public policy evolves from a primary focus on economic development to a greater emphasis on enhancing well-being.23 This indicates that some non-economic factors become increasingly important for shaping happiness.4 The United Nations General Assembly has measured happiness among its member countries and used it to help guide public policy for increasing well-being, resulting in the annual publication of the World Happiness Report since 2011.5
Suicide behaviour has also been considered an alternative indicator of well-being as it may reflect an extremely low level of well-being.267 This suggests that studying both suicide behaviour and happiness may contribute to a better understanding of well-being. For instance, if happiness is protective of suicide behaviour, then public policies or interventions aimed at enhancing happiness may also have a positive impact on suicide prevention. However, there are a few previous studies that investigated happiness and suicide behaviour together in the general population.289101112131415
Happiness and suicide behaviour seem to be related to each other, but the relationship between them is not clear. Some studies reported happiness is associated with reduced suicide,2816 whereas other studies found weak or no statistical evidence for a correlation between happiness and suicide.91017 Additionally, another previous study showed a positive correlation between happiness and suicide at the population level.18 Most previous studies used country or area-aggregated happiness scores and suicide rates to investigate the associations,16 indicating that using smaller area-level units provides stronger evidence of the association between happiness and suicide.219 However, there was limited research on the association between happiness and suicide behaviour using individual-level data.111213141520 One study found that happiness is protective against suicide at the individual level.20 Other studies identified an association between happiness and suicide ideation and behaviour.1112131415 Furthermore, few studies investigated the gender- and age-specific effects on the strength of the associations between happiness and suicide behaviour.2820 Previous studies showed that the strength of the association between happiness and suicide rates slightly increased with age at the population level.810 However, no statistical evidence of age differences in the association was observed at the individual level. Further investigation is needed to explore other suicide-related outcomes, including suicide ideation and attempt across gender and age groups.
A wide array of factors, including socioeconomic, psychological, and health-related factors, appears to contribute to both happiness and suicide and many of the factors are related to both happiness21222324 and suicide behaviour.252627 It might be important to explain why happiness was associated with suicide behaviour by identifying the explanatory factors to better understand the association. Few studies investigated the extent to which the association between happiness and suicide behaviour can be explained by factors. One previous study investigated the association between happiness and suicide at the population level in Hong Kong.2 It found a strong correlation between happiness and suicide at a small area level and suggested that area socioeconomic factors explain this association.2 Another study identified that depression explained the association between happiness and suicide at the individual level.20 However, further investigations are needed to consider the possible confounding or mediating effects of a range of factors, such as psychological distress and health behaviour, related to both happiness and suicide behaviour when investigating the association between an individual level of happiness and suicide behaviour.
In South Korea (hereafter Korea), with a population of 51 million population in the East Asian region, suicide rates have been the highest among Organisation for Economic Co-operation and Development (OECD) countries with an age-standardised suicide rate of 21.16 in 2019.28 Moreover, Korea showed the lowest happiness scores in 2019 among OECD countries with available data, according to the World Happiness Report (Fig. 1).29 Although there was no statistical evidence of the association between happiness and suicide at the national level, Korea may provide a unique context for investigating the relationship between happiness and suicide behaviour at an individual level (Fig. 1).
Fig. 1

Scatterplot of age-standardised suicide rates and happiness scores among 31 Organisation for Economic Co-operation and Development member countries in 2019, with Spearman correlation coefficient (ρ) and 95% CIs.

CI = confidence interval.
jkms-39-e283-g001
In this study, we aimed 1) to examine the association of happiness with suicide ideation/attempt and 2) to assess the relative contribution of a range of factors in explaining the association between happiness and suicide ideation/attempt in Korea.

METHODS

Data source and study population

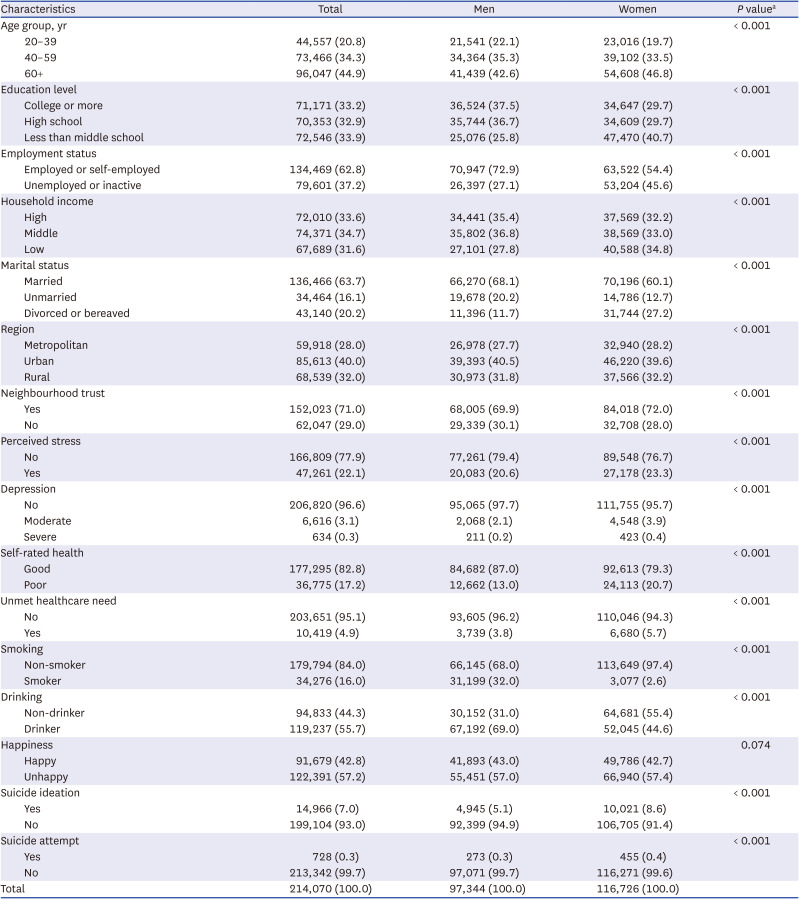
We used data from the publicly available Korea Community Health Survey (KCHS), obtained from the Korea Disease Control and Prevention Agency website (https://chs.kdca.go.kr/chs). The KCHS is an annual cross-sectional survey of Korean adults conducted by the Korea Disease Control and Prevention Agency from 2008, aimed at providing information on community-level health status to develop and evaluate community health plans or initiatives.30 In the KCHS, the samples were drawn using a stratified multistage sampling method to represent the Korean population and report on their health status (e.g., physical health, mental health, and health behaviour) and social and economic characteristics.30 Annually, over 200,000 respondents participate in the KCHS with trained interviewers.30 More detailed information on the KCHS has been reported elsewhere.30 In this study, we extracted data from KCHS collected in 2021 because happiness, suicide ideation, and suicide attempts were measured only in that year. Among those aged over 20 years, our study samples were participants who responded to all questions used in this study. The final sample was 214,070 adults, including 97,344 (45.5%) men and 116,726 (54.5%) women.

Measures

Suicide ideation was measured using a question: ‘Have you ever considered killing yourself over the past year?’ Similarly, suicide attempt was assessed using a single question: ‘Have you ever attempted killing yourself over the past year?’ Each question is answered with either yes or no. Happiness was measured using Cantril’s ladder of life satisfaction, which has been previously employed in studies on happiness51018: ‘All things considered, how satisfied are you with your life as a whole these days?’ Responses were reported using a Likert scale that ranged from 1 (less satisfied) to 10 (more satisfied), where a higher score corresponded to a greater level of happiness. We dichotomised happiness scores as happiness and unhappiness based on the median value (median = 7).
To investigate the contribution of socio-environmental factors to the association between happiness and suicide ideation/attempt, education attainment, employment status, household income, marital status, and region were included in the analysis. Educational attainment was classified as college or higher, high school, or middle school or less. Employment status was categorised into employed or self-employed and unemployed or economically inactive. For household income, we categorised into high-, middle-, and low-income groups. Marital status was categorised into three groups: married, unmarried, and divorced or bereaved. The region was determined by district-level residence and categorised into three groups: metropolitan, urban, and rural area.
For psychological factors, we included variables of neighbourhood trust, perceived stress, and depression. Trust was measured by a single question: ‘Can people in your neighbourhoods trust and rely on each other?’ with a ‘yes’ or ‘no’ answer. Perceived stress was assessed using a single question: ‘How much stress do you usually feel?’ Participants who responded with ‘very much’ or ‘much’ were defined as having perceived stress. Depression was assessed using the Patient Health Questionnaire-9 (PHQ-9), a widely used scale for depression screening. The PHQ-9 comprises nine questions and scores each of the nine criteria of the Diagnostic and Statistical Manual of Mental Disorders, fourth edition, based on the frequency of depressive symptoms.31 Each question is answered on a 4-point Likert scale (0 = ‘not at all’ to 3 = ’nearly everyday’), and the nine items are summed, resulting in scores ranging from 0 to 27, where a higher score corresponded to a greater level of depressive symptoms. We categorised respondents into three groups: normal (0–9 scores), moderate depression (10–19 scores), and severe depression (20–27 scores).32
In the context of health-related factors, we included a set of variables including self-rated health, unmet healthcare, smoking, and drinking status. Self-rated health was assessed by a single question: ‘In general, would you say your health is very good, good, fair, poor, or very poor?’ and categorised into two groups: very good, good, and fair as a single group; and poor and very poor as the other group. Unmet healthcare need was measured by asking a question: ‘In the past year, have you needed hospital care or examination but did not receive it?’ We categorised participants into two groups: those without unmet healthcare experiences and those with unmet healthcare experiences. Smoking status was assessed by asking a single question ‘Do you currently smoke cigarettes?’ and smokers were defined as individuals who reported they were ‘currently smoking cigarettes’ at the time of the survey. Drinking status was measured by asking a single question, ‘In the past year, how often did you drink?’ We defined participants who reported ‘no drink within the last year’ or ‘no drink within their lifetime’ as non-drinkers, and those who reported otherwise as drinkers.
For demographic factors, we included gender and age. Age was stratified into three groups: 20–39 years (young-aged adults), 40–59 years (middle-aged adults), and over 60 years (older-aged adults).

Statistical analysis

A descriptive analysis was conducted to estimate the prevalence of suicide ideation/attempt by happiness, gener and age group. To assess the association between happiness and suicide ideation/attempt, we used logistic regression to estimate the odds ratio (OR) and 95% confidence intervals (CIs) for suicide ideation/attempt. A Hierarchical logistic regression model was used to investigate the relative contribution of each individual or grouped factor to the association between happiness and suicide ideation/attempt. As the baseline model, we estimated the age-adjusted OR for all age groups and crude OR for age-specific groups. Furthermore, each individual explanatory variable and grouped variables (i.e., socio-environmental, psychological, and health-related factors) were included in separate models (Models 2–17).3334 Subsequently, we calculated the percentage change in the OR for both suicide ideation and suicide attempt using the provided formula35: [OR(Baseline Model) − OR(Explanatory Model)]/[OR(Baseline Model) − 1] × 100. To test the heterogeneity of the association between happiness and suicide ideation/attempt by gender and age group, we tested interaction by adding interaction terms in the final model (full adjustment). In all analyses, except for the descriptive analysis of the general characteristics of the sample, we applied sample weights assigned to all participants based on the data provided by KCHS to represent the general population in Korea. All statistical analyses were conducted using SAS version 9.4 and statistical significance was set as P value < 0.05 (SAS Institute, Cary, NC, USA).

Ethics statement

This study was exempted from Institutional Review Board (IRB) review at Korea University because it used secondary data without personal identifiers (IRB approval number: KUIRB-2023-0226-01). Informed consent was waived because of the retrospective nature of the study.

RESULTS

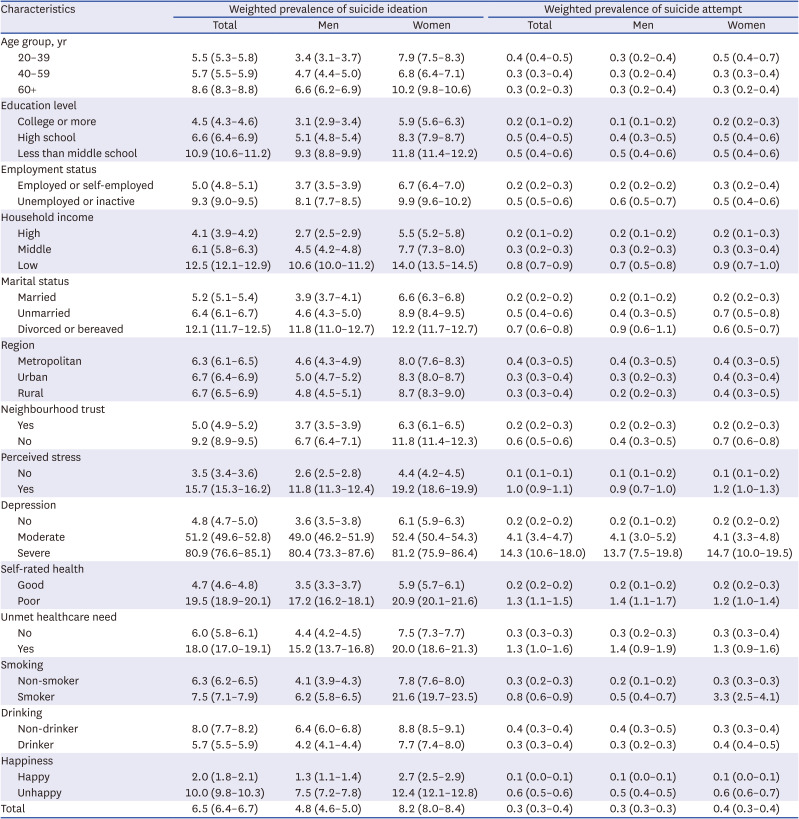
Table 1 summarises the characteristics of the study sample and presents the distribution of all the variables. Table 2 shows the weighted prevalence of suicide ideation and suicide attempt for men and women, respectively. The prevalence of suicide ideation and suicide attempt was higher in women than men and increased with lower socioeconomic status, psychological distress and health status. For happiness, respondents in the unhappy group showed about five times greater prevalence of suicide ideation/attempt among both men and women (e.g., prevalence of suicide ideation in the happy group among women: 2.7% vs. the unhappy group: 12.4%).
Table 1

General characteristics of the study population
jkms-39-e283-i001
Characteristics Total Men Women P valuea
Age group, yr < 0.001
20–39 44,557 (20.8) 21,541 (22.1) 23,016 (19.7)
40–59 73,466 (34.3) 34,364 (35.3) 39,102 (33.5)
60+ 96,047 (44.9) 41,439 (42.6) 54,608 (46.8)
Education level < 0.001
College or more 71,171 (33.2) 36,524 (37.5) 34,647 (29.7)
High school 70,353 (32.9) 35,744 (36.7) 34,609 (29.7)
Less than middle school 72,546 (33.9) 25,076 (25.8) 47,470 (40.7)
Employment status < 0.001
Employed or self-employed 134,469 (62.8) 70,947 (72.9) 63,522 (54.4)
Unemployed or inactive 79,601 (37.2) 26,397 (27.1) 53,204 (45.6)
Household income < 0.001
High 72,010 (33.6) 34,441 (35.4) 37,569 (32.2)
Middle 74,371 (34.7) 35,802 (36.8) 38,569 (33.0)
Low 67,689 (31.6) 27,101 (27.8) 40,588 (34.8)
Marital status < 0.001
Married 136,466 (63.7) 66,270 (68.1) 70,196 (60.1)
Unmarried 34,464 (16.1) 19,678 (20.2) 14,786 (12.7)
Divorced or bereaved 43,140 (20.2) 11,396 (11.7) 31,744 (27.2)
Region < 0.001
Metropolitan 59,918 (28.0) 26,978 (27.7) 32,940 (28.2)
Urban 85,613 (40.0) 39,393 (40.5) 46,220 (39.6)
Rural 68,539 (32.0) 30,973 (31.8) 37,566 (32.2)
Neighbourhood trust < 0.001
Yes 152,023 (71.0) 68,005 (69.9) 84,018 (72.0)
No 62,047 (29.0) 29,339 (30.1) 32,708 (28.0)
Perceived stress < 0.001
No 166,809 (77.9) 77,261 (79.4) 89,548 (76.7)
Yes 47,261 (22.1) 20,083 (20.6) 27,178 (23.3)
Depression < 0.001
No 206,820 (96.6) 95,065 (97.7) 111,755 (95.7)
Moderate 6,616 (3.1) 2,068 (2.1) 4,548 (3.9)
Severe 634 (0.3) 211 (0.2) 423 (0.4)
Self-rated health < 0.001
Good 177,295 (82.8) 84,682 (87.0) 92,613 (79.3)
Poor 36,775 (17.2) 12,662 (13.0) 24,113 (20.7)
Unmet healthcare need < 0.001
No 203,651 (95.1) 93,605 (96.2) 110,046 (94.3)
Yes 10,419 (4.9) 3,739 (3.8) 6,680 (5.7)
Smoking < 0.001
Non-smoker 179,794 (84.0) 66,145 (68.0) 113,649 (97.4)
Smoker 34,276 (16.0) 31,199 (32.0) 3,077 (2.6)
Drinking < 0.001
Non-drinker 94,833 (44.3) 30,152 (31.0) 64,681 (55.4)
Drinker 119,237 (55.7) 67,192 (69.0) 52,045 (44.6)
Happiness 0.074
Happy 91,679 (42.8) 41,893 (43.0) 49,786 (42.7)
Unhappy 122,391 (57.2) 55,451 (57.0) 66,940 (57.4)
Suicide ideation < 0.001
Yes 14,966 (7.0) 4,945 (5.1) 10,021 (8.6)
No 199,104 (93.0) 92,399 (94.9) 106,705 (91.4)
Suicide attempt < 0.001
Yes 728 (0.3) 273 (0.3) 455 (0.4)
No 213,342 (99.7) 97,071 (99.7) 116,271 (99.6)
Total 214,070 (100.0) 97,344 (100.0) 116,726 (100.0)
Values are presented as number (%).
aP value for gender differences.
Table 2

Weighted prevalence of suicide ideation and suicide attempt with 95% confidence intervals
jkms-39-e283-i002
Characteristics Weighted prevalence of suicide ideation Weighted prevalence of suicide attempt
Total Men Women Total Men Women
Age group, yr
20–39 5.5 (5.3–5.8) 3.4 (3.1–3.7) 7.9 (7.5–8.3) 0.4 (0.4–0.5) 0.3 (0.2–0.4) 0.5 (0.4–0.7)
40–59 5.7 (5.5–5.9) 4.7 (4.4–5.0) 6.8 (6.4–7.1) 0.3 (0.3–0.4) 0.3 (0.2–0.4) 0.3 (0.3–0.4)
60+ 8.6 (8.3–8.8) 6.6 (6.2–6.9) 10.2 (9.8–10.6) 0.3 (0.2–0.3) 0.3 (0.2–0.4) 0.3 (0.2–0.4)
Education level
College or more 4.5 (4.3–4.6) 3.1 (2.9–3.4) 5.9 (5.6–6.3) 0.2 (0.1–0.2) 0.1 (0.1–0.2) 0.2 (0.2–0.3)
High school 6.6 (6.4–6.9) 5.1 (4.8–5.4) 8.3 (7.9–8.7) 0.5 (0.4–0.5) 0.4 (0.3–0.5) 0.5 (0.4–0.6)
Less than middle school 10.9 (10.6–11.2) 9.3 (8.8–9.9) 11.8 (11.4–12.2) 0.5 (0.4–0.6) 0.5 (0.4–0.6) 0.5 (0.4–0.6)
Employment status
Employed or self-employed 5.0 (4.8–5.1) 3.7 (3.5–3.9) 6.7 (6.4–7.0) 0.2 (0.2–0.3) 0.2 (0.2–0.2) 0.3 (0.2–0.4)
Unemployed or inactive 9.3 (9.0–9.5) 8.1 (7.7–8.5) 9.9 (9.6–10.2) 0.5 (0.5–0.6) 0.6 (0.5–0.7) 0.5 (0.4–0.6)
Household income
High 4.1 (3.9–4.2) 2.7 (2.5–2.9) 5.5 (5.2–5.8) 0.2 (0.1–0.2) 0.2 (0.1–0.2) 0.2 (0.1–0.3)
Middle 6.1 (5.8–6.3) 4.5 (4.2–4.8) 7.7 (7.3–8.0) 0.3 (0.2–0.3) 0.3 (0.2–0.3) 0.3 (0.3–0.4)
Low 12.5 (12.1–12.9) 10.6 (10.0–11.2) 14.0 (13.5–14.5) 0.8 (0.7–0.9) 0.7 (0.5–0.8) 0.9 (0.7–1.0)
Marital status
Married 5.2 (5.1–5.4) 3.9 (3.7–4.1) 6.6 (6.3–6.8) 0.2 (0.2–0.2) 0.2 (0.1–0.2) 0.2 (0.2–0.3)
Unmarried 6.4 (6.1–6.7) 4.6 (4.3–5.0) 8.9 (8.4–9.5) 0.5 (0.4–0.6) 0.4 (0.3–0.5) 0.7 (0.5–0.8)
Divorced or bereaved 12.1 (11.7–12.5) 11.8 (11.0–12.7) 12.2 (11.7–12.7) 0.7 (0.6–0.8) 0.9 (0.6–1.1) 0.6 (0.5–0.7)
Region
Metropolitan 6.3 (6.1–6.5) 4.6 (4.3–4.9) 8.0 (7.6–8.3) 0.4 (0.3–0.5) 0.4 (0.3–0.5) 0.4 (0.3–0.5)
Urban 6.7 (6.4–6.9) 5.0 (4.7–5.2) 8.3 (8.0–8.7) 0.3 (0.3–0.4) 0.3 (0.2–0.3) 0.4 (0.3–0.4)
Rural 6.7 (6.5–6.9) 4.8 (4.5–5.1) 8.7 (8.3–9.0) 0.3 (0.3–0.4) 0.2 (0.2–0.3) 0.4 (0.3–0.5)
Neighbourhood trust
Yes 5.0 (4.9–5.2) 3.7 (3.5–3.9) 6.3 (6.1–6.5) 0.2 (0.2–0.3) 0.2 (0.2–0.3) 0.2 (0.2–0.3)
No 9.2 (8.9–9.5) 6.7 (6.4–7.1) 11.8 (11.4–12.3) 0.6 (0.5–0.6) 0.4 (0.3–0.5) 0.7 (0.6–0.8)
Perceived stress
No 3.5 (3.4–3.6) 2.6 (2.5–2.8) 4.4 (4.2–4.5) 0.1 (0.1–0.1) 0.1 (0.1–0.2) 0.1 (0.1–0.2)
Yes 15.7 (15.3–16.2) 11.8 (11.3–12.4) 19.2 (18.6–19.9) 1.0 (0.9–1.1) 0.9 (0.7–1.0) 1.2 (1.0–1.3)
Depression
No 4.8 (4.7–5.0) 3.6 (3.5–3.8) 6.1 (5.9–6.3) 0.2 (0.2–0.2) 0.2 (0.1–0.2) 0.2 (0.2–0.2)
Moderate 51.2 (49.6–52.8) 49.0 (46.2–51.9) 52.4 (50.4–54.3) 4.1 (3.4–4.7) 4.1 (3.0–5.2) 4.1 (3.3–4.8)
Severe 80.9 (76.6–85.1) 80.4 (73.3–87.6) 81.2 (75.9–86.4) 14.3 (10.6–18.0) 13.7 (7.5–19.8) 14.7 (10.0–19.5)
Self-rated health
Good 4.7 (4.6–4.8) 3.5 (3.3–3.7) 5.9 (5.7–6.1) 0.2 (0.2–0.2) 0.2 (0.1–0.2) 0.2 (0.2–0.3)
Poor 19.5 (18.9–20.1) 17.2 (16.2–18.1) 20.9 (20.1–21.6) 1.3 (1.1–1.5) 1.4 (1.1–1.7) 1.2 (1.0–1.4)
Unmet healthcare need
No 6.0 (5.8–6.1) 4.4 (4.2–4.5) 7.5 (7.3–7.7) 0.3 (0.3–0.3) 0.3 (0.2–0.3) 0.3 (0.3–0.4)
Yes 18.0 (17.0–19.1) 15.2 (13.7–16.8) 20.0 (18.6–21.3) 1.3 (1.0–1.6) 1.4 (0.9–1.9) 1.3 (0.9–1.6)
Smoking
Non-smoker 6.3 (6.2–6.5) 4.1 (3.9–4.3) 7.8 (7.6–8.0) 0.3 (0.2–0.3) 0.2 (0.1–0.2) 0.3 (0.3–0.3)
Smoker 7.5 (7.1–7.9) 6.2 (5.8–6.5) 21.6 (19.7–23.5) 0.8 (0.6–0.9) 0.5 (0.4–0.7) 3.3 (2.5–4.1)
Drinking
Non-drinker 8.0 (7.7–8.2) 6.4 (6.0–6.8) 8.8 (8.5–9.1) 0.4 (0.3–0.4) 0.4 (0.3–0.5) 0.3 (0.3–0.4)
Drinker 5.7 (5.5–5.9) 4.2 (4.1–4.4) 7.7 (7.4–8.0) 0.3 (0.3–0.4) 0.3 (0.2–0.3) 0.4 (0.4–0.5)
Happiness
Happy 2.0 (1.8–2.1) 1.3 (1.1–1.4) 2.7 (2.5–2.9) 0.1 (0.0–0.1) 0.1 (0.0–0.1) 0.1 (0.0–0.1)
Unhappy 10.0 (9.8–10.3) 7.5 (7.2–7.8) 12.4 (12.1–12.8) 0.6 (0.5–0.6) 0.5 (0.4–0.5) 0.6 (0.6–0.7)
Total 6.5 (6.4–6.7) 4.8 (4.6–5.0) 8.2 (8.0–8.4) 0.3 (0.3–0.4) 0.3 (0.3–0.3) 0.4 (0.3–0.4)
Values are presented as % (95% confidence interval).
Fig. 2 shows the gender- and age-specific prevalence of suicide ideation and suicide attempt by happiness. The prevalence of suicide ideation is the highest among individuals aged 60 years and older while the prevalence of suicide attempt is the highest among those aged 20–39 years. The prevalence of both suicide ideation and attempt was higher among those in the unhappy group than in the happy group across all age groups. For example, among women aged 20–39 years, the prevalence of suicide ideation was 2.1% in the happy group and 12.5% in the unhappy group. Furthermore, the gap in the prevalence of suicide attempt between the happy and unhappy groups widened more among individuals aged 20–39 years than among those aged 60 years and older (e.g., 0.06% for happy women aged 20–39 years vs. 0.92% for unhappy women aged 20–39 years).
Fig. 2

Gender and age-specific prevalence of (A) suicide ideation and (B) suicide attempt by level of happiness.

jkms-39-e283-g002
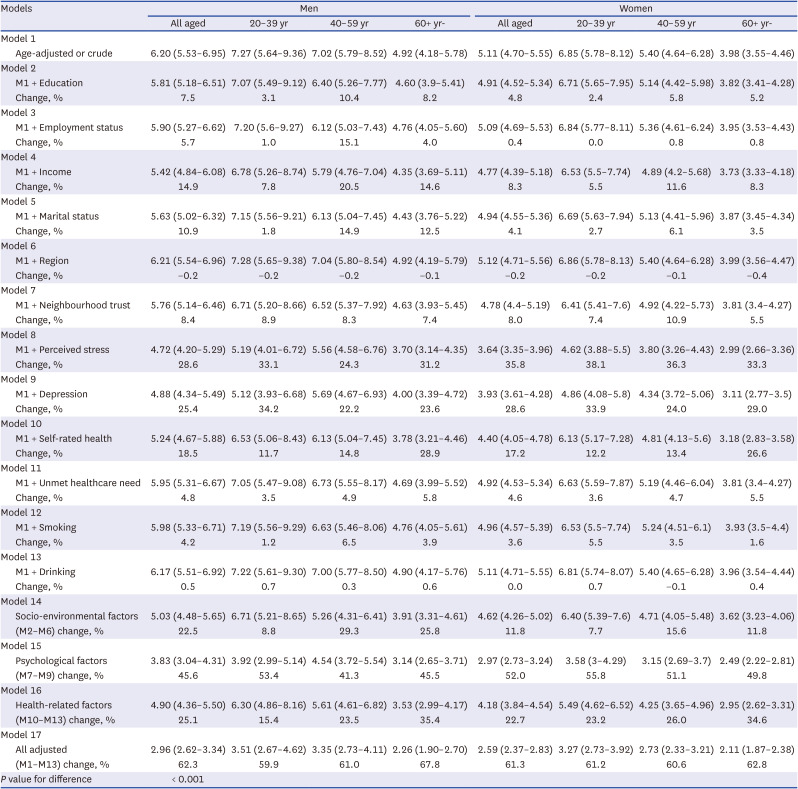
Table 3 shows the association between happiness and suicide ideation in both genders in the base model and models including a range of explanatory factors. In Model 1, there was statistical evidence of an association between unhappiness and suicide ideation across all age groups in both men and women. For example, compared to individuals of all ages in the happy group, those who were unhappy had 6.20- and 5.11-times higher odds of suicide ideation in men and women, respectively (95% CI, 5.53–6.95 and 4.70–5.55 for men and women, respectively). The strength of the association between unhappiness and suicide ideation was greater in individuals aged 20–39 and 40–59 years than in those aged 60 years and older. For instance, in Model 1, the OR of suicide ideation among males aged 20–39 years was 7.27 (95% CI, 5.64–9.36), followed by those aged 40–59 years (OR, 7.02; 95% CI, 5.79–8.52), and those over 60 years (OR, 4.92; 95% CI, 4.18–5.78). Among explanatory factors, psychological factors accounted for the greatest reduction in the magnitude of association between unhappiness and suicide ideation among all age groups in both men and women in Model 15 (41.3–55.8%). Particularly, among men and women aged 20–39 years, the ORs of suicide ideation decreased the most, by 53.4% and 55.8%, respectively. For socio-environmental factors, the ORs of suicide ideation decreased by 7.7–29.3% after controlling all socio-environmental factors (Model 14). The highest reduction in the ORs was observed among men and women aged 40–59 years (29.3% for men and 15.6% for women) after accounting for all socio-environmental factors. For health-related factors, the odds of suicide ideation decreased by 15.4–35.4% after controlling all health-related factors (Model 16). Particularly, the ORs of suicide ideation substantially decreased by 35.4% and 34.6% among men and women aged 60 years and above. After including all variables in the model (Model 17), the ORs decreased by 59.9% to 67.8%, and the association between unhappiness and suicide ideation remained significant in all age groups for both genders.
Table 3

Gender and age-specific ORs (95% confidence intervals) for associations between happiness and suicide ideation adjusted by explanatory variables and the explained fraction
jkms-39-e283-i003
Models Men Women
All aged 20–39 yr 40–59 yr 60+ yr- All aged 20–39 yr 40–59 yr 60+ yr-
Model 1
Age-adjusted or crude 6.20 (5.53–6.95) 7.27 (5.64–9.36) 7.02 (5.79–8.52) 4.92 (4.18–5.78) 5.11 (4.70–5.55) 6.85 (5.78–8.12) 5.40 (4.64–6.28) 3.98 (3.55–4.46)
Model 2
M1 + Education 5.81 (5.18–6.51) 7.07 (5.49–9.12) 6.40 (5.26–7.77) 4.60 (3.9–5.41) 4.91 (4.52–5.34) 6.71 (5.65–7.95) 5.14 (4.42–5.98) 3.82 (3.41–4.28)
Change, % 7.5 3.1 10.4 8.2 4.8 2.4 5.8 5.2
Model 3
M1 + Employment status 5.90 (5.27–6.62) 7.20 (5.6–9.27) 6.12 (5.03–7.43) 4.76 (4.05–5.60) 5.09 (4.69–5.53) 6.84 (5.77–8.11) 5.36 (4.61–6.24) 3.95 (3.53–4.43)
Change, % 5.7 1.0 15.1 4.0 0.4 0.0 0.8 0.8
Model 4
M1 + Income 5.42 (4.84–6.08) 6.78 (5.26–8.74) 5.79 (4.76–7.04) 4.35 (3.69–5.11) 4.77 (4.39–5.18) 6.53 (5.5–7.74) 4.89 (4.2–5.68) 3.73 (3.33–4.18)
Change, % 14.9 7.8 20.5 14.6 8.3 5.5 11.6 8.3
Model 5
M1 + Marital status 5.63 (5.02–6.32) 7.15 (5.56–9.21) 6.13 (5.04–7.45) 4.43 (3.76–5.22) 4.94 (4.55–5.36) 6.69 (5.63–7.94) 5.13 (4.41–5.96) 3.87 (3.45–4.34)
Change, % 10.9 1.8 14.9 12.5 4.1 2.7 6.1 3.5
Model 6
M1 + Region 6.21 (5.54–6.96) 7.28 (5.65–9.38) 7.04 (5.80–8.54) 4.92 (4.19–5.79) 5.12 (4.71–5.56) 6.86 (5.78–8.13) 5.40 (4.64–6.28) 3.99 (3.56–4.47)
Change, % −0.2 −0.2 −0.2 −0.1 −0.2 −0.2 −0.1 −0.4
Model 7
M1 + Neighbourhood trust 5.76 (5.14–6.46) 6.71 (5.20–8.66) 6.52 (5.37–7.92) 4.63 (3.93–5.45) 4.78 (4.4–5.19) 6.41 (5.41–7.6) 4.92 (4.22–5.73) 3.81 (3.4–4.27)
Change, % 8.4 8.9 8.3 7.4 8.0 7.4 10.9 5.5
Model 8
M1 + Perceived stress 4.72 (4.20–5.29) 5.19 (4.01–6.72) 5.56 (4.58–6.76) 3.70 (3.14–4.35) 3.64 (3.35–3.96) 4.62 (3.88–5.5) 3.80 (3.26–4.43) 2.99 (2.66–3.36)
Change, % 28.6 33.1 24.3 31.2 35.8 38.1 36.3 33.3
Model 9
M1 + Depression 4.88 (4.34–5.49) 5.12 (3.93–6.68) 5.69 (4.67–6.93) 4.00 (3.39–4.72) 3.93 (3.61–4.28) 4.86 (4.08–5.8) 4.34 (3.72–5.06) 3.11 (2.77–3.5)
Change, % 25.4 34.2 22.2 23.6 28.6 33.9 24.0 29.0
Model 10
M1 + Self-rated health 5.24 (4.67–5.88) 6.53 (5.06–8.43) 6.13 (5.04–7.45) 3.78 (3.21–4.46) 4.40 (4.05–4.78) 6.13 (5.17–7.28) 4.81 (4.13–5.6) 3.18 (2.83–3.58)
Change, % 18.5 11.7 14.8 28.9 17.2 12.2 13.4 26.6
Model 11
M1 + Unmet healthcare need 5.95 (5.31–6.67) 7.05 (5.47–9.08) 6.73 (5.55–8.17) 4.69 (3.99–5.52) 4.92 (4.53–5.34) 6.63 (5.59–7.87) 5.19 (4.46–6.04) 3.81 (3.4–4.27)
Change, % 4.8 3.5 4.9 5.8 4.6 3.6 4.7 5.5
Model 12
M1 + Smoking 5.98 (5.33–6.71) 7.19 (5.56–9.29) 6.63 (5.46–8.06) 4.76 (4.05–5.61) 4.96 (4.57–5.39) 6.53 (5.5–7.74) 5.24 (4.51–6.1) 3.93 (3.5–4.4)
Change, % 4.2 1.2 6.5 3.9 3.6 5.5 3.5 1.6
Model 13
M1 + Drinking 6.17 (5.51–6.92) 7.22 (5.61–9.30) 7.00 (5.77–8.50) 4.90 (4.17–5.76) 5.11 (4.71–5.55) 6.81 (5.74–8.07) 5.40 (4.65–6.28) 3.96 (3.54–4.44)
Change, % 0.5 0.7 0.3 0.6 0.0 0.7 −0.1 0.4
Model 14
Socio-environmental factors 5.03 (4.48–5.65) 6.71 (5.21–8.65) 5.26 (4.31–6.41) 3.91 (3.31–4.61) 4.62 (4.26–5.02) 6.40 (5.39–7.6) 4.71 (4.05–5.48) 3.62 (3.23–4.06)
(M2–M6) change, % 22.5 8.8 29.3 25.8 11.8 7.7 15.6 11.8
Model 15
Psychological factors 3.83 (3.04–4.31) 3.92 (2.99–5.14) 4.54 (3.72–5.54) 3.14 (2.65–3.71) 2.97 (2.73–3.24) 3.58 (3–4.29) 3.15 (2.69–3.7) 2.49 (2.22–2.81)
(M7–M9) change, % 45.6 53.4 41.3 45.5 52.0 55.8 51.1 49.8
Model 16
Health-related factors 4.90 (4.36–5.50) 6.30 (4.86–8.16) 5.61 (4.61–6.82) 3.53 (2.99–4.17) 4.18 (3.84–4.54) 5.49 (4.62–6.52) 4.25 (3.65–4.96) 2.95 (2.62–3.31)
(M10–M13) change, % 25.1 15.4 23.5 35.4 22.7 23.2 26.0 34.6
Model 17
All adjusted 2.96 (2.62–3.34) 3.51 (2.67–4.62) 3.35 (2.73–4.11) 2.26 (1.90–2.70) 2.59 (2.37–2.83) 3.27 (2.73–3.92) 2.73 (2.33–3.21) 2.11 (1.87–2.38)
(M1–M13) change, % 62.3 59.9 61.0 67.8 61.3 61.2 60.6 62.8
P value for difference < 0.001
Change was calculated by [OR(Model 1) − OR(Explanatory Model)]/[OR(Model 1) − 1] × 100.
OR = odds ratio.
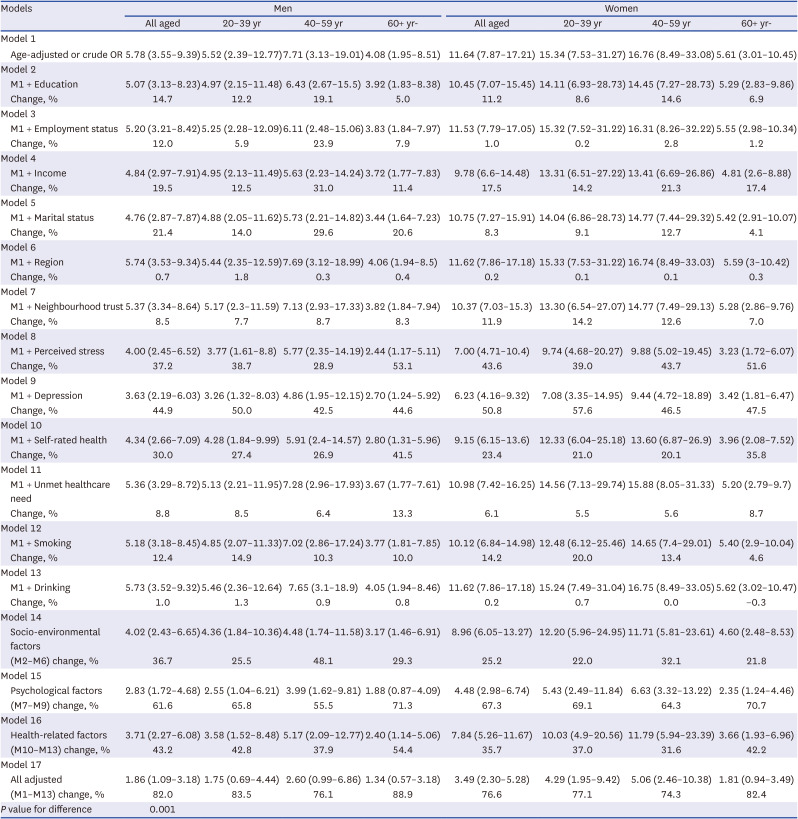
Table 4 similarly shows statistical evidence of associations with suicide attempt, with much stronger associations observed among individuals aged 20–39 and 40–59 years than among those aged 60 years and older, particularly for women. For example, the least association with suicide attempt was observed among men aged 60 years and above (OR, 4.08; 95% CI, 1.95–8.51), while the strongest association was found among women aged 40–59 years (OR, 16.76; 95% CI, 8.49–33.08) in Model 1. After accounting for explanatory factors in each model, findings were similar to the association of these factors with suicide ideation. For example, psychological factors accounted for the largest reduction in the association between unhappiness and suicide ideation across all gender and age groups (55.5–71.3%; Model 15). For socio-environmental factors, the ORs of suicide attempt in males and females aged 40–59 years decreased by 48.1% and 32.1%, respectively, after controlling for all socio-environmental factors (Model 14). For health-related factors, among men and women aged 60 years and above, the ORs of suicide attempt decreased by 54.4% and 42.2%, respectively, after controlling for all health-related factors (Model 16). After including all explanatory variables in the same model (Model 17), the ORs decreased by 74.3% to 88.9%, and the association between happiness and suicide attempt remained significant only in women aged 20–39 and 40–59 years.
Table 4

Gender and age-specific ORs (95% confidence intervals) for associations between happiness and suicide attempt adjusted by explanatory variables and the explained fraction
jkms-39-e283-i004
Models Men Women
All aged 20–39 yr 40–59 yr 60+ yr- All aged 20–39 yr 40–59 yr 60+ yr-
Model 1
Age-adjusted or crude OR 5.78 (3.55–9.39) 5.52 (2.39–12.77) 7.71 (3.13–19.01) 4.08 (1.95–8.51) 11.64 (7.87–17.21) 15.34 (7.53–31.27) 16.76 (8.49–33.08) 5.61 (3.01–10.45)
Model 2
M1 + Education 5.07 (3.13–8.23) 4.97 (2.15–11.48) 6.43 (2.67–15.5) 3.92 (1.83–8.38) 10.45 (7.07–15.45) 14.11 (6.93–28.73) 14.45 (7.27–28.73) 5.29 (2.83–9.86)
Change, % 14.7 12.2 19.1 5.0 11.2 8.6 14.6 6.9
Model 3
M1 + Employment status 5.20 (3.21–8.42) 5.25 (2.28–12.09) 6.11 (2.48–15.06) 3.83 (1.84–7.97) 11.53 (7.79–17.05) 15.32 (7.52–31.22) 16.31 (8.26–32.22) 5.55 (2.98–10.34)
Change, % 12.0 5.9 23.9 7.9 1.0 0.2 2.8 1.2
Model 4
M1 + Income 4.84 (2.97–7.91) 4.95 (2.13–11.49) 5.63 (2.23–14.24) 3.72 (1.77–7.83) 9.78 (6.6–14.48) 13.31 (6.51–27.22) 13.41 (6.69–26.86) 4.81 (2.6–8.88)
Change, % 19.5 12.5 31.0 11.4 17.5 14.2 21.3 17.4
Model 5
M1 + Marital status 4.76 (2.87–7.87) 4.88 (2.05–11.62) 5.73 (2.21–14.82) 3.44 (1.64–7.23) 10.75 (7.27–15.91) 14.04 (6.86–28.73) 14.77 (7.44–29.32) 5.42 (2.91–10.07)
Change, % 21.4 14.0 29.6 20.6 8.3 9.1 12.7 4.1
Model 6
M1 + Region 5.74 (3.53–9.34) 5.44 (2.35–12.59) 7.69 (3.12–18.99) 4.06 (1.94–8.5) 11.62 (7.86–17.18) 15.33 (7.53–31.22) 16.74 (8.49–33.03) 5.59 (3–10.42)
Change, % 0.7 1.8 0.3 0.4 0.2 0.1 0.1 0.3
Model 7
M1 + Neighbourhood trust 5.37 (3.34–8.64) 5.17 (2.3–11.59) 7.13 (2.93–17.33) 3.82 (1.84–7.94) 10.37 (7.03–15.3) 13.30 (6.54–27.07) 14.77 (7.49–29.13) 5.28 (2.86–9.76)
Change, % 8.5 7.7 8.7 8.3 11.9 14.2 12.6 7.0
Model 8
M1 + Perceived stress 4.00 (2.45–6.52) 3.77 (1.61–8.8) 5.77 (2.35–14.19) 2.44 (1.17–5.11) 7.00 (4.71–10.4) 9.74 (4.68–20.27) 9.88 (5.02–19.45) 3.23 (1.72–6.07)
Change, % 37.2 38.7 28.9 53.1 43.6 39.0 43.7 51.6
Model 9
M1 + Depression 3.63 (2.19–6.03) 3.26 (1.32–8.03) 4.86 (1.95–12.15) 2.70 (1.24–5.92) 6.23 (4.16–9.32) 7.08 (3.35–14.95) 9.44 (4.72–18.89) 3.42 (1.81–6.47)
Change, % 44.9 50.0 42.5 44.6 50.8 57.6 46.5 47.5
Model 10
M1 + Self-rated health 4.34 (2.66–7.09) 4.28 (1.84–9.99) 5.91 (2.4–14.57) 2.80 (1.31–5.96) 9.15 (6.15–13.6) 12.33 (6.04–25.18) 13.60 (6.87–26.9) 3.96 (2.08–7.52)
Change, % 30.0 27.4 26.9 41.5 23.4 21.0 20.1 35.8
Model 11
M1 + Unmet healthcare need 5.36 (3.29–8.72) 5.13 (2.21–11.95) 7.28 (2.96–17.93) 3.67 (1.77–7.61) 10.98 (7.42–16.25) 14.56 (7.13–29.74) 15.88 (8.05–31.33) 5.20 (2.79–9.7)
Change, % 8.8 8.5 6.4 13.3 6.1 5.5 5.6 8.7
Model 12
M1 + Smoking 5.18 (3.18–8.45) 4.85 (2.07–11.33) 7.02 (2.86–17.24) 3.77 (1.81–7.85) 10.12 (6.84–14.98) 12.48 (6.12–25.46) 14.65 (7.4–29.01) 5.40 (2.9–10.04)
Change, % 12.4 14.9 10.3 10.0 14.2 20.0 13.4 4.6
Model 13
M1 + Drinking 5.73 (3.52–9.32) 5.46 (2.36–12.64) 7.65 (3.1–18.9) 4.05 (1.94–8.46) 11.62 (7.86–17.18) 15.24 (7.49–31.04) 16.75 (8.49–33.05) 5.62 (3.02–10.47)
Change, % 1.0 1.3 0.9 0.8 0.2 0.7 0.0 −0.3
Model 14
Socio-environmental factors 4.02 (2.43–6.65) 4.36 (1.84–10.36) 4.48 (1.74–11.58) 3.17 (1.46–6.91) 8.96 (6.05–13.27) 12.20 (5.96–24.95) 11.71 (5.81–23.61) 4.60 (2.48–8.53)
(M2–M6) change, % 36.7 25.5 48.1 29.3 25.2 22.0 32.1 21.8
Model 15
Psychological factors 2.83 (1.72–4.68) 2.55 (1.04–6.21) 3.99 (1.62–9.81) 1.88 (0.87–4.09) 4.48 (2.98–6.74) 5.43 (2.49–11.84) 6.63 (3.32–13.22) 2.35 (1.24–4.46)
(M7–M9) change, % 61.6 65.8 55.5 71.3 67.3 69.1 64.3 70.7
Model 16
Health-related factors 3.71 (2.27–6.08) 3.58 (1.52–8.48) 5.17 (2.09–12.77) 2.40 (1.14–5.06) 7.84 (5.26–11.67) 10.03 (4.9–20.56) 11.79 (5.94–23.39) 3.66 (1.93–6.96)
(M10–M13) change, % 43.2 42.8 37.9 54.4 35.7 37.0 31.6 42.2
Model 17
All adjusted 1.86 (1.09–3.18) 1.75 (0.69–4.44) 2.60 (0.99–6.86) 1.34 (0.57–3.18) 3.49 (2.30–5.28) 4.29 (1.95–9.42) 5.06 (2.46–10.38) 1.81 (0.94–3.49)
(M1–M13) change, % 82.0 83.5 76.1 88.9 76.6 77.1 74.3 82.4
P value for difference 0.001
Change was calculated by [OR(Model 1) − OR(Explanatory Model)]/[OR(Model 1) − 1] × 100.
OR = odds ratio.
Associations between other covariables (e.g., low education, low income, low trust, stress, depression, poor self-rated health, smoking, and drinking) and suicide ideation/attempt were observed in both men and women after accounting for all variables (Supplementary Table 1).

DISCUSSION

This study explored and identified negative associations of happiness, in the expected direction, with the risk of suicide ideation/attempt in the general population in Korea. The associations between unhappiness and suicide ideation/attempt appeared to be stronger in younger rather than older adults. Among potential explanatory factors for the association between unhappiness and suicide ideation/attempt, psychological factors contributed most to the explanation of the association across all age groups and both genders. Furthermore, the contribution of socio-environmental factors for the association was found to be higher among individuals aged 40–59 years compared to those aged 20–39 and 60 years and older. Health-related factors had a higher influence among individuals aged 60 years and older compared to those aged 20–39 years. Altogether, after adjusting for socio-environmental, psychological, and health-related factors, the associations were reduced by about 60% for suicide ideation and 80% for suicide attempt, respectively, in both genders.
This study showed that unhappiness was associated with suicide ideation/attempt, which aligns with previous studies.2820363738 According to an economic theory of suicide based on the intertemporal choice theory, people may consider or attempt suicide when they perceive that the utility of continuing to live does not exceed the utility of killing themselves in the future.9 Conversely, individuals with high utility may have a lower risk of suicide as they have more to lose.9 Given that happiness may be defined as a feeling of satisfaction with life,20 people may perceive being happy as the important utility of continuing to live. Recently, as society undergoes more socioeconomic development, there has been a greater focus on improving well-being or happiness rather than only focusing on economic growth.39 This shift might be associated with psychological changes that, in turn, should impact the utility of continuing to live. Particularly, our age-stratified analyses showed that associations between unhappiness and suicide ideation/attempt appeared to be stronger in younger rather than older adults. Although average scores and prevalence of happiness were higher in individuals aged 20–39 and 40–59 years compared to those aged 60 years and older (Supplementary Table 2), the gap in prevalence of suicide ideation/attempt between those aged 20–39 and 40–59 years in the happy and unhappy groups was greater compared to those aged 60 years and above. This suggests that individuals aged 20–39 and 40–59 years may have a stronger aspiration of being happy. Younger generations in Korea often describe Korea as a country where experiences of constant social pressure have led to anxiety and frustration, making them feel more stressed and in despair.4041 Thus, well-being and work-life balance have gradually become more important under social pressure, particularly among the younger generations.42 Our study found that psychological factors play an important role in explaining the associations between unhappiness and suicide ideation/attempt across all age groups, which is consistent with a previous study.20 When individuals experience heightened unhappiness, it may worsen stress levels, leading to poor mental health conditions. Alternatively, poor mental health conditions may exacerbate unhappiness, suggesting both may contribute to suicide ideation and attempt as a way to resolve conflict.43 Given that the pathways could be associated with psychological distress, such as stress and depression, unhappiness might be an early sign of future poor mental health conditions or the beginning of suicide ideation or behaviour,20 indicating that psychological support needs to be provided appropriately. It might be also important to consider monitoring and improving population mental health, resulting in increased happiness and less suicide behaviour. A self-reported measure of happiness could provide information on population mental health and suicide risk that may otherwise have remained unnoticed, particularly among younger adults.
Other different factors explained associations between happiness and suicide ideation/attempt across different age groups. The contribution of socio-environmental factors for the association was found to be greater among individuals aged 40–59 years compared to those aged 20–39 and 60 years and older, suggesting that individuals aged 40–59 years, the main active economic population, may take on greater economic pressures, particularly income, mostly because they may support their family and parents. For health-related factors, particularly, the contribution of subjective health status to the association between unhappiness and suicide ideation/attempt was higher among individuals aged 60 years and older compared to those aged 20–39 years. Previous studies identified subjective health status was associated with happiness among older adults,444546 suggesting that they may perceive health as an important consideration of being happy. Socio-environmental and health-related factors may also be important to explain the association between happiness and suicide ideation/attempt among certain groups.
Although this study included several associated factors of happiness and suicide ideation/attempt, the associations between unhappiness and suicide ideation/attempt statistically remained after full adjustments. It suggests that unhappiness is independently associated with suicide ideation/attempts, or other factors not included in this study but potentially important should be considered in further studies. For example, the purpose in life or meaning of life was associated with life satisfaction and suicide ideation/attempt, particularly among youths previously in other studies.4748
To our knowledge, little research was conducted on the association between unhappiness and suicide ideation/attempt and no study has combined three groups of explanatory factors to explain the association between unhappiness and suicide ideation/attempt among the general population20 using individual-level data. The strengths of the current study include the use of nationally representative data for the general population in Korea and the availability of several measures of explanatory factors associated with unhappiness and suicide ideation/attempt. Furthermore, the large sample size may allow gender and age-stratified analyses. However, there are some methodological limitations in this study. As this study is a cross-sectional study design, it may constrain the inference of causal relationships between happiness and suicide ideation/attempt. Although a self-reported happiness measurement was widely used among several countries and international organizations, its contexts and dimensions may vary across different individuals,20 suggesting that understanding happiness might be challenging when using a single self-reported question because reports of happiness could be biased by social desirability or selective recall. Other social and psychological factors (i.e., social network, social support, subjective economic condition, purpose in life, and hopelessness) were not included in our analysis due to limited data. Further investigation should be necessary to better understand happiness and suicide behaviour, considering these methodological limitations.
The current findings found that individuals who perceive themselves as unhappy were more likely to have suicide ideation/attempt across all age groups. Improving population happiness and decreasing suicide behaviour may not be determined by one single risk factor,4950 as they are considered to be the result of an interrelationship among several factors, including socio-environmental, psychological, and health-related factors. Improving the population mental health could play an important role in increasing happiness and preventing suicide behaviour. Socio-environmental and health-related factors also should be considered as important contributors to the association between unhappiness and suicide ideation/attempt. Additionally, further investigation should be necessary to better understand the interrelationship among potential explanatory factors.

Notes

Funding: Yo Han Lee was supported by grants from Korea University (2022). Minjae Choi was supported by grants from the National Research Foundation (NRF) of Korea funded by the Ministry of Education (grant number: NRF-2022R1A6A3A01086222). These funding bodies played no role of design, collection, analyses and interpretation of the data.

Disclosure: The authors have no potential conflicts of interest to disclose.

Author Contributions:

  • Conceptualization: Choi M, Lee YH.

  • Data curation: Choi M, Sempungu JK, Lee YH.

  • Formal analysis: Choi M, Sempungu JK, Lee YH.

  • Investigation: Choi M, Sempungu JK.

  • Visualization: Choi M, Kim MH, Han J.

  • Writing - original draft: Choi M, Sempungu JK, Lee YH.

  • Writing - review & editing: Choi M, Kim MH, Han J.

References

1. Graham C, Ruiz Pozuelo J. Happiness, stress, and age: how the U curve varies across people and places. J Popul Econ. 2017; 30(1):225–264.
2. Hsu CY, Chang SS, Yip PS. Subjective wellbeing, suicide and socioeconomic factors: an ecological analysis in Hong Kong. Epidemiol Psychiatr Sci. 2019; 28(1):112–130. PMID: 29633681.
3. Delhey J. From materialist to post-materialist happiness? National affluence and determinants of life satisfaction in cross-national perspective. Soc Indic Res. 2010; 97(1):65–84.
4. Inglehart R, Foa R, Peterson C, Welzel C. Development, freedom, and rising happiness: a global perspective (1981–2007). Perspect Psychol Sci. 2008; 3(4):264–285. PMID: 26158947.
5. World Happiness Report. About World Happiness Report. Updated 2023. Accessed October 20, 2023. https://worldhappiness.report/about/ .
6. Weerasinghe J, Tepperman L. Suicide and happiness: seven tests of the connection. Soc Indic Res. 1994; 32(3):199–233.
7. Daly MC, Wilson DJ. Happiness, unhappiness, and suicide: an empirical assessment. J Eur Econ Assoc. 2009; 7(2-3):539–549.
8. Bray I, Gunnell D. Suicide rates, life satisfaction and happiness as markers for population mental health. Soc Psychiatry Psychiatr Epidemiol. 2006; 41(5):333–337. PMID: 16565916.
9. Case A, Deaton A. Suicide, age, and well-being: an empirical investigation. Wise DA, editor. Insights in the Economics of Aging. Chicago, IL, USA: University of Chicago Press;2015. p. 307–334.
10. Hsu CY, Chang SS, Gunnell D. Suicide and happiness: the association between two potential sustainable development goal indicators for mental health. J Clin Psychiatry. 2020; 81(6):20364.
11. Dadfar M, Lester D, Abdel-Khalek AM. Religiosity, happiness and suicidal behaviour: a cross-sectional comparative study in Iran. Ment Health Relig Cult. 2021; 24(2):128–141.
12. Lee KS, Lee KH. The effect of mental health, self-efficacy, and happiness on suicidal ideation. J Korea Contents Assoc. 2017; 17(5):677–685.
13. Nam MH, Kim HO, Kwon YC. Factors influencing subjective happiness index of health behavior, smart phone addiction, suicidal ideation among college students. J Digit Policy Manag. 2013; 11(10):557–569.
14. Pompili M, Innamorati M, Lamis DA, Lester D, Di Fiore E, Giordano G, et al. The interplay between suicide risk, cognitive vulnerability, subjective happiness and depression among students. Curr Psychol. 2016; 35(3):450–458.
15. Poursharifi H, Habibi M, Zarani F, Ashouri A, Hefazi M, Hajebi A, et al. The role of depression, stress, happiness and social support in identifying suicidal thoughts in students. Iran J Psychiatry Clin Psychol. 2012; 18(2):99–107.
16. Minkov M, Schachner M, Sanchez C, Morales O. A new worldwide measure of happiness explains national differences in suicide rates and cigarette consumption. Cross-Cultural Res. 2019; 53(4):355–384.
17. Pendergast PM, Wadsworth T, Kubrin CE. Suicide in happy places: is there really a paradox? J Happiness Stud. 2019; 20(1):81–99.
18. Daly MC, Oswald AJ, Wilson D, Wu S. Dark contrasts: the paradox of high rates of suicide in happy places. J Econ Behav Organ. 2011; 80(3):435–442.
19. Park N, Peterson C. Suicide in happy places revisited: the geographical unit of analysis matters. Appl Psychol Health Well-Being. 2014; 6(3):318–323. PMID: 24978186.
20. Koivumaa-Honkanen H, Honkanen R, Koskenvuo M, Kaprio J. Self-reported happiness in life and suicide in ensuing 20 years. Soc Psychiatry Psychiatr Epidemiol. 2003; 38(5):244–248. PMID: 12719839.
21. Azizi M, Mohamadian F, Ghajarieah M, Direkvand-Moghadam A. The effect of individual factors, socioeconomic and social participation on individual happiness: a cross-sectional study. J Clin Diagn Res. 2017; 11(6):VC01–VC04.
22. Gerdtham UG, Johannesson M. The relationship between happiness, health, and socio-economic factors: results based on Swedish microdata. J Socio-Econ. 2001; 30(6):553–557.
23. Doherty AM, Kelly BD. Social and psychological correlates of happiness in 17 European countries. Ir J Psychol Med. 2010; 27(3):130–134. PMID: 30282201.
24. Sujarwoto S, Tampubolon G, Pierewan AC. Individual and contextual factors of happiness and life satisfaction in a low middle income country. Appl Res Qual Life. 2018; 13(4):927–945.
25. Favril L, Yu R, Geddes JR, Fazel S. Individual-level risk factors for suicide mortality in the general population: an umbrella review. Lancet Public Health. 2023; 8(11):e868–e877. PMID: 37898519.
26. Cheng AT, Chen TH, Chen CC, Jenkins R. Psychosocial and psychiatric risk factors for suicide. Case-control psychological autopsy study. Br J Psychiatry. 2000; 177(4):360–365. PMID: 11116779.
27. McLean J, Maxwell M, Platt S, Harris FM, Jepson R. Risk and Protective Factors for Suicide and Suicidal Behaviour: A Literature Review. Edinburgh, Scotland: Scottish Government;2008.
28. World Health Organization (WHO). Suicide rates. Updated 2023. Accessed August 15, 2023. https://www.who.int/data/gho/data/themes/mental-health/suicide-rates .
29. Helliwell JF, Layard R, Sachs JD, De Neve JE. World Happiness Report 2020. New York, NY, USA: Sustainable Development Solutions Network;2020.
30. Kang YW, Ko YS, Kim YJ, Sung KM, Kim HJ, Choi HY, et al. Korea community health survey data profiles. Osong Public Health Res Perspect. 2015; 6(3):211–217. PMID: 26430619.
31. Kroenke K, Spitzer RL, Williams JB. The PHQ-9: validity of a brief depression severity measure. J Gen Intern Med. 2001; 16(9):606–613. PMID: 11556941.
32. Park SJ, Choi HR, Choi JH, Kim K, Hong JP. Reliability and validity of the Korean version of the Patient Health Questionnaire-9 (PHQ-9). Anxiety Mood. 2010; 6(2):119–124.
33. Chun H, Khang YH, Kim IH, Cho SI. Explaining gender differences in ill-health in South Korea: the roles of socio-structural, psychosocial, and behavioral factors. Soc Sci Med. 2008; 67(6):988–1001. PMID: 18632197.
34. Khang YH, Lynch JW, Yang S, Harper S, Yun SC, Jung-Choi K, et al. The contribution of material, psychosocial, and behavioral factors in explaining educational and occupational mortality inequalities in a nationally representative sample of South Koreans: relative and absolute perspectives. Soc Sci Med. 2009; 68(5):858–866. PMID: 19121885.
35. Richter M, Moor I, van Lenthe FJ. Explaining socioeconomic differences in adolescent self-rated health: the contribution of material, psychosocial and behavioural factors. J Epidemiol Community Health. 2012; 66(8):691–697. PMID: 21543387.
36. Choi YS, Shin HK, Hong DY, Kim JR, Kang YS, Jeong B, et al. Self-esteem as a moderator of the effects of happiness, depression, and hostility on suicidality among early adolescents in Korea. J Prev Med Public Health. 2019; 52(1):30–40. PMID: 30742759.
37. Li Y, Kwok SY. A longitudinal network analysis of the interactions of risk and protective factors for suicidal potential in early adolescents. J Youth Adolesc. 2023; 52(2):306–318. PMID: 36334177.
38. Bryan CJ, Bryan AO, Kopacz MS. Finding purpose and happiness after recovery from suicide ideation. J Posit Psychol. 2021; 16(1):46–53.
39. Sarracino F. When does economic growth improve well-being?. Rojas M, editor. The Economics of Happiness: How the Easterlin Paradox Transformed Our Understanding of Well-being and Progress. Berlin, Germany: Springer;2019. p. 355–370.
40. Kim J. The factors affecting the level of awareness of life and happiness perceived by youth generation. Korea Soc Policy Rev. 2018; 25(3):209–245.
41. Park CR, Han CK. The effect of social trust on depression among young adults: focusing on gender differences. Health Soc Welf Rev. 2023; 43(1):141–156.
42. Park MS, Kim MY, Kim KA, Chun J. Factors of the happiness of youth generations by work-life balance: a cross-national comparison utilizing the Better Life Index and World Value Survey. J Fam Resour Manage Policy Rev. 2019; 23(2):79–97.
43. Cutler DM, Glaeser EL, Norberg KE. Explaining the rise in youth suicide. Gruber J, editor. Risky Behavior Among Youths: An Economic Analysis. Chicago, IL, USA: University of Chicago Press;2001. p. 219–270.
44. Angner E, Ray MN, Saag KG, Allison JJ. Health and happiness among older adults: a community-based study. J Health Psychol. 2009; 14(4):503–512. PMID: 19383651.
45. Angner E, Ghandhi J, Williams Purvis K, Amante D, Allison J. Daily functioning, health status, and happiness in older adults. J Happiness Stud. 2013; 14(5):1563–1574.
46. Maximiano-Barreto MA, Leal LR, Pessoa RM, Bomfim AJ, Morais D, Luchesi BM, et al. Factors associated with happiness among community-dwelling older adults: a systematic review. Geriatr Nurs. 2024; 56:124–137. PMID: 38340433.
47. Pérez Rodríguez S, Marco Salvador JH, García-Alandete J. The role of hopelessness and meaning in life in a clinical sample with non-suicidal self-injury and suicide attempts. Psicothema. 2017; 29(3):323–328. PMID: 28693701.
48. Heisel MJ, Flett GL. Purpose in life, satisfaction with life, and suicide ideation in a clinical sample. J Psychopathol Behav Assess. 2004; 26(2):127–135.
49. Kim EY, Jeong YW, Lim J, Kang DR. Factors related to suicidal ideation by gender and age group in Korean adults. J Korean Med Sci. 2023; 38(49):e376. PMID: 38111279.
50. Seol R, Chun JH. Difference of associating factors of happiness index among Korean adults by life cycle age brackets. Public Health Wkly Rep. 2023; 16(26):817–836.

SUPPLEMENTARY MATERIALS

Supplementary Table 1

Multivariate association between happiness and suicide ideation/attempt by gender
jkms-39-e283-s001.doc

Supplementary Table 2

Weighted average scores (standard error) and prevalence (95% confidence intervals) of happiness by gender and age group
jkms-39-e283-s002.doc
TOOLS
Similar articles