

 PDF
PDF Citation
 Print
Print


INTRODUCTION
Sarcopenia, termed as ‘anorexia of aging,’ was defined by Irwin Rosenberg in 1989 [1]. Irwin Rosenberg defined sarcopenia as the decline in muscle mass associated with aging, where in a healthy person, from 35 years of age, there is an annual loss of muscle mass at the rate of 1–2% [2]. The current diagnosis for sarcopenia includes loss of muscle mass or/and muscle function, measured by muscle strength and physical performance [13]. Though various research has been done on sarcopenia, consensus on the universal operational definition for muscle mass loss and sarcopenia is still lacking [1]. Various operational definitions have been established by groups such as the European Working Group on Sarcopenia in Older People (EWGSOP), the International Working Group on Sarcopenia, the Asian Working Group of Sarcopenia (AWGS) and the Foundation of National Institutes of Health Sarcopenia Project [4567]. Though various existing operational definitions use both loss of muscle mass and muscle function to define sarcopenia, for measuring muscle mass loss, the lean muscle mass is generally corrected for factors such as height or body mass [8]. The loss in muscle mass alone is defined as ‘pre-sarcopenia’ by EWGSOP [4].
In a healthy adult, from the age of 25, there is a progression decline in the number of muscle fibers and decrease in the size of muscle. This decline is associated with muscle mass loss. Various non-modifiable factors such as age, gender and ethnicity and modifiable factors such as alcohol consumption, sedentary lifestyle and inflammation predisposes an individual to higher risks of muscle mass loss [249]. Studies have shown that intake of energy, protein, vitamin D, and a healthy diet that can provide enough antioxidants, such as vitamin E, vitamin C, selenium, and carotenoids, will be beneficial in preventing muscle mass loss [21011]. Understanding the role of nutrition on muscle mass loss is incomplete, with only the effect of individual nutrients addressed, as there might be possible synergistic interactions between dietary nutrients [1213]. Different studies have investigated the interaction of various dietary patterns with muscle mass, strength and function loss. Among community-dwelling elderly Chinese men, high consumption of ‘vegetables/fruits’ was associated with a low risk of sarcopenia, defined as decreased muscle mass, strength and function [14]. Among Iranian menopausal women, ‘Mediterranean’ dietary pattern was not associated with reduced risk of muscle mass loss, but was associated with reduced risk of sarcopenia, defined as muscle mass and strength loss [15]. Furthermore, in Korean elderly, using cluster analysis, a ‘Westernized Korean’ dietary cluster, consisting of white rice, noodles, dumplings, and meat, was associated with ‘abnormalities of muscle mass,’ defined as appendicular skeletal muscle mass (ASM) corrected for body weight less than 1 standard deviation (SD) of the young reference group aged 20 to 39 years [16].
However, the dietary pattern associated with an increased risk of muscle mass loss among postmenopausal Korean women has not yet been studied. Though muscle loss associated with aging is higher in men, women suffer more because of higher life expectancy [117]. Furthermore, compared with the gradual loss of muscle mass in men, women have a sharp decline in muscle mass after menopause [1]. The decrease in estrogen associated with menopause can cause redistribution of the subcutaneous fat and reduction of contractile muscle units by approximately 50% [18]. Further the role of estrogen in regulation of inflammation might also be involved in preservation of muscle mass [18]. Therefore, in this study, we examined the associations between dietary patterns derived by factor analysis and lean muscle mass, in Korean postmenopausal women, using the Korea National Health and Nutrition Examination Survey (KNHANES) data.
SUBJECTS AND METHODS
Data collection
This study used the data from the fourth (2008–2009) and fifth (2010–2011) KNHANES. The KNHANES is an ongoing cross-sectional, multi-stage, clustered probability design surveillance study of the Korean population conducted by the Korea Centers for Disease Control and Prevention (KCDC) every year. The survey is divided into 3 parts; a health interview, a health examination, and a nutrition interview. The Institutional Review Board of the KCDC (2008-04EXP-01-C, 2009-01CON-03-2C, 2010-02CON-06-C, and 2011-02CON-06-C) approved this study, and the written informed consent was obtained from all the subjects. The data is publicly available and detailed information on the survey can be found at http://knhanes.cdc.go.kr.
Study subjects
The total participants in the 2008–2011 survey was 37,753. The men (n = 17,300) and premenopausal women (n = 6,410) were excluded from the study. Participants having diseases that affect muscle health, such as rheumatoid arthritis or osteoarthritis, renal failure, liver disease, hepatitis (types B and C), thyroid dysfunction, diabetes, stroke, and cancer (n = 2,133), and those who had undergone ovariectomy or hormone replacement therapy (n = 324), with missing data on dual-energy X-ray absorptiometry (DEXA) (n = 4,069) and body mass index (BMI; n = 4), and consuming an energy intake of < 500 or > 5,000 kcal/day (n = 20), were excluded. Additionally, participants (n = 4,150) with missing data on other covariates, such as physical activity (n = 4,150) and smoking status (n = 3) were excluded. This study included healthy postmenopausal women aged 45–86 years (n = 1,548).
Anthropometric assessment
Data on demographic and socioeconomic characteristics, including age, BMI, residential area, education level, household income, smoking status, alcohol consumption, physical activity, and dietary supplement use, were collected from the KNHANES health interview and health examination survey. Height was measured to the nearest 0.1 cm unit, and weight was measured to the nearest 0.1 kg unit. BMI was calculated as the weight (kg)-to-height2 (m2) ratio. Educational level was divided into 4 categories: elementary or lower, middle school, high school, and college or above. Household income was categorized into low, middle–low, middle–high, and high. Smoking status was divided into 3 categories: non-smoker, past smoker, and current smoker, during the past 1 year. Alcohol consumption was assessed in 5 categories: never, < 1 drink/month, 1 drink/month, 2–4 drinks/month, and ≥ 4 drinks/month, during the past 1 year. The physical activity level was measured using the International Physical Activity Questionnaire (IPAQ) [19]. The metabolic equivalent task (MET) score for physical activity was calculated as the sum of walking MET-min/week, moderate MET-min/week, and vigorous MET-min/week [19]. The calculations for walking MET-min/week, moderate MET-min/week, and vigorous MET-min/week, include walking MET-min/week = 3.3 × walking min × walking days, moderate MET-min/week = 4.0 × moderate-intensity activity min × moderate-intensity days, and vigorous MET-min/week = 8.0 × vigorous-intensity activity min × vigorous-intensity days, as described by the IPAQ guidelines [19]. The supplement use was assessed by 2 categories: yes or no.
Dietary assessment
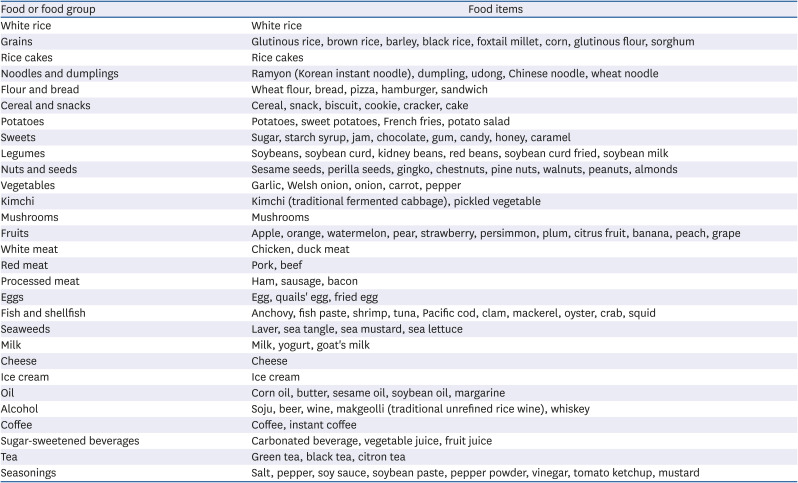
The dietary intake data were collected using the 1-day 24-h dietary recall method. The interviewers trained by the KCDC collected the dietary data. During the face-to-face interview, the participants reported all the food items and drinks consumed the previous day. Food items from the 1-day 24-h recall data were combined into 29 food groups, based on the common food groups classified in the Korean Nutrient Database [20]. Six additional food groups were added in this study. The meat and meat products were divided into 3 categories: white meat, red meat, and processed meat since the type of meat has been shown to be differentially associated with oxidative stress and adversely affect muscle mass and muscle strength [1221]. The milk and dairy products were divided into milk, cheese, and ice cream, to differentiate between high- and low-fat dairy products [22]. The beverages were divided into 4 categories: tea, coffee, sugar-sweetened beverages, and alcohol. The grain and grain products group was divided into white rice, grains, rice cakes, noodle and dumplings, flour and bread, and cereal and snacks. The total intake of vegetables was separated into vegetables and kimchi. Kimchi includes fermented cabbage and other pickles, which are consumed daily as side dishes by Koreans. The weight differences that exist between solid and liquid foods were corrected by expressing the food groups as a percentage of energy. Table 1 shows the food groupings that were used for the dietary pattern analysis. Also, the intake of energy and ten nutrients were estimated.
Table 1
Food groupings used in the factor analysis
Lower lean muscle mass definition
The lean soft tissue mass was measured using DEXA (Discovery-W, QDR 4500A; Hologic, Inc., Waltham, MA, USA). The ASM (kg) was calculated as the sum of lean soft tissue mass of arms and legs. ASM corrected for body weight was used to define lower lean mass. The ASM/weight (%) value less than 1 SD in the young reference group (participants of KNHANES IV and V) aged 20 to 39 years was used as the cut-off value to categorize the subjects as having lower lean mass or not [232425]. The ASM/weight (%) cut-off values was 23.8% for women in this study. Using this definition, the prevalence of lower muscle mass was 31.3% in the current study.
Statistical analysis
Using the 29 food groups based on the 1-day 24-h recall, the dietary pattern was derived using factor analysis with the FACTOR PROCEDURE and VARIMAX functions. Eigenvalues, scree plot, and interpretability were considered for determining the number of factors for the analysis. An eigenvalue greater than 1.2 was used for determining the number of factors. Food groups with a factor loading value > 0.3 or < −0.3 were considered significant. The study participants were categorized into tertiles for each of the factors in the dietary pattern analysis. For each factor, the differences in general characteristics were analyzed using the SURVEY FREQ procedure for categorical variables or SURVEY MEAN procedure for continuous variables. The significant differences in nutrients intake and carotenoids intake across the tertiles in each dietary pattern score were investigated using SURVEY REG. SURVEY LOGISTIC analysis was performed to estimate the odds ratio (OR) and 95% confidence intervals (CIs) for lower lean mass across tertiles of each dietary pattern score, where the lowest tertile was set as the reference. Model 1 was adjusted for age and BMI, and model 2 was adjusted for model 1 plus education level, residential area, physical activity, dietary supplement use, and energy intake. All statistical analyses were performed using SAS software version 9.4 (SAS Institute, Cary, NC, USA).
RESULTS
Dietary patterns by factor analysis
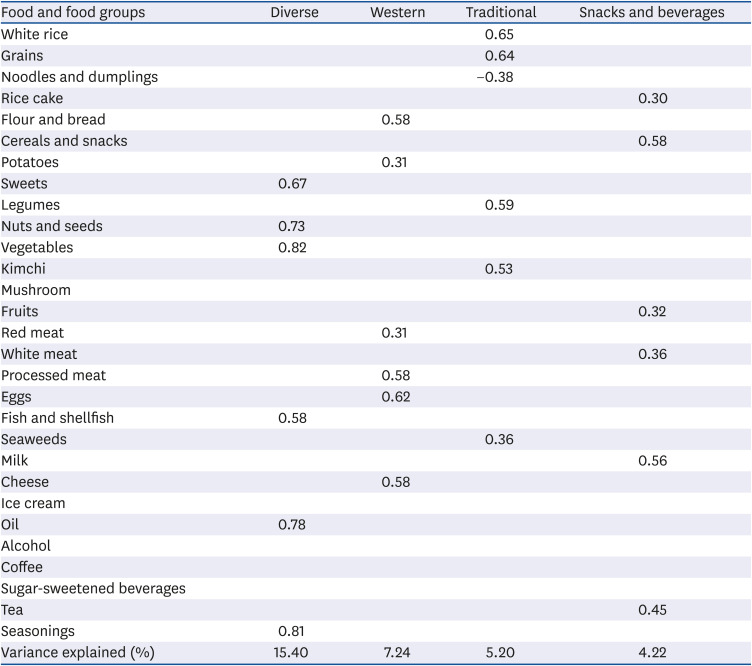
Table 2 gives the 4 dietary patterns identified by factor analysis. The dietary patterns are labeled as ‘Diverse’, ‘Western’, ‘Traditional’, and ‘Snacks and beverages’. The ‘Diverse’ pattern had the highest loadings for sweets, nuts and seeds, vegetables, fish and shellfish, and oil. The ‘Western’ pattern had the highest factor loadings for flour and bread, potatoes, red meat, processed meat, eggs, and cheese. The ‘Traditional’ pattern had the highest factor loadings for white rice, grains, legumes, kimchi and seaweeds, and a negative loading for noodles and dumplings. The ‘Snacks and beverages’ pattern had the highest factor loadings for rice cake, cereals and snacks, fruits, white meat, milk, and tea. The total variation of food intakes explained by the 4 dietary patterns was 32.0%. Each dietary pattern score was divided into tertiles.
Table 2
Factor loading matrix for the 4 dietary patterns in postmenopausal women (n = 1,548), the Korea National Health and Nutrition Examination Survey 2008–2011
General characteristics of the study participants according to dietary pattern
Table 3 provides the general characteristics of the subjects across tertiles of the dietary pattern scores. Postmenopausal women in the highest tertile of the ‘Diverse’ dietary pattern were defined as having lower age, educational status, and lower alcohol consumption. Instead, being in the highest tertile of the ‘Western’ dietary pattern was associated with having higher educational status, being a resident of an urban location, and being a supplement user. The women in the highest tertile of the ‘Snacks and beverages’ pattern were more likely to be younger, have a higher education status, be a resident of an urban location, and be a supplement user.
Table 3
General characteristics of the postmenopausal women (n = 1,548) across tertiles of dietary pattern scores
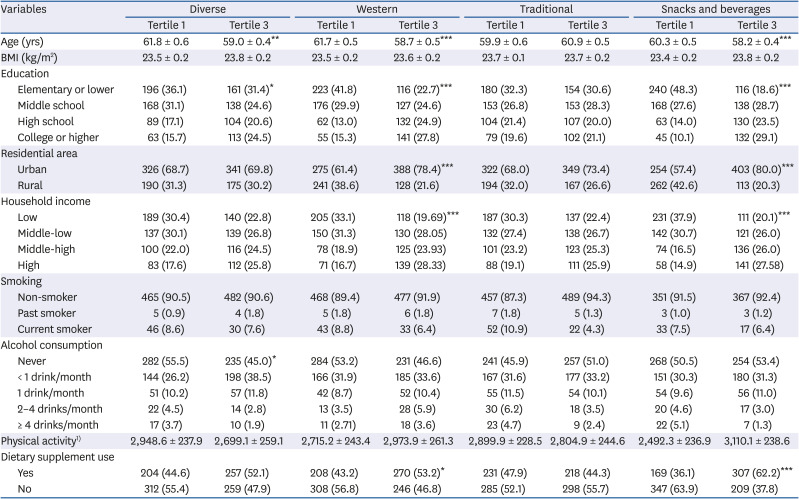
Values are mean ± SE or number (%). P-value was obtained from the generalized linear model for continuous variables and χ2 test for categorical variables.
BMI, body mass index.
*P < 0.05, **P < 0.01, ***P < 0.001.
1)Physical activity was measured by metabolic equivalent tasks, using the International Physical Activity Questionnaire.
Nutrients intake of the study participants according to dietary pattern
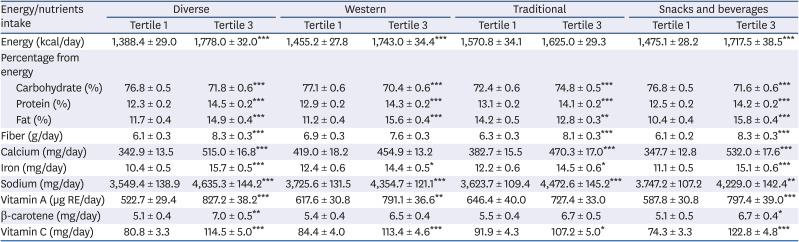
Table 4 gives the mean values of nutrients intakes across the tertiles of dietary pattern scores. Postmenopausal women with higher scores for the ‘Diverse’ dietary pattern had a higher intake of energy, energy from protein and fat, and nutrients, such as calcium, vitamin A, vitamin C, and β-carotene, and lower intakes of energy from carbohydrates. Postmenopausal women with higher scores for the ‘Western’ pattern had a higher intake of energy and energy from protein and fat, whereas fiber, calcium, and β-carotene consumption was not associated with a high intake of this dietary pattern. Postmenopausal women with higher scores for the ‘Traditional’ dietary pattern had a lower intake of energy from fat, and a higher intake of energy from carbohydrate and fat, calcium, vitamin A, and β-carotene. Postmenopausal women with the ‘Snacks and beverages’ dietary pattern had lower intakes of energy from carbohydrates and higher intakes of energy from protein and fat, and nutrients, such as calcium, vitamin A, vitamin C, and β-carotene.
Table 4
Mean energy, and nutrient intake of the postmenopausal women (n = 1,548) across tertiles of dietary pattern scores
Dietary pattern and risk of lower lean mass
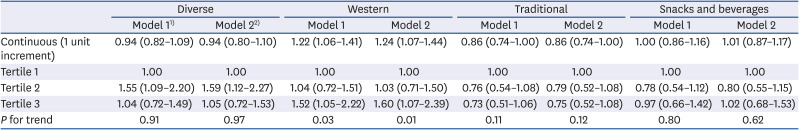
Table 5 presents the ORs and 95% CIs for lower lean mass across tertiles. The highest tertile of the ‘Western’ pattern was significantly associated with a 60% higher risk of lower lean muscle mass (OR [95% CI] = 1.60 [1.07–2.39], P for trend = 0.01). A one-unit increment in ‘Western’ pattern scores was linked to a significant 24% higher risk of lower lean muscle mass (OR [95% CI] = 1.24 [1.07–1.44]) after multivariate adjustment. The other 3 patterns were not associated with risk of lower lean muscle mass.
Table 5
Odds ratios and confidence intervals for lower muscle mass across tertiles of dietary pattern scores in postmenopausal women (n = 1,548)
DISCUSSION
In this study, using the fourth and fifth KNHANES data, the association between dietary pattern and risk of lower lean muscle mass in postmenopausal Korean women was investigated. The traditional method of understanding the role of dietary intake in the development of disease focuses on the intake of nutrients or food groups [26]. However, these situations ignore the interactions between the different dietary components [26]. Food groups tend to cluster together, as identified by dietary patterns, rather than as independent items [13]. Thus, dietary pattern analysis aims to measure the dietary intake of food combinations [27]. In this study of Korean postmenopausal women, 4 major dietary patterns were identified: ‘Diverse,’ ‘Western,’ ‘Traditional,’ and ‘Snacks and beverages’. The ‘Western’ dietary pattern, consisted of flour and bread, potatoes, red meat, processed meat, eggs, and cheese was significantly associated with a higher risk of lower lean muscle mass, whereas the other 3 patterns were not associated with a risk of lower lean muscle mass.
Oh et al. [16] found that in comparison with the ‘Traditional Korean’ dietary cluster, the ‘Westernized Korean’ dietary cluster was significantly associated with a 74% higher risk of abnormalities in ASM adjusted for weight in Korean elderly. The ‘Westernized Korean’ cluster consisted of a higher percentage of energy from white rice, noodles and dumplings, meat, and beverages [16]. Among UK men older than 85 years, using the 24-h dietary recall data, the ‘high red meat’ dietary pattern in comparison with ‘low meat pattern’ was positively associated with lower grip strength (β = −0.92, P-value = 0.05) [12]. Several other existing studies have shown that dietary patterns, such as ‘Vegetables–fruits’ and ‘Mediterranean’, and the ‘Poultry’ and ‘Healthy’ dietary clusters were associated with a lower risk of sarcopenia [142829]. On the contrary, the ‘Alcoholic beverage’ cluster, identified using the 24-h recall data, was associated with a higher risk of sarcopenia [29]. Chan et al. [14] found the ‘Vegetables–fruits’ pattern was associated with a lower risk (OR [95% CI] = 0.60 [0.36–0.99]) of sarcopenia in Chinese older adults living in Hong Kong. Among Iranian older adults, the ‘Mediterranean’ dietary pattern, which consisted of high carotenoid fruit, high carotenoid vegetables, low carotenoid vegetables, tomatoes, dried fruits and nuts [22] was associated with a lower risk of sarcopenia (OR [95% CI] = 0.40 [0.17–0.97]) [22]. Thus, being a rich source of antioxidants, the ‘Vegetables–fruits’ pattern and ‘Mediterranean’ dietary pattern could have lowered the risk of sarcopenia, by ameliorating inflammation [22].
Oxidative stress and inflammatory cytokines have been identified as 2 of the major risk factors for the muscle mass and strength loss [21030]. In the older adults, reductions in muscle strength and physical performance were associated with oxidative damage and pro-inflammatory cytokines [231]. Oxidative stress can cause damage to proteins and lead to accumulation of protein carbonyls in muscle mass [10323334]. Conversely, inflammatory cytokines caused a decline in muscle mass through increased muscle protein catabolism and decreased muscle protein synthesis [30]. In elderly Korean women, 5 or more servings of vegetables were associated with a lower risk of lower lean muscle mass (OR [95% CIs] = 0.52 [0.30–0.89]) [35]. In addition, the highest quintile of fruit and vegetable consumption was associated with a 68% lower risk of lower lean mass in older Korean men [36]. Fruits and vegetables are rich sources of antioxidants, and this might explain their link to a reduced risk of muscle mass loss [10]. Furthermore, among older adults in the UK, increased consumption of fatty fish was associated with increased grip strength and might be due to the high content of omega-3 fatty acids in the fatty fish [37]. Omega-3 fatty acids are well known for their role as anti-inflammatory agents [37]. Thus, food groups that are rich sources of antioxidants or having anti-inflammatory properties have been shown to be protective against muscle mass loss.
A high intake of macronutrients contributes to high levels of oxidative stress associated with the cell signaling pathways mediated by nuclear factor-kappa B [2138]. Various other dietary factors that are associated with higher oxidative stress include a high intake of sodium and calories, either in the form of carbohydrate or fat [2139]. Though meat products are good sources of protein, processed meat products are sources of N-nitroso compounds and cause oxidative stress [21]. One of the components in the ‘Western’ dietary pattern was cheese. In general, cheese products are high in fat. Mozzarella cheese made from whole fresh milk contains around 10 g of fat per 50 g serving, and 50 g of cheddar cheese contains 16.6% fat [40]. The percentage difference in energy from fat between the highest and lowest tertile in our study subjects was 39.18%. In the UK, meat and meat products contribute to 27% sodium intake, second to cereals and cereal products, which contribute to 31% of sodium intake [41]. The sodium intake was significantly higher in the highest tertile of ‘Western’ pattern. As mentioned above, a high intake of fat and sodium is associated with increased oxidative stress [39]. Additionally, the percentage difference in intake of fiber, and antioxidant nutrients, such as β-carotene, between the highest and lowest tertile was non-significant only in the ‘Western’ dietary pattern. Animal studies have shown that high fiber intake is associated with reduced levels of inflammatory markers, such as plasma tumor necrosis factor-α [42]. The decline in estrogen levels with menopause also augments the levels of proinflammatory cytokines in the body [64344]. Thus, ‘Western’ pattern might have been related to a higher risk for lower lean muscle mass, by increasing oxidative stress.
In the AWGS definition, lower muscle mass is calculated by adjusting ASM for height [6]. However, in the study by Kim et al. [45] height-adjusted ASM was not related with age-related muscle loss whereas ASM adjusted for weight was. Further, in Korean population, sarcopenic obesity defined using ASM adjusted for weight was related with parameters of metabolic syndrome such as insulin resistance [46]. Thus, in Korean population, ASM adjusted for weight might be a better measure for lower lean mass. In our study, there was a 31.31% prevalence of lower lean mass, defined as ASM adjusted for weight and having cut-off values less than 1SD, based on gender-specific Koreans aged 20–39 years as the reference group. Batsis et al. [47] found the prevalence to range from 4.4% to 94.0%, depending on the study population, diagnosis definition, and the health status of the study population. Using the KNHANES data from 2008–2011, the prevalence of muscle mass loss in the Korean population was found to be 19.2%, 29.1%, and 42.3% in the groups aged 20–39, 40–64, and ≥ 65 years, respectively, using the ASM adjusted for weight definition and having cut-off values less than 1SD, based on gender-specific 20–39-year-olds as the reference group [25]. Using KNHANES 2008–2011 data, Kwon et al. [48] studied the relationship between high-risk alcohol consumption and sarcopenia (defined as muscle mass loss) and found that the prevalence of sarcopenia was 8.2% among the postmenopausal women, using ASM adjusted for weight definition and 2SD cut-off values. Different studies have shown that the muscle mass starts reducing from the third decade of an individual's life [9]. Through this slow decline, around 30% of the muscle mass is lost by the age of 80 years [3]. It has been estimated that in Korea, by 2050, the proportion of population aged ≥ 60 years will be 41.5% [49]. Thus, studying age-related diseases, such as muscle mass loss, is of utmost importance in the Korean population. Additionally, the decline in estrogen hormone with aging predisposes women to an increased risk of muscle mass loss. Thus, the major strength of the current study is that it is the first to investigate the role of dietary pattern in the risk of muscle mass loss in Korean postmenopausal women, using a factor analysis method.
There are several limitations to the present study. The factor analysis method involves many arbitrary and subjective decisions such as the food items to be included for analysis, categorization of food items into food groups, and patterns that are reported using the method of rotation and factor loading [50]. These decisions can determine the variance that is explained by the patterns identified. In the current study, the variance explained by the factors were low as 32.0%. Second, as the KNHANES is a cross-sectional study, a causal relationship between dietary factors and muscle mass loss cannot be concluded. Third, a single 24-h dietary recall method might not be sufficient to estimate the daily dietary intake. In the KNHANES, dietary intake assessed by a food frequency questionnaire is only available for the age group 19–64 years, whereas the 24-h dietary recall data is available for all age groups. Since this study included participants aged 45–86 years, the 24-h dietary recall data were used. However, in the 2009 KNHANES data, there was not much variation between the data obtained from dietary intake over 2–10 days and the single day 24-h recall method. Additionally, the detailed information about the intake of antioxidants in the form of dietary supplements was lacking.
In conclusion, we found the ‘Western’ pattern may be associated with a high risk of lower lean muscle mass. However, the mechanisms responsible for linking this dietary pattern with the risk of lower lean muscle mass are not fully known. Therefore, more studies are needed in the future to determine the factors that play a role in risk of muscle mass loss.
 XML Download