

 PDF
PDF Citation
 Print
Print


INTRODUCTION
Diabetes is a leading noncommunicable disease throughout the world. Over 425 million adults aged 20 to 79 years old (8.8% of the population) had type 2 diabetes mellitus (T2DM) worldwide in 2017, and the prevalence of diabetes is expected to increase to 693 million people by 2045 [1]. In China, the prevalence of T2DM was 6.6% of the population (about 90 million people) in 2016 [2]. Another national survey also showed that about 35.7% of Chinese adults had prediabetes in 2013 [3]. Thus, it is important to identify modifiable risk factors and early interventions to prevent the development of diabetes.
Evidence for a link between higher blood pressure (BP) and T2DM has been reported. A systematic review in 2015 including 4.1 million adults from 31 studies showed that 20 mm Hg higher systolic BP and 10 mm Hg higher diastolic BP were associated with a substantially elevated risk for T2DM [4]. However, there was remarkable variability in the magnitude of the association between studies in different populations, and none of the 31 studies was conducted in a Chinese population. Two recent large studies on this topic in China examined diabetes risk associated with a certain increase of BP, but they did not further delineate the impacts of prehypertension and hypertension on the risk of diabetes [56]. Thus, we hypothesize that a higher BP, including clinically relevant prehypertension and hypertension, could be a risk factor for the incidence of T2DM in Chinese adults. Given the increasing burden of diabetes and hypertension in China, it is necessary to examine their association in a large population-based cohort.
The China Health and Retirement Longitudinal Study (CHARLS) is a large ongoing multicenter longitudinal study including 17,708 middle-aged and elderly adults in China [7]. With complete biomarker measurements at baseline and repeated questionnaire surveys, it is a major source to explore determinants of noncommunicable diseases among Chinese adults. We utilized data from CHARLS to examine the association between the baseline BP and the risk of T2DM in Chinese adults aged 45 years and older in a comprehensive manner. In addition, we assessed the heterogeneity of their associations in different subgroups to identify particular high-risk groups.
METHODS
Study design
CHARLS is conducted by the China Center for Economic Research at Peking University. The design and methodology of CHARLS have been reported previously [7]. Briefly, it selected individual participants aged 45 years and older and their spouses through a multistage probability sampling procedure. A total of 17,708 participants (10,069 main respondents and 7,639 spouses) in 450 communities from 150 counties, encompassing 28 of the 32 provinces in China, were enrolled at baseline between June 2011 and March 2012, and followed up every 2 years. CHARLS was approved by the Biomedical Ethics Review Committee of Peking University (IRB00001052-11015), and informed consent was obtained from all participants [7].
Baseline data collection
Study participants were surveyed at baseline by trained interviewers on demographic and socioeconomic information, health status and functioning (such as self-reported general health and diagnosed chronic diseases), and lifestyle and behaviors (such as smoking, drinking, and physical activity) using a face-to-face computer-assisted personal interview. Anthropometric measurements such as height, weight, and waist circumference as well as physical performance measurements were obtained using standard devices, according prespecified protocols. Trained staff measured resting systolic and diastolic BP at the left brachial artery with an Omron HEM-7200 electronic monitor (Omron, Tokyo, Japan) when the participants were in the seated position. The BP measurements were repeated three times with a 45-second interval and were averaged for the final systolic and diastolic BP values. Blood samples (8 mL) were collected for bioassays, including fasting blood glucose (FBG) and glycosylated hemoglobin (HbA1c), at the Youanmen Center for Clinical Laboratory of Capital Medical University.
Baseline T2DM was determined by self-reported physician diagnosis and the FBG or HbA1c measurement (FBG ≥126 mg/dL or HbA1c ≥6.5%) [8]. Participants with baseline diabetes were excluded from our final analysis. Participants without diabetes were categorized as having prediabetes (100≤ FBG ≤125 mg/dL) or normal glucose tolerance (FBG <100 mg/dL) if they provided blood samples for FBG measurements [9]. BP was classified according to the 2010 Chinese Guidelines for the Management of Hypertension: normal BP group (systolic BP <120 mm Hg and diastolic BP <80 mm Hg), prehypertension group (systolic BP ≥120 and <140 mm Hg or diastolic BP ≥80 and < 90 mm Hg), and hypertension group (systolic BP ≥140 mm Hg or diastolic BP ≥90 mm Hg) [10]. A self-reported physician diagnosis of hypertension at baseline was also regarded as prevalent hypertension. Dyslipidemia was defined as total cholesterol/high density lipoprotein cholesterol >5.0 [11] or self-reported dyslipidemia to avoid the effect of lipid-lowering medication. Participants were regarded as having self-reported dyslipidemia if they answered ‘yes’ to the following question. “Have you been diagnosed with dyslipidemia (elevation of low density lipoprotein cholesterol, total triglycerides, and total cholesterol, or low high density lipoprotein cholesterol) by a doctor?”
Ascertainment of diabetes during follow-up
Study participants were followed up every 2 years through a face-to-face interview to assess the same measurements determined at baseline. The two follow-up interviews were administered in 2013 to 2014 (n=15,788) and 2015 to 2016 (n=15,331). Health outcomes such as diabetes, heart disease, hypertension, and stroke were collected in the two follow-up surveys. Blood samples were collected at every second follow-up in CHARLS, but the second blood sampling was not completed in the current follow-ups. Therefore, we determined the status of incident T2DM according to self-reported physician diagnosis of diabetes in either of the two follow-ups instead of using blood glucose measurements.
Statistical analysis
A total of 17,596 participants who were enrolled at baseline completed the two follow-up surveys. We excluded 2,066 participants with prevalent diabetes at baseline, including 63 who lacked information of diabetes, 2,394 without BP measurements, and 444 with incomplete data for major covariates including age, sex, education level, residence, smoking status, alcohol consumption, body mass index (BMI), waist circumference, and dyslipidemia. We also excluded 2,987 participants who lacked information of diabetes in both follow-up surveys or who lacked information of diabetes in the second follow-up survey if no diabetes was reported in the first follow-up survey. A total of 9,642 participants were included in the primary analyses. Continuous variables such as BMI, waist circumference, and BP were summarized as mean±standard deviation, while categorical variables such as sex and smoking status were summarized as absolute counts (percentages). Multivariable logistic regression analyses were applied to examine associations between BP and T2DM. Odds ratios (ORs) and their 95% confidence intervals (CIs) were estimated after adjustment for sex (male and female), age (continuous, year), and education level (illiterate, primary/middle school, and high school or above) in the first model, and additionally for residence (rural and urban), smoking status (never smoker, former smoker, and current smoker), alcohol consumption (never drinker and former/current drinker), BMI (continuous, kg/m2), waist circumference (continuous, cm), and dyslipidemia (yes and no) in the second model. All covariates were collected during the baseline survey in 2011 to 2012. We also performed stratified analyses by sex, age, residence, education level, BMI, smoking status, and alcohol consumption. In a sensitivity analysis, we restricted our analyses in participants with baseline FBG, and separately examined the impact of higher BP on the risk of diabetes in participants with a normal FBG and those with prediabetes. To minimize the impact of antihypertensive medications, we also conducted another sensitivity analysis by excluding participants who self-reported previously diagnosed hypertension. Statistical analyses were done by Stata version 14.0 software (StataCorp., College Station, TX, USA). All P values were two-sided, and statistical significance was defined as P<0.05.
RESULTS
Baseline characteristics of study participants in CHARLS
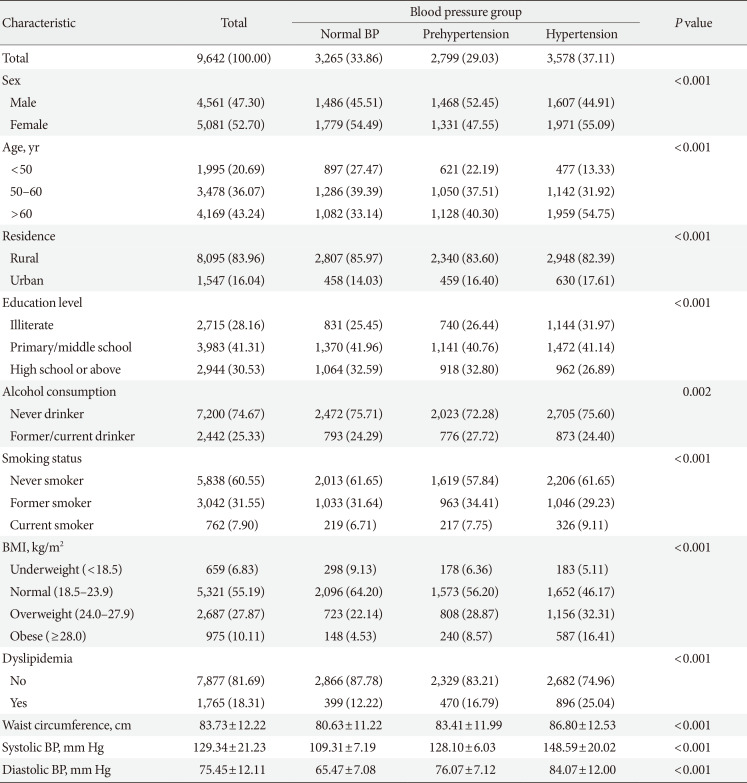
Of 9,642 participants without prevalent diabetes, the mean age at baseline was 58.8±9.2 years old. A total of 3,578 participants (37.11%) had hypertension, while 2,799 (29.03%) had prehypertension (Table 1). Compared with the participants who had a normal BP, those who had hypertension were more likely to be old, obese, and to have dyslipidemia, but they were less likely to be well educated. Systolic BP, diastolic BP, and waist circumference also increased with categories of higher BP at baseline.
Association between higher BP and incident T2DM
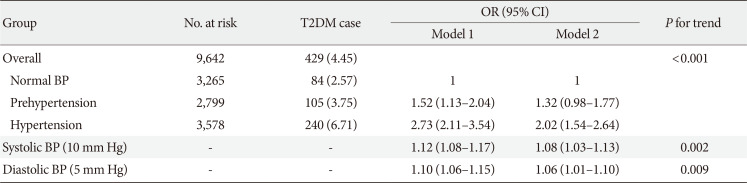
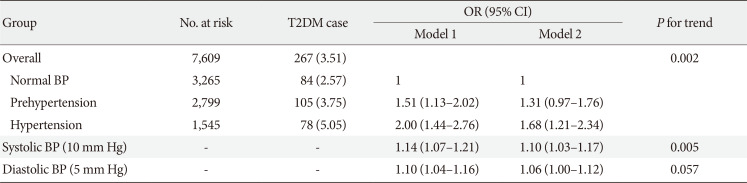
During the 4-year follow-up, 429 participants (4.45%) developed diabetes mellitus, including 3.51% of the men and 5.29% of the women. The incidence of diabetes was 2.57%, 3.75%, and 6.71% in the normal BP, prehypertension, and hypertension groups, respectively (Table 2). Compared to participants with a normal BP, those with prehypertension (OR, 1.32; 95% CI, 0.98 to 1.77) and hypertension (OR, 2.02; 95% CI, 1.54 to 2.64) were at higher risk for incident T2DM after adjustment for age, sex, education level, residence, smoking status, alcohol consumption, BMI, waist circumference, and dyslipidemia. A linear trend was noted for the association between BP and the risk of incident T2DM (P for trend <0.001). The ORs associated with T2DM were 1.08 (95% CI, 1.03 to 1.13) per 10 mm Hg higher systolic BP and 1.06 (95% CI, 1.01 to 1.10) per 5 mm Hg higher diastolic BP (Table 2).
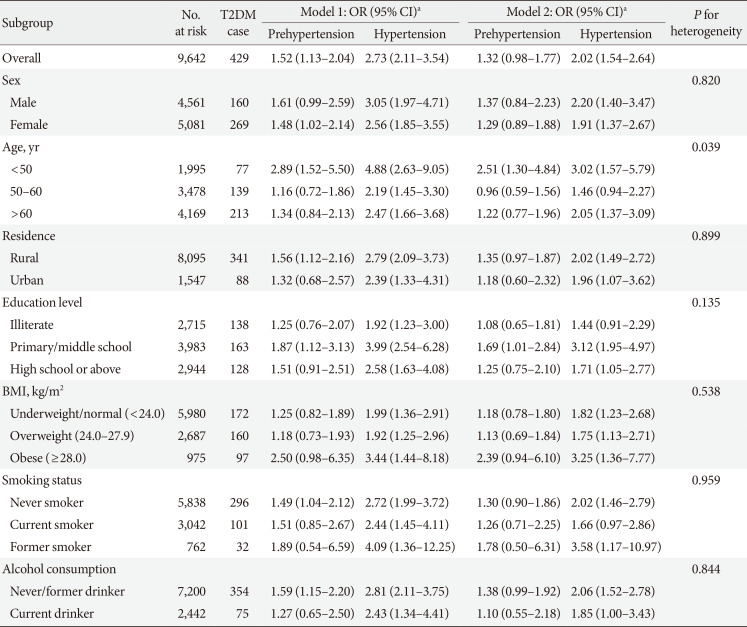
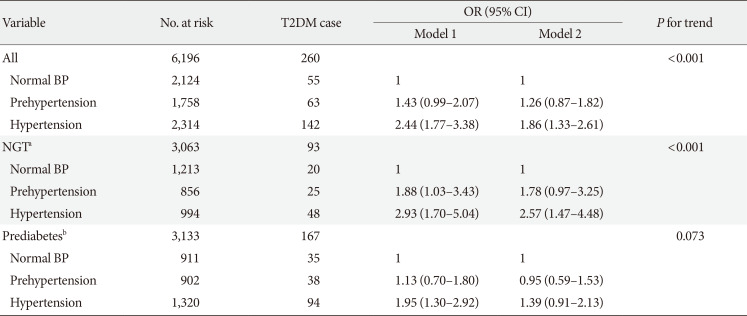
We did not observe any heterogeneity for the associations between higher BP and incident diabetes in the subgroups stratified by sex, age, residence, education level, BMI, smoking status, or alcohol consumption (Table 3). Generally, there were increased odds of diabetes associated with both prehypertension and hypertension in all subgroups stratified. The association with diabetes was stronger in participants younger than 50 years old than the other age groups: OR of 2.51 (95% CI, 1.30 to 4.84) for prehypertension and OR of 3.02 (95% CI, 1.57 to 5.79) for hypertension. In participants with normal glucose tolerance, both those with hypertension (OR, 2.57; 95% CI, 1.47 to 4.48) and those with prehypertension (OR, 1.78; 95% CI, 0.97 to 3.25) were more likely to develop incident diabetes compared to their counterparts with a normal BP, despite the lack of statistical significance for the latter (Table 4). However, the associations were weaker and not statistically significant for either prehypertension or hypertension in participants with prediabetes. In addition, when 2,033 participants who reported previously diagnosed hypertension were excluded, the association did not change appreciably (Table 5).
DISCUSSION
The major finding of this large prospective study is that both hypertension and prehypertension were associated with higher risk of incident T2DM, compared to normal BP in Chinese adults, independent of major risk factors for diabetes. In general, higher BP was associated with increased risk of T2DM in this Chinese population. The positive associations were consistent with those from a systematic review among 4.1 million adults [4] as well as those from two recent Chinese studies [56]. Our findings, together with others, imply that higher BP may be a modifiable risk factor for T2DM in Chinese adults.
Our study found that the risk of incident diabetes rose with the increase of BP and that participants with normal BP at baseline had the lowest risk of developing diabetes, even in analyses stratified by baseline glucose levels. Prehypertension as well as hypertension increased the risk of T2DM by 32% and 102%, respectively. Although there have been several studies on the impact of higher BP on incident T2DM globally, it is still understudied in the Chinese population, in whom only two studies have examined the impact of BP as a continuous risk factor for diabetes; in addition, the excess risk associated with prehypertension and hypertension was not assessed [56]. Our effect estimates associated with prehypertension and hypertension are comparable to those reported in other Asian studies, including two Korean studies (1.27 and 1.51 for prehypertension and hypertension, respectively, among 7,150 participants [9]; 1.23, 1.26, and 1.60 for prehypertension, stage 1 hypertension, and stage 2 hypertension, respectively, among 10,038 participants [12]) and a Japanese study (1.39 and 1.76 for prehypertension and hypertension, respectively, among 7,594 participants [13]). Although the BP in these studies was grouped similarly, the ascertainment of incident diabetes during follow-up varied: (1) 75-g oral glucose tolerance test (OGTT) alone [12]; (2) 75-g OGTT, HbA1c, or use of hypoglycemic agents [9]; and (3) fasting glucose or 75-g OGTT [13]. In addition, we noted that participants with normal glucose tolerance showed strong positive associations between higher BP and diabetes, while these associations were weaker and not statistically significant in those with prediabetes, which was consistent with the finding in a study of Koreans [9]. This finding implies that the role of higher BP in the development of T2DM might be diminished by other competing risk factors when glucose tolerance is compromised. Of note, none of the previous prospective studies on the association between BP and T2DM among the Chinese population explored this heterogeneity of effect sizes. In the current study, the stronger positive association between a higher BP and T2DM among participants younger than 50 years old versus that in other age groups may suggest that higher BP in young people deserves particular attention for susceptibility to risk of diabetes.
Our study also showed that an increase of 10 mm Hg in systolic BP or 5 mm Hg in diastolic BP was associated with an 8% (OR, 1.08; 95% CI, 1.03 to 1.13) or 6% (OR, 1.06; 95% CI, 1.01 to 1.10) increased risk of incident T2DM in 4 years, although there was only borderline statistical significance. These estimates were equivalent to those associated with the same time-cumulative systolic BP or diastolic BP change (4% [hazard ratio, 1.04; 95% CI, 1.03 to 1.04] and 2% [hazard ratio, 1.02; 95% CI, 1.02 to 1.03]) in the longitudinal Kailuan Study in China [6], but the estimate for each 10-mm Hg change was lower than the 14% reported in the China Kadoorie Biobank study [5]. Overall, the increased risk of T2DM in Chinese populations was much lower than that reported in the large systematic review of 31 prospective studies predominantly conducted in Western populations (relative risk of 1.76 for a 20-mm Hg change in systolic BP or a relative risk of 1.32 for a 10-mm Hg change) [4]. Of note, a large Mendelian randomization study using 28 genetic variants as an instrumental variable to exclude confounding effects showed that genetically elevating the systolic BP by 1 mm Hg was associated with a 2% increased risk of T2DM [14] (or 22% for a 10-mm Hg change in systolic BP) [14] in Europeans. The inconsistencies between the magnitude of effect estimates may reflect the differential role of higher BP in the development of diabetes for different populations.
Although there are no confirmed mechanisms, inflammation, oxidative stress, endothelial dysfunction, insulin resistance, and genetic predisposition have been proposed to explain the link between higher BP and diabetes. First, inflammation and oxidative stress may be shared pathways for diabetes and hypertension [15]. For example, inflammatory biomarkers such as C-reactive protein have been reported to be associated with both an elevated BP [1617] and diabetes [18] in the general population. Second, hypertension is involved in the development of endothelial dysfunction, whose biomarkers are associated with increased risk of diabetes [181920]. Third, insulin resistance as a precursor to diabetes is thought to increase the risk of hypertension [21] and thus can partly explain the link between BP and diabetes. Fourth, there seems to be a shared genetic susceptibility for hypertension and diabetes [15]. Variants in genes encoding adiponectin, apolipoprotein, and adrenomedullin have been found to correlate with both hypertension and diabetes. In addition, some genetic variants predisposing individuals to diabetes are also closely associated with a higher risk of hypertension. Despite these putative mechanisms, there is still a lack of clinical trials to demonstrate the effectiveness of reducing BP for the prevention of diabetes. Limited evidence from randomized trials shows that reduced incidence of diabetes is associated with lower BP, but the effects are restricted to the use of angiotensin-converting enzyme inhibitors and angiotensin receptor blockers [22]. Thus, it is still uncertain whether the association between elevated BP and diabetes is causal.
Our study has certain strengths, including prospective nature, large sample size, population-based design, and comprehensive follow-up. However, there are still some limitations to acknowledge. First, T2DM was mainly ascertained by self-reporting of physician diagnosis in follow-up surveys. This may lead to misclassification due to underreporting in underdeveloped areas where screening for diabetes is not routine in regular physical check-ups [23]. Second, we could not fully control for potential confounding effects from BP control in the analyses due to a lack of information regarding antihypertensive medications. Previous trials have demonstrated that BP reduction by certain antihypertensive medications can reduce the risk of diabetes [22]. However, our sensitivity analysis after exclusion of participants with a reported physician diagnosis of hypertension showed that the associations remained robust when the effect of antihypertensive medications was partly considered. Third, the BP information was not updated in our analyses due to data availability, which is also a weakness of our analytical approach based on logistical regression. Future analyses using time-dependent modeling that incorporates exposure updates and time-to-event information may improve our estimates. Fourth, the duration of the total follow-up was only about 4 years, which is shorter than that reported in earlier studies. A longer-term follow-up may be necessary to corroborate our findings in the Chinese population. Since the mean age of our study participants was approximately 60 years old, many of the ascertained prehypertension/hypertension cases at baseline may presumably have been in that state for years, which means a much longer exposure than the 4 years of follow-up. Thus, the associations observed between hypertension and incident diabetes in our study were still considered reasonable.
In conclusion, our study demonstrates that higher BP was associated with increased risk of incident diabetes in Chinese adults and that both hypertension and prehypertension were risk factors of diabetes, independent of other risk factors for diabetes. Our findings imply that BP control, such as monitoring and management, may play an important role in diabetes prevention. However, evidence from clinical trials is still needed to confirm the benefits of BP control.
 XML Download